Efficient float32 arithmetic in JavaScript

There are several different ways to represent floating-point numbers in computers: most architectures now use the IEEE754 standards, representing double precision numbers with 64 bits (a.k.a double, or float64) and single precision numbers with 32 bits (a.k.a float32). As its name suggests, a float64 has more precision than a float32, so it’s generally advised to use it, unless you are in a performance-sensitive context. Using float32 has the following advantages:

  • Float32 operations often require less CPU cycles as they need less precision.
  • There is additional CPU overhead if the operands to a float64 operation are float32, since they must first be converted to float64. (This can be the case in code that uses Float32Array to store data, which is often true for JS code using WebGL, as well as Emscripten-compiled code where a float in C++ is stored as a float32 in memory but uses JavaScript float64 arithmetic.)
  • Float32 numbers take half the space, which can decrease the total memory used by the application and increase the speed of memory-bound computations.
  • Float32 specializations of math functions in several standard C libraries we’ve tested are way faster than their float64 equivalents.

In JavaScript, number values are defined to be float64 and all number arithmetic is defined to use float64 arithmetic. Now, one useful property of float64 arithmetic that JavaScript engines have taken advantage of for a long time is that, when a float64 is a small-enough integer, the result of a float64 operation is the same as the corresponding integer operation when there is no integer overflow. JavaScript engines take advantage of this by representing integer-valued numbers as raw integers and using integer arithmetic (and checking for overflow). In fact, there are at least 3 different integer representations in use that I know of: 31-bit integers, int32_t and uint32_t (see this post about value representation by Andy Wingo for more).

Given all this, a good question is: can we do a similar optimization for float32? Turns out, the answer is “sometimes” and, using the new Math.fround function in the upcoming ES6 spec, the programmer has a good way to control when.

When can we safely use float32 operations instead of float64 operations

There is an interesting commutative identity satisfied by some float64 and float32 operations, as stated by Samuel A. Figueroa in “When is double rounding innocuous?” (SIGNUM Newsl. 30, 3, July 1995, 21-26): as long as the original inputs are float32, you can either use float32 operations or float64 operations and obtain the same float32 result. More precisely, for op one of {+,-,*,/}, and op_f32 the float32 overload and op_f64 the float64 overload, and x,y float32 values, the following identity holds, expressed as C++ code:

  assert(op_f32(x,y) == (float) op_f64( (double)x, (double)y ));

The analogous unary identity also holds for sqrt and several other Math functions.

This property relies crucially on the casts before and after every single operation. For instance, if x = 1024, y = 0.0001, and z = 1024, (x+y)+z doesn’t have the same result when computed as two float32 additions as when computed as two float64 additions.

This identity provides the preconditions that allow a compiler to soundly use float32 instructions instead of float64 instructions. Indeed, gcc will take advantage of this identity and, for expressions of the form on the right of the equation, will generate float32 code corresponding to the expression on the left.

But when does JavaScript ever have a float32 value? In HTML5 (with WebGL and, thus, Typed Arrays), the answer is: when reading from or writing to a Float32Array. For example, take this piece of code:

  var f32 = new Float32Array(1000);
  for(var i = 0; i < 1000; ++i)
    f32[i] = f32[i] + 1;

The addition inside the loop exactly matches the identity above: we take a float32 value from f32, convert it to a float64, do a float64 addition, and cast the result back to a float32 to store in f32. (We can view the literal 1 as a float32 1 cast to a float64 1 since 1 is precisely representable by a float32.)

But what if we want to build more complicated expressions? Well, we could insert unnecessary Float32Array loads and stores between each subexpression so that every operation's operands were a load and the result was always stored to a Float32Array, but these additional loads and stores would make our code slower and the whole point is to be fast. Yes, a sufficiently smart compiler might be able to eliminate most of these loads/stores, but performance predictability is important so the less fragile we can make this optimization the better. Instead, we proposed a tiny builtin that was accepted into the upcoming ES6 language spec: Math.fround.

Math.fround

Math.fround is a new Math function proposed for the upcoming ES6 standard. This function rounds its input to the closest float32 value, returning this float32 value as a number. Thus, Math.fround is semantically equivalent to the polyfill:

  if (!Math.fround) {
    Math.fround = (function() {
      var temp = new Float32Array(1);
      return function fround(x) {
        temp[0] = +x;
        return temp[0];
      }
    })();
  }

Note that some browsers don't support Typed Arrays; for these, more complex polyfills are available. The good news is that Math.fround is already implemented both in SpiderMonkey (the JavaScript engine behind Firefox) and JavaScriptCore (the JavaScript engine behind Safari). Moreover, v8's team plans to add it as well, as states this issue.

As a result, the way to chain float32 operations is simply to wrap any temporary result in a call to Math.fround:

  var f32 = new Float32Array(1000);
  for(var i = 0; i < 999; ++i)
    f32[i] = Math.fround(f32[i] + f32[i+1]) + 1;

In addition to allowing the programmer to write faster code, this also allows JS compilers, like Emscripten to better compile float32 in the source language. For example, Emscripten currently compiles C++ float operations to JavaScript number operations. Technically, Emscripten could use Float32Array loads/stores after every operation to throw away the extra float64 precision, but this would be a big slowdown, so fidelity is sacrificed for performance. Although it's quite rare for this difference to break anything (if it does, the program is likely depending on unspecified behavior), we have seen it cause real bugs in the field and these are not fun to track down. With Math.fround, Emscripten would be able to be both more efficient and higher fidelity!

Float32 in IonMonkey

My internship project was to bring these optimizations to Firefox. The first step was to add general support for float32 operations in the IonMonkey JIT backend. Next, I added Math.fround as a general (unoptimized) builtin to the JavaScript engine. Finally, I added an optimization pass that recognizes Float32Array/Math.fround and uses their commutative properties to emit float32 operations when possible. These optimizations are enabled in Firefox 27 (which is currently in the Aurora release channel)

So, how does it perform? Microbenchmarks (in both C++ and JavaScript) show large speedups, up to 50%. But micro-benchmarks are often misleading, so I wrote the following more-realistic benchmarks to see what sort of speedups on float32-heavy computations we can expect to see in practice:

  • Matrix inversions: this benchmark creates a bunch of matrixes, inverts them and multiplies them back with the original, to be able to compare the precision loss when using float32 or float64. It uses an adapted version of gl-matrix, which is a framework used for real-world applications using WebGL matrixes. For the float32 version, only calls to Math.fround have been added.

  • Matrix graphics: this benchmarks also creates a bunch of matrixes and applies some operations that are frequently used in graphics: translation, rotation, scaling, etc. This one uses a lot of basic operations and more complex operations (like calls to Math.cos and Math.sin for the rotation). Thus, it shows great improvements when the float32 equivalent forms of these functions are faster. Once more, it uses the adapted version of gl-matrix

  • Exponential: this benchmark fills a big Float32Array with predictable values and then computes the exponential of each element by using the first elements of the exponential's power series. The main purpose of this benchmark is just to pound on addition and multiplication.

  • Fast Fourier Transform: this benchmark creates a fake sample buffer and then applies several steps of Fast Fourier Transform. It also consists of basic operations and some calls to Math.sqrt. The FFT code is taken from an existing library, dsp.js.

The following table shows results on several different devices, when run on the latest Firefox Nightly. The number indicates the obtained speedup from using code that has been optimized to use Math.fround to allow the float32 optimization described above (thus the higher, the better). The desktop machine used is a ThinkPad Lenovo W530 (Intel(R) Core(TM) i7-3820QM CPU @ 2.70GHz, 8 cores, 16 GB RAM). When a line indicates a phone or tablet device, the device runs the latest Firefox Nightly for Android version. Once you've read these results, you can try to run these benchmarks by yourself! (Don't forget to use Firefox 27 or greater!) You can see the benchmark source on github (on the gh-pages branch).

Device Matrix Inversions Matrix Graphics Exponential FFT
Desktop (x86) 33% 60% 30% 16%
Google Nexus 10 (ARM) 12% 38% 33% 25%
Google Nexus 4 (ARM) 42% 26% 38% 5%
Samsung Galaxy S3 (ARM) 38% 38% 24% 33%

Polyfilling Math.fround

What can we do before Math.fround is available and optimized in all JS engines? Instead of using a faithful polyfill like the one shown above, we can simply use the identity function:

  var fround = Math.fround || function(x) { return x }

This is what the above benchmarks use, and, as stated above, most code won't notice the difference.

What's nice is that all modern JS engines will usually inline small functions in their high-end JIT so this polyfill shouldn't penalize performance. We can see this to be the case when running the four benchmarks shown above in, e.g., Chrome Dev. However, we have seen some cases in larger codes where inlining is not performed (perhaps the max inlining depth was hit or the function wasn't compiling in the high-end JIT for some reason) and performance suffers with the polyfill. So, in the short term, it's definitely worth a try, but be sure to test.

Conclusion

The results are very encouraging. Since Math.fround is in the next ES6 standard, we are hopeful that other JS engines will choose to make the same optimizations. With the Web as the game platform, low-level optimizations like these are increasingly important and will allow the Web to get ever closer to native performance. Feel free to test these optimizations out in Firefox Nightly or Aurora and let us know about any bugs you find.

I would like to thank all those who participated in making this happen: Jon Coppeard and Douglas Crosher for implementing the ARM parts, Luke Wagner, Alon Zakai and Dave Herman for their proof-reading and feedback, and more generally everyone on the JavaScript team for their help and support.
Staring at the Sun: Dalvik vs. ASM.js vs. Native

As many of you are probably already aware, Mozilla has recently gotten into the mobile OS space with Firefox OS. Firefox OS is built using web technologies like HTML, CSS, and of course Javascript. All Firefox OS apps are built on these technologies, including core platform apps.

Given that app logic in Firefox OS will be written in Javascript, one of the questions facing Mozilla’s Javascript engine (SpiderMonkey) is how it stacks up against other language platforms on mobile devices. To try to get some insight into that question, I spent a little time over the last two weeks conducting a small performance experiment.

the experiment

Starting with the SunSpider benchmark as a base, I ported a handful of programs from Javascript to both Java and C++, being as faithful as possible to the original logic. I compiled the Java version into an Android Dalvik app, and I compiled the C++ version with emscripten to produce asm.js code.

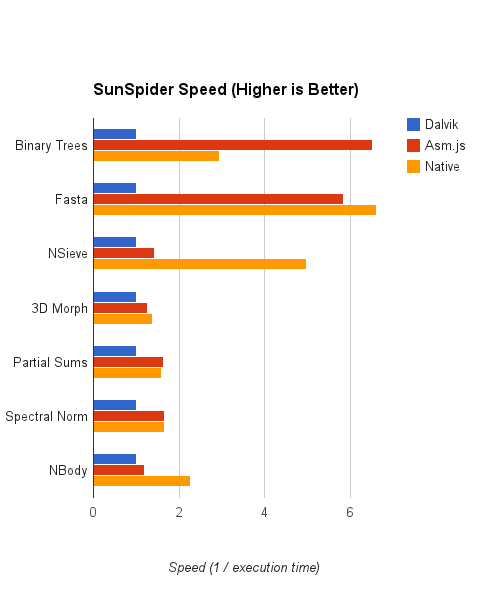
Then I measured the following times on a Nexus 4:

  1. Dalvik app, running directly on Android
  2. Asm.js code (compiled from C++), running on Mobile Firefox Nightly
  3. Native code (compiled from C++), running directly on Android (compiled using ndk-build V=1 TARGET_ARCH_ABI=armeabi-v7a)

I took the inverse of the running times (so that higher scores would be better), and scaled all results so that Dalvik had a score of 1 for each program.

I also looped the runs 10 to 1000 times (depending on the program) to give the optimizing engines an opportunity to compile the hot code. Typically, SunSpider programs take a fraction of a second to run. Longer runtimes make SunSpider mimic app execution conditions, since apps typically run from dozens of seconds to minutes at a time.

The ported programs were binary-trees, 3D-morph, partial-sums, fasta, spectral-norm, nsieve, and nbody. You can obtain the source code at:

http://github.com/kannanvijayan/benchdalvik

the disclaimer

I want to be very clear about this up-front: I don’t think SunSpider is a great benchmark for sophisticated performance analysis. It’s really much closer to a collection of micro-benchmarks that cover a limited baseline level of performance measurement.

I chose SunSpider for this experiment because it contains small benchmarks that are easy to hand port, and because there is a clear translation from the Javascript source to a comparable C++ or Java source. Comparing different language platforms is not an exact science. Even in these simple micro benches, it behooves us to properly analyze and evaluate the results.

the results

Disclaimers aside, you may be surprised at the results:

Benchmark Results

The graph above shows asm.js doing pretty well, rivaling or beating native on some benchnmarks (binary-trees). The numbers by themselves, however, aren’t as useful or as interesting as the reasons why. Let’s dissect the results from most interesting to least interesting.

the analysis

Binary Trees

The binary trees score is very surprising. Here, the asm.js version actually does significantly better than native. This result seems very counter-intuitive, but it may have a reasonable explanation.

Notice that binary-trees allocates a lot of objects. In C++, this causes many calls to malloc. When compiled to native code, the malloc implementation occasionally uses expensive system calls to allocate new memory from the system.

In asm.js, the compiled C++ is executed using a Javascript typed array as the “machine memory”. The machine memory is allocated once and then used for the entire program runtime. Calls to malloc from asm.js programs perform no syscalls. This may be the reason behind asm.js-compiled C++ doing better than native-compiled C++, but requires further investigation to confirm.

Another question is why Dalvik does so badly. This is the kind of thing Java should excel at: simple, fixed size class, lots of small allocations, etc. I don’t have a good answer to this question – this score actually genuinely surprised me, as I was expecting Dalvik to come out stronger than it did.

This is pure speculation, but I think Dalvik’s score may be a consequence of its tracing JIT. After speaking to people with tracing JIT experience, I learned that compiling recursion using tracing JITs can be very difficult. Given that binary trees spends most of its time in a few recursive functions, this might explain Dalvik’s result. If a reader has better insight into this score and what might be causing it, I would love your feedback.

Fasta

Note that the fasta program has been modified to move the makeCumulative operation out of the main loops and into the the setup code.

Asm.js and native C++ both come out far ahead of Dalvik, with native gaining a bit of an edge over asm.js. Let’s analyze what’s going on here.

It’s easy to see from the code that the program spends a LOT of time iterating across an associative array and accessing its values. In the C++/asm.js implementation, this is turned into an efficient iteration across a hash_map composed of inlined char keys and double values. In Java, this is an iteration across a java.util.HashMap, which stores heap-boxed Character and Double instances.

The Java hash table iteration incurs heavy overhead and indirection. The iteration traverses pointers to Map.Entry objects instead of directly iterating across fixed-size entries (as in C++), and it is forced to extract char and double values from heap-allocated Character and Double objects. Java collections are extremely powerful, but they tend to show their strengths more on large collections of more complex objects than on small collections of primitive values. The tiny lookup tables in fasta work against Java’s strengths.

The C++/asm.js version has a more efficient storage of these values, as well as a more efficient iteration across them. C++/asm.js also uses one-byte chars, as opposed to Java and Javascript’s two-byte chars, which means the C++/asm.js implementation generally touches less memory.

Breaking it down, the fasta benchmark’s main measurement is how fast the language can do lookups on small associative arrays. I believe Dalvik doesn’t do too well here because of Java peculiarities: collections not holding primitive values, and collection iteration having heavy overhead.

That said, it’s nice to see asm.js coming reasonably close behind native.

NSieve

In this benchmark, asm.js comes in about 3x slower than native, and slightly ahead of Dalvik.

This was an unexpected result – I had expected asm.js to be much closer to native speed. Alon Zakai (Mozilla researcher and author of emscripten, the tool that compiles C++ to asm.js) informs me that on desktop (x86) machines, the asm.js score is around 84% of the native score. This suggests that the problem lies in Spidermonkey’s ARM code-generation, and should be able to be improved upon.

3D Morph, Partial Sums, and Spectral Norm

I’m lumping these together because I feel that their scores all have basically the same explanation.

Native, asm.js, and Dalvik all have pretty similar scores, with native beating asm.js by a bit, and asm.js beating Dalvik by a slightly bigger bit. (Ignore the part where asm.js seems to come ahead of native on partial sums – I’m pretty sure that’s just measurement noise, and that the scores are actually just neck and neck).

The thing about these programs is that they’re all very double-precision-floating-point-heavy. These operations on an ARM cpu tend to be very expensive, and speed differences in other parts of the code would be underrepresented in the overall score.

The most surprising aspect of these results is not the asm.js vs native score, but the fact that Dalvik seems to lag behind about 20-30% from the asm.js scores.

NBody

In nbody, asm.js edges out Dalvik, but clocks in at about half the speed of the native code.

I have a guess about why asm.js is only half as fast as native here. The nbody code performs a lot of double-indirections: pulling a pointer out of an array, and then reading from memory at an offset from that pointer. Each of those reads can be implemented on ARM in a single instruction using the various addressing modes for the ARM LDR instruction.

For example, reading an object pointer from an array of pointers, and then reading a field within that object, would take two instructions:

LDR TargetReg, [ArrayReg + (IndexReg leftshift 2)]
LDR TargetReg, [TargetReg + OffsetOfField]

(Above, ArrayReg is a register holding a pointer to the array, IndexReg is a register holding the index within the array, and OffsetOfField is a constant value)

However, in asm.js, the “memory” reads are actually reads within a typed array, and “pointers” are just integer offsets within that array. Pointer dereferences in native code become array reads in asm.js code, and these reads must be bounds-checked as well. The equivalent read in asm.js would take five instructions:

LDR TargetReg, [ArrayReg + (IndexReg leftshift 2)]
CMP TargetReg, MemoryLength
BGE bounds-check-failure-address
LDR TargetReg, MemoryReg + TargetReg
LDR TargetReg, [TargetReg + OffsetOfField]

(Above, ArrayReg, IndexReg, and OffsetOfField are as before, and MemoryReg is a register holding a pointer to the base of the TypedArray used in asm.js to represent memory)

Basically, asm.js adds an extra level of indirection into the mix, making indirect memory reads more expensive. Since this benchmark relies heavily on performing many of these within its inner loops, I expect that this overhead weighs heavily.

Please keep in mind that the above reasoning is just an educated guess, and shouldn’t be taken as fact without further verification.

the takeaway

This experiment has definitely been interesting. There are a couple of takeaway conclusions I feel reasonably confident drawing from this:

1. Asm.js is reasonably competitive with native C++ code on ARM. Even discarding the one score where asm.js did better, it executes at around 70% of the speed of native C++ code. These results suggest that apps with high performance needs can use asm.js as the target of choice for critical hot-path code, achieving near native performance.

2. Asm.js competes very well on mobile performance compared to Dalvik. Even throwing out the benchmarks that are highly favourable to asm.js (binary-trees and fasta), there seems to be a consistent 10-50% speedup over comparable Dalvik code.

the loose ends

The astute reader may at this point be wondering what happened to the plain Javascript scores. Did regular Javascript do so badly that I ignored them? Is there something fishy going on here?

To be frank, I didn’t include the regular Javascript scores in the results because regular Javascript did far too well, and I felt that including those scores would actually confuse the analysis instead of help it.

The somewhat sad fact is that SunSpider scores have been “benchmarketed” beyond reason. All Javascript engines, including SpiderMonkey, use optimizations like transcendental math caches (a cache for operations such as sine, cosine, tangent, etc.) to improve their SunSpider scores. These SunSpider-specific optimizations, ironically, make SunSpider a poor benchmark for talking about plain Javascript performance.

If you really want to see how plain Javascript scores alongside the rest, click the following link:

http://blog.mozilla.org/javascript/files/2013/08/Dalvik-vs-ASM-vs-Native-vs-JS.png

the errata

HackerNews reader justinsb pointed out a bug in my C++ and Java code for spectral norm (https://news.ycombinator.com/item?id=6174204). Programs have been re-built and the relevant numbers re-generated. The chart in the main post has been updated. The old chart is available here:

https://blog.mozilla.org/javascript/files/2013/08/Dalvik-vs-ASM-vs-Native.png

Clawing Our Way Back To Precision

JavaScript Memory Usage

Web pages and applications these days are complex and memory-hungry things. A JavaScript VM has to handle megabytes and often gigabytes of objects being created and, sometime later, forgotten. It is critically important for performance to manage memory effectively, by reusing space that is no longer needed rather than requesting more from the OS, and avoiding wasted gaps between the objects that are in use.

This article describes the internal details of what the SpiderMonkey engine is doing in order to move from a conservative mark-and-sweep collector to a compacting generational collector. By doing so, we hope to improve performance by reducing paging and fragmentation, improving cache locality, and shaving off some allocation overhead.

Conservative Garbage Collection

Since June of 2010, Spidermonkey has used a conservative garbage collector for memory management. When memory is getting tight, or any of various other heuristics say it’s time, we stop and run a garbage collection (GC) pass to find any unneeded objects so that we can free them and release their space for other uses. To do this, we need to identify all of the live objects (so then everything left over is garbage.) The JSAPI (SpiderMonkey’s JavaScript engine API) provides a mechanism for declaring a limited set of objects are live. Those objects, and anything reachable from those objects, must not be discarded during a garbage collection (GC). However, it is common for other objects to be live yet not reachable from the JSAPI-specified set — for example, a newly-created object that will be inserted into another object as a property, but is still in a local variable when a GC is triggered. The conservative collector scans the CPU registers and stack for anything that looks like a pointer to the heap managed by the garbage collector (GC). Anything found is marked as being live and added to the preexisting set of known-live pointers using a fairly standard incremental mark-and-sweep collection.

Conservative garbage collection is great. It costs nothing to the main program — the “mutator”1 in GC-speak — and makes for very clean and efficient pointer handling in the embedding API. An embedder can store pointers to objects managed by the Spidermonkey garbage collector (called “GC things“) in local variables or pass them through parameters and everything will be just fine.

Consider, for example, the following code using SpiderMonkey’s C++ API :

  JSObject *obj1 = JS_NewObject(cx);
  JSObject *obj2 = JS_NewObject(cx);
  JS_DefineProperty(obj2, "myprop", obj1);

In the absence of conservative scanning, this would be a serious error: if the second call to JS_NewObject() happens to trigger a collection, then how is the collector to know that obj1 is still needed? It only appears on the stack (or perhaps in a register), and is not reachable from anywhere else. Thus, obj1 would appear to be dead and would get recycled. The JS_SetProperty() call would then operate on an invalid object, and the bad guys would use this to take over your computer and force it to work as a slave in a global password-breaking collective. With conservative scanning, the garbage collector will see obj1 sitting on the stack (or in a register), and prevent it from being swept away with the real trash.

Exact Rooting

The alternative to conservative scanning is called “exact rooting”, where the coder is responsible for registering all live pointers with the garbage collector. An example would look like this:

  JSObject *obj1 = JS_NewObject(cx);
  JS_AddObjectRoot(cx, obj1);
  JSObject *obj2 = JS_NewObject(cx);
  JS_DefineProperty(obj2, "myprop", obj1);
  JS_RemoveObjectRoot(cx, obj1);

This, to put it mildly, is a big pain. It’s annoying and error-prone — notice that forgetting to remove a root (e.g. during error handling) is a memory leak. Forgetting to add a root may lead to using invalid memory, and is often exploitable. Language implementations with automatic memory management often start out using exact rooting. At some point, all the careful rooting code gets to be so painful to maintain that a conservative scanner is introduced. The embedding API gets dramatically simpler, everyone cheers and breathes a sigh of relief, and work moves on (at a quicker pace!)

Sadly, conservative collection has a fatal flaw: GC things cannot move. If something moved, you would need to update all pointers to that thing — but the conservative scanner can only tell you what might be a pointer, not what definitely is a pointer. Your program might be using an integer whose value happens to look like a pointer to a GC thing that is being moved, and updating that “pointer” will corrupt the value. Or you might have a string whose ASCII or UTF8 encoded values happen to look like a pointer, and updating that pointer will rewrite the string into a devastating personal insult.

So why do we care? Well, being able to move objects is a prerequisite for many advanced memory management facilities such as compacting and generational garbage collection. These techniques can produce dramatic improvements in collection pause times, allocation performance, and memory usage. SpiderMonkey would really like to be able to make use of these techniques. Unfortunately, after years of working with a conservative collector, we have accumulated a large body of code both inside SpiderMonkey and in the Gecko embedding that assumes a conservative scanner: pointers to GC things are littered all over the stack, tucked away in foreign data structures (i.e., data structures not managed by the GC), used as keys in hashtables, tagged with metadata in their lower bits, etc.

Handle API for Exact Rooting

Over a year ago, the SpiderMonkey team began an effort to claw our way back to an exact rooting scheme. The basic approach is to add a layer of indirection to all GC thing pointer uses: rather than passing around direct pointers to movable GC things, we pass around pointers to GC thing pointers (“double pointers”, as in JSObject**). These Handles, implemented with a C++ Handle<T> template type, introduce a small cost to accesses since we now have to dereference twice to get to the actual data rather than once. But it also means that we can update the GC thing pointers at will, and all subsequent accesses will go to the right place automatically.

In addition, we added a “Rooted<T>” template that uses C++ RAII to automatically register GC thing pointers on the stack with the garbage collector upon creation^n. By depending on LIFO (stack-like) ordering, we can implement this with only a few store instructions per local variable definition. A Rooted pointer is really just a regular pointer sitting on the stack, except it will be registered with the garbage collector when its scope is entered and unregistered when its scope terminates. Using Rooted, the equivalent of the code at the top would look like:

  Rooted<JSObject*> obj1(cx, JS_NewObject(cx));
  Rooted<JSObject*> obj2(cx, JS_NewObject(cx));
  JS_DefineProperty(obj2, "myprop", obj1);

Is it as clean as the original? No. But that’s the cost of doing exact rooting in a language like C++. And it really isn’t bad, at least most of the time. To complete the example, note that a Rooted<T> can be automatically converted to a Handle<T>. So now let’s consider

  bool somefunc(JSContext *cx, JSObject *obj) {
    JSObject *obj2 = JS_NewObject(cx);
    return JS_GetFlavor(cx, obj) == JS_GetFlavor(cx, obj2);
  }

(The JS_GetFlavor function is fictional.) This function is completely unsafe with a moving GC and would need to be changed to

  bool somefunc(JSContext *cx, Handle<JSObject*> obj) {
    Rooted<JSObject*> obj2(cx, JS_NewObject(cx));
    return JS_GetFlavor(cx, obj) == JS_GetFlavor(cx, obj2);
  }

Now ‘obj’ here is a double pointer, pointing to some Rooted<JSObject*> value. If JS_NewObject happens to GC and change the address of *obj, then the final line will still work fine because JS_GetFlavor takes the Handle<JSObject*> and passes it through, and within JS_GetFlavor it will do a double-dereference to retrieve the object’s “flavor” (whatever that might mean) from its new location.

One added wrinkle to keep in mind with moving GC is that you must register every GC thing pointer with the garbage collector subsystem. With a non-moving collector, as long as you have at least one pointer to every live object, you’re good — the garbage collector won’t treat the object as garbage, so all of those pointers will remain valid. But with a moving collector, that’s not enough: if you have two pointers to a GC thing and only register one with the GC, then the GC will only update one of those pointers for you. The other pointer will continue to point to the old location, and Bad Things will happen.

For details of the stack rooting API, see js/public/RootingAPI.h. Also note that the JIT needs to handle moving GC pointers as well, and obviously cannot depend on the static type system. It manually keeps track of movable, collectible pointers and has a mechanism for either updating or recompiling code with “burned in” pointers.

Analyses and Progress

Static types

We initially started by setting up a C++ type hierarchy for GC pointers, so that any failure to root would be caught by the compiler. For example, changing functions to take Handle<JSObject*> will cause compilation to fail if any caller tries to pass in a raw (unrooted) JSObject*. Sadly, the type system is simply not expressive enough for this to be a complete solution, so we require additional tools.

Dynamic stack rooting analysis

One such tool is a dynamic analysis: at any point that might possibly GC, we can use the conservative stack scanning machinery to walk up the stack, find all pointers into the JS heap, and check whether each such pointer is properly rooted. If it is not, the conservative scanner mangles the pointer so that it points to an invalid memory location. It can’t just report a failure, because many stack locations contain stale data that is already dead at the time the GC is called (or was never live in the first place, perhaps because it was padding or only used in a different branch). If anything attempts to use the poisoned pointer, it will most likely crash.

The dynamic analysis has false positives — for example, when you store an integer on the stack that, when interpreted as a pointer, just happens to point into the JS heap — and false negatives, where incorrect code is never executed during our test suite so the analysis never finds it. It also isn’t very good for measuring progress towards the full exact rooting goal: each test crashes or doesn’t, and a crash could be from any number of flaws. It’s also a
slow cycle for going through hazards one by one.

Static stack rooting analysis

For these reasons, we also have a static analysis2 to report all occurrences of unrooted pointers across function calls that could trigger a collection. These can be counted, grouped by file or type, and graphed over time. The static analysis still finds some false positives, e.g. when a function pointer is called (the analysis assumes that any such call may GC unless told otherwise.) It can also miss some hazards, resulting in false negatives, for example when a pointer to a GC pointer is passed around and accessed after a GC-ing function call. For that specific class of errors, the static analysis produces a secondary report of code where the address of an unrooted GC pointer flows into something that could GC. This analysis is more conservative than the other (i.e., it has more false positives; cases where it reports a problem that would not affect anything in practice) because it is easily possible for the pointed-to pointer to not really be live across a GC. For example, a simple GC pointer outparam where the initial value is never used could fit in this category:

  Value v;
  JS_GetSomething(cx, &v);
  if (...some use of v...) { ... }

The address of an unrooted GC thing v is being taken, and if JS_GetSomething triggers a GC, it appears that it could be modified and used after the JS_GetSomething call returns. Except that on entry to JS_GetSomething, v is uninitialized, so we’re probably safe. But not necessarily — if JS_GetSomething invokes GC twice, once after setting v through its pointer, then this really is a hazard. The poor static analysis, which takes into account very limited data flow, cannot know.

The static analysis gathers a variety of information that is independently useful to implementers, which we have exposed both as static files and through an IRC bot3. The bot watches for changes in the number of hazards to detect regressions, and also so we can cheer on improvements. You can ask it whether a given function might trigger a garbage collection, and if so, it will respond with a potential call chain from that function to GC. The bot also gives links to the detailed list of rooting hazards and descriptions of each.

Currently, only a small handful of reported hazards remain that are not known to be false positives. In fact, as of June 25, 2013 an exact-rooted build of the full desktop browser (with the conservative scanner disabled) passes all tests!

It is very rare for a language implementation to return to exact rooting after enjoying the convenience of a conservative garbage collector. It’s a lot of work, a lot of tricky code, and many infuriatingly difficult bugs to track down. (GC bugs are inordinately sensitive to their environment, timing, and how long it has been since you’ve washed your socks. They also manifest themselves as crashes far removed from the actual bug.)

Generational Garbage Collection

In parallel with the exact rooting effort, we4 began implementing a generational garbage collector (“GGC”) to take advantage of our new ability to move GC things around in memory. (GGC depends on exact rooting, but the work can proceed independently.) At a basic level, GGC divides the JS heap into separate regions. Most new objects are allocated into the nursery, and the majority of these objects will be garbage by the time the garbage collector is invoked5. Nursery objects that survive long enough are transferred into the tenured storage area. Garbage collections are categorized as “minor GCs”, where garbage is only swept out of the nursery, and “major GCs”, where you take a longer pause to scan for garbage throughout the heap. Most of the time, it is expected that a minor GC will free up enough memory for the mutator to continue on doing its work. The result is faster allocation, since most allocations just append to the nursery; less fragmentation, because most fragmentation is due to short-lived objects forming gaps between their longer-lived brethren; and reduced pause times and frequency, since the minor GCs are quicker and the major GCs are less common.

Current Status

GGC is currently implemented and capable of running the JS shell. Although we have just begun tuning it, it is visible in our collection of benchmarks on the GGC line at www.arewefastyet.com. At the present time, GGC gives a nice speedup on some individual benchmarks, and a substantial slowdown on others.

Write Barriers

The whole generational collection scheme depends on minor GCs being fast, which is accomplished by keeping track of all external pointers into the nursery. A minor GC only needs to scan through those pointers plus the pointers within the nursery itself in order to figure out what to keep, but in order to accomplish this, the external pointer set must be accurately maintained at all time.

The mutator maintains the set of external pointers by calling write barriers on any modification of a GC thing pointer in the heap. If there is an object o somewhere in the heap and the mutator sets a property on o to point to another GC thing, then the write barrier will check if that new pointer is a pointer into the nursery. If so, it records it in a store buffer. A minor GC scans through the store buffer to update its collection of pointers from outside the nursery to within it.

Write barriers are an additional implementation task required for GGC. We again use the C++ type system to enforce the barriers in most cases — see HeapPtr<T> for inside SpiderMonkey, Heap<T> for outside. Any writes to a Heap<T> will invoke the appropriate write barrier code. Unsurprisingly, many other cases are not so simply solved.

Barrier Verifier

We have a separate dynamic analysis to support the write barriers. It empties out the nursery with a minor GC to provide a clean slate, then runs the mutator for a while to populate the store buffers. Finally, it scans the entire tenured heap to find all pointers into the nursery, verifying that all such pointers are captured in the store buffer.

Remaining Tasks

While GGC already works in the shell, work remains before it can be used in the full browser. There are many places where a post write barrier is not straightforward, and we are manually fixing those. Fuzz tests are still finding bugs, so those need to be tracked down. Finally, we won’t turn this stuff on until it’s a net performance win, and we have just started to work through the various performance faults. The early results look promising.

Credits

Much of the foundational work was done by Brian Hackett, with Bill McCloskey helping with the integration with the existing GC code. The heavy lifting for the exact stack rooting was done by Terrence Cole and Jon Coppeard, assisted by Steve Fink and Nicholas Nethercote and a large group of JS and Gecko developers. Boris Zbarsky and David Zbarsky in particular did the bulk of the Gecko rooting work, with Tom Schuster and man of mystery Ms2ger pitching in for the SpiderMonkey and XPConnect rooting. Terrence did the core work on the generational collector, with Jon implementing much of the Gecko write barriers. Brian implemented the static rooting analysis, with Steve automating it and exposing its results. A special thanks to the official project masseuse, who… wait a minute. We don’t have a project masseuse! We’ve been cheated!

Footnotes

  1. From the standpoint of the garbage collector, the only purpose of the main program (you know, the one that does all the work) is to ask for new stuff to be allocated in the heap and to modify the pointers between those heap objects. As a result, it is referred to as the “mutator” in GC literature. (That said, the goal of a garbage collector is to pause the mutator as briefly and for as little time as possible.)
  2. Brian Hackett implemented the static analysis based on his sixgill framework. It operates as a GCC plugin that monitors all compilation and sends off the control flow graph to a server that records everything in a set of databases, from which a series of Javascript programs pull out the data and analyze it for rooting hazards.
  3. The bot is called “mrgiggles”, for no good reason, and currently only hangs out in #jsapi on irc.mozilla.org. /msg mrgiggles help for usage instructions.
  4. “We” in this case mostly means Terrence Cole, with guidance from Bill McCloskey.
  5. Referred to in the literature by the grim phrase “high infant mortality.” The idea that the bulk of objects in most common workloads die quickly is called the “generational hypothesis”.

The Baseline Compiler Has Landed

This wednesday we landed the baseline compiler on Firefox nightly. After six months of work from start to finish, we are finally able to merge the fruits of our toils into the main release stream.

What Is The Baseline Compiler?

Baseline (no, there is no *Monkey codename for this one) is IonMonkey’s new warm-up compiler. It brings performance improvements in the short term, and opportunities for new performance improvements in the long term. It opens the door for discarding JaegerMonkey, which will enable us to make other changes that greatly reduce the memory usage of SpiderMonkey. It makes it easier and faster to implement first-tier optimizations for new language features, and to more easily enhance those into higher-tier optimizations in IonMonkey.

Our scores on the Kraken, Sunspider, and Octane benchmarks have improved by 5-10% on landing, and will continue to improve as we continue to leverage Baseline to make SpiderMonkey better. See the AreWeFastYet website. You can select regions on the graph (by clicking and dragging) to zoom in on them.

Another JIT? Why Another JIT?

Until now, Firefox has used two JITs: JaegerMonkey and IonMonkey. Jaeger is a general purpose JIT that is “pretty fast”, and Ion is a powerful optimizing JIT that’s “really fast”. Initially, hot code gets compiled with Jaeger, and then if it gets really hot, recompiled with Ion. This strategy lets us gradually optimize code, so that the really heavyweight compilation is used for the really hot code. However, the success of this strategy depends on striking a good balance between the time-spent-compiling at different tiers of compilation, and the the actual performance improvements delivered at each tier.

To make a long story short, we’re currently using JaegerMonkey as a stopgap baseline compiler for IonMonkey, and it was not designed for that job. Ion needs a baseline compiler designed with Ion in mind, and that’s what Baseline is.

The fuller explanation, as always, is more nuanced. I’ll go over that in three sections: the way it works in the current release, why that’s a problem, and how Baseline helps fix it.

The Current Reality

In a nutshell, here’s how current release Firefox approaches JIT compilation:

  1. All JavaScript functions start out executing in the interpreter. The interpreter is really slow, but it collects type information for use by the JITs.
  2. When a function gets somewhat hot, it gets compiled with JaegerMonkey. Jaeger uses the collected type information to optimize the generated jitcode.
  3. The function executes using the Jaeger jitcode. When it gets really hot, it is re-compiled with IonMonkey. IonMonkey’s compiler spends a lot more time than JaegerMonkey, generating really optimized jitcode.
  4. If type information for a function changes, then any existing JITcode (both Jaeger’s and Ion’s) is thrown away, the function returns to being interpreted, and we go through the whole JIT lifecycle again.

There are good reasons why SpiderMonkey’s JIT compilation strategy is structured this way.

You see, Ion takes a really long time to compile, because to generate extremely optimized jitcode, it applied lots of heavyweight optimization techniques. This meant that if we Ion-compiled functions too early, type information was more likely to change after compilation, and Ion code would get invalidated a lot. This would cause the engine to waste a whole lot of time on compiles that would be discarded. However, if waited too long to compile, then we would spend way too much time interpreting a function before compiling it.

JaegerMonkey’s JIT compiler is not nearly as time consuming as IonMonkey’s JIT compiler. Jaeger uses collected type information to optimize codegeneration, but it doesn’t spend nearly as much time as Ion in optimizing its generated code. It generates “pretty good” jitcode, but does it way faster than Ion.

So Jaeger was stuck in between the interpreter and Ion, and performance improved because the really hot code would still get Ion-compiled and be really fast, and the somewhat-hot code would get compiled with Jaeger (and recompiled often as type-info changed, but that was OK because Jaeger was faster at compiling).

This approach ensured that SpiderMonkey spent as little time as possible in the interpreter, where performance goes to die, while still gaining the benefits of Ion’s codegeneration for really hot JavaScript code. So all is well, right?

No. No it is not.

The Problems

The above approach, while a great initial compromise, still posed several significant issues:

  1. Neither JaegerMonkey nor IonMonkey could collect type information, and they generated jitcode that relied on type information. They would run for as long as the type information associated with the jitcode was stable. If that changed, the jitcode would be invalidated, and execution would go back to the interpreter to collect more type information.
  2. Jaeger and Ion’s calling conventions were different. Jaeger used the heap-allocated interpreter stack directly, whereas Ion used the (much faster) native C stack. This made calls between Jaeger and Ion code very expensive.
  3. The type information collected by the interpreter was limited in certain ways. The existing Type-Inference (TI) system captured some kinds of type information very well (e.g. the types of values you could expect to see from a property read at a given location in the code), but other kinds of information very poorly (e.g. the shapes of the objects that that the property was being retreived from). This limited the kinds of optimizations Ion could do.
  4. The TI infrastructure required (and still requires) a lot of extra memory to persistently track type analysis information. Brian Hackett, who originally designed and implemented TI, figured he could greatly reduce that memory overhead for Ion, but it would be much more time consuming to do for Jaeger.
  5. A lot of web-code doesn’t run hot enough for even the Jaeger compilation phase to kick in. Jaeger took less time than Ion to compile, but it was still expensive, and the resulting code could always be invalidated by type information changes. Because of this, the threshold for Jaeger compilation was still set pretty high, and a lot of non-hot code still ran in the interpreter. For example, SpiderMonkey lagged on the SunSpider benchmark largely because of this issue.
  6. Jaeger is just really complex and hard to work with.

The Solution

The Baseline compiler was designed to address these shortcomings. Like the interpreter, Baseline jitcode feeds information to the existing TI engine, while additionally collecting even more information by using inline cache (IC) chains. The IC chains that Baseline jitcode creates as it runs can be inspected by Ion and used to better optimize Ion jitcode. Baseline jitcode never becomes invalid, and never requires recompilation. It tracks and reacts to dynamic changes, adding new stubs to its IC chains as necessary. Baseline’s native compilation and optimized IC stubs also allows it to run 10x-100x faster than the interpreter. Baseline also follows Ion’s calling conventions, and uses the C stack instead of the interpreter stack. Finally, the design of the baseline compiler is much simpler than either JaegerMonkey or IonMonkey, and it shares a lot of common code with IonMonkey (e.g. the assembler, jitcode containers, linkers, trampolines, etc.). It’s also really easy to extend Baseline to collect new type information, or to optimize for new cases.

In effect, Baseline offers a better compromise between the interpreter and a JIT. Like the interpreter, it’s stable and resilient in the face of dynamic code, collects type information to feed to higher-tier JITs, and is easy to update to handle new features. But as a JIT, it optimizes for common cases, offering an order of magnitude speed up over the interpreter.

Where Do We Go From Here?

There are a handful of significant, major changes that Baseline will enable, and are things to watch for in the upcoming year:

  • Significant memory savings by reducing type-inference memory.
  • Performance improvements due to changes in type-inference enabling better optimization of inlined functions.
  • Further integration of IonMonkey and Baseline, leading to better performance for highly polymorphic object-manipulating code.
  • Better optimization of high-level features like getters/setters, proxies, and generators

Also, to remark on recent happenings… given the recent flurry of news surrounding asm.js and OdinMonkey, there have been concerns raised (by important voices) about high-level JavaScript becoming a lesser citizen of the optimization landscape. I hope that in some small way, this landing and ongoing work will serve as a convincing reminder that the JS team cares and will continue to care about making high-level, highly-dynamic JavaScript as fast as we can.

Acknowledgements

Baseline was developed by Jan De Mooij and myself, with significant contributions by Tom Schuster and Brian Hackett. Development was greatly helped by our awesome fuzz testers Christian Holler and Gary Kwong.

And of course it must be noted Baseline by itself would not serve a purpose. The fantastic work done by the IonMonkey team, and the rest of the JS team provides a reason for Baseline’s existence.

Support for debugging SpiderMonkey with GDB now landed

The main source tree for Firefox, Mozilla Central, now includes some code that should make debugging SpiderMonkey with GDB on Linux much more pleasant and productive.

GDB understands C++ types and values, but naturally it has no idea what the debuggee intends them to represent. As a result, GDB’s attempts to display those values can sometimes be worse than printing nothing at all. For example, here’s how a stock GDB displays a stack frame for a call to js::baseops::SetPropertyHelper:

(gdb) frame
#0 js::baseops::SetPropertyHelper (cx=0xc648b0, obj={<js::HandleBase> = {}, ptr = 0x7fffffffc960}, receiver={<js::HandleBase> = {}, ptr = 0x7fffffffc960}, id={<js::HandleBase> = {}, ptr = 0x7fffffffc1e0}, defineHow=4, vp={<js::MutableHandleBase> = {<js::MutableValueOperations<JS::MutableHandle >> = {<js::ValueOperations<JS::MutableHandle >> = {}, }, }, ptr = 0x7fffffffc1f0}, strict=0) at /home/jimb/moz/dbg/js/src/jsobj.cpp:3593

There exist people who can pick through that, but for me it’s just a pile of hexadecimal noise. And yet, if you persevere, what those arguments represent is quite simple: in this case, obj and receiver are both the JavaScript global object; id is the identifier "x"; and vp refers to the JavaScript string value "foo". This SetPropertyHelper call is simply storing "foo" as the value of the global variable x. But it sure is hard to tell—and that’s an annoyance for SpiderMonkey developers.

As of early December, Mozilla Central includes Python scripts for GDB that define custom printers for SpiderMonkey types, so that when GDB comes across a SpiderMonkey type like MutableValueHandle, it can print it in a meaningful way. With these changes, GDB displays the stack frame shown above like this:

(gdb) frame
#0 js::baseops::SetPropertyHelper (cx=0xc648b0, obj=(JSObject * const) 0x7ffff151f060 [object global] delegate, receiver=(JSObject * const) 0x7ffff151f060 [object global] delegate, id=$jsid("x"), defineHow=4, vp=$jsval("foo"), strict=0) at /home/jimb/moz/dbg/js/src/jsobj.cpp:3593

Here it’s much easier to see what’s going on. Objects print with their class, like “global” or “Object”; strings print as strings; jsval values print as appropriate for their tags; and so on. (The line breaks could still be improved, but that’s GDB for you.)

Naturally, the pretty-printers work with any command in GDB that displays values: print, backtrace, display, and so on. Each type requires custom Python code to decode it; at present we have pretty-printers for JSObject, JSString, jsval, the various Rooted and Handle types, and things derived from those. The list will grow.

GDB picks up the SpiderMonkey support scripts automatically when you’re debugging the JavaScript shell, as directed by the js-gdb.py file that the build system places in the same directory as the js executable. We haven’t yet made the support scripts load automatically when debugging Firefox, as that’s a much larger audience of developers, and we’d like a chance to shake out bugs before foisting it on everyone.

Some versions of GDB are patched to trust only auto-load files found in directories you’ve whitelisted; if this is the case for you, GDB will complain, and you’ll need to add a command like the following to your ~/.gdbinit file:

# Tell GDB to trust auto-load files found under ~/moz.
add-auto-load-safe-path ~/moz

If you need to see a value in its plain C++ form, with no pretty-printing applied, you can add the /r format modifier to the print command:

(gdb) print vp
$1 = $jsval("foo")
(gdb) print/r vp
$2 = {
  <js::MutableHandleBase> = {
    <js::MutableValueOperations<JS::MutableHandle >> = {
      <js::ValueOperations<JS::MutableHandle >> = {}, }, },
  members of JS::MutableHandle:
  ptr = 0x7fffffffc1f0
}

If you run into troubles with a pretty-printer, please file a bug in Bugzilla, under the “Core” product, for the “JavaScript Engine” component. (The pretty-printers have their own unit and regression tests; we do want them to be reliable.) In the mean time, you can disable the pretty-printers with the disable pretty-printer command:

(gdb) disable pretty-printer .* SpiderMonkey
12 printers disabled
128 of 140 printers enabled

For more details, see the GDB support directory’s README file.

AreWeFastYet Improvements

I’m pleased to announce that we have rebooted AreWeFastYet with a whole
new set of features! The big ones:

  • The graphs now display a hybrid view that contains full history, as well as recent checkins.
  • You can select areas of the graph to zoom in and get a detailed view.
  • Tooltips can be pinned and moved around to make comparing easier.
  • Tooltips now have more information, like revision ranges and changelogs.
  • The site is now much faster as it is almost entirely client-side.

You can check it out at http://www.arewefastyet.com/

About AreWeFastYet

AreWeFastYet is the JavaScript Team’s tool for automatically monitoring
JavaScript performance. It helps us spot regressions, and it provides a
clear view of where to drive benchmark performance work.

It began as a demotivational joke during Firefox 4 development. It
originally just said “No”. Once it got graphs, though, it became a
strong motivator. The goal was very clear: we had to make the lines
cross, and with each performance checkin we could see ourselves edge closer.

After the Firefox 4 release AWFY took on an additional role. Since it
ran every 30 minutes, we could easily spot performance regressions.
However this had the unexpected and unfortunate side effect of taking
away the long-term view of JavaScript performance.

The new version of AWFY is designed to address that problem, as well as
fix numerous usability issues.

Technology

Previously AWFY was written in PHP and used expensive server-side
database queries. Now the website is entirely client-side,
self-contained in static HTML, JavaScript, and JSON. Since there is a
large amount of data, the JSON is divided into small files based on the
granularity of information needed. As you zoom in, new data sets at the
required detail are fetched asynchronously.

The JSON is updated every 15 minutes, since it takes about that long to
re-process all the old data.

The new source code is all available on GitHub:
https://github.com/dvander/arewefastyet

I would like to give a HUGE thank you to John Schoenick, who made
AreWeSlimYet.com. Many of AWFY’s problems had been solved and
implemented in AWSY, and John was extremely helpful in explaining them
as well as helping with the actual HTML and CSS.

The Ins and Outs of Invalidation

One of the primary goals of JIT engines for dynamic languages is to make high-level code run fast by compiling it into efficient machine code.  A key property of this, however, is that the compiled code for any piece of JavaScript must behave exactly the same at runtime as the interpreted code for that JavaScript would have behaved.  In a nutshell, providing efficiency while maintaining correctness is the fundamental problem faced by JIT compilers.

This efficiency is tricky to achieve because dynamic languages like JavaScript are highly polymorphic: any variable can hold values of any type, and in the general case, the runtime cannot know ahead of time what type a particular value will have. For example, even if the program will always add two integers together at a particular place in the code, the engine has to allow for the possibility that a non-integer value might unexpectedly show up.

There are two broad techniques which can be used to deal with this challenge.  The first is guarding, where the engine generates machine code that checks its assumptions before executing the code that relies on those assumptions.  For the adding example above, the engine will generate machine code to do integer addition, but it will make sure to prefix that code with checks which ensure that the two values being added are actually integers.  If the checks fail, the machine code jumps to a slowpath that handles the uncommon case in a general way.  If the check succeeds, the fastpath (or optimized) machine code is executed.  The expectation is that the checks will succeed most of the time, and so the fastpath will be executed most of the time.

While guarding is a useful technique, it imposes a performance penalty.  Checking assumptions takes time, and having those checks in hot code can be a significant performance drain.  The second technique for emitting efficient code while retaining correctness is invalidation.  That’s what I’m going to talk about in this post.  I’m going to use SpiderMonkey’s newly added JIT engine, IonMonkey, to illustrate my examples, but aside from the details the overall strategy will apply to most JIT engines.

Invalidation at 10,000 Feet

The key idea behind invalidation is this: instead of making our jitcode check an assumption every time we are about to do something that relies on that assumption, we ask the engine to mark the jitcode as invalid when the assumption becomes false.  As long as we take care never to run jitcode that’s been marked invalid, then we can go ahead and leave out the guards we would have otherwise added.

Let’s take a look at a simple example to get started.  Here’s a small JavaScript program that computes the sum of some point distances:

function Point(x, y) {
    this.x = x;
    this.y = y;
}
 
function dist(pt1, pt2) {
    var xd = pt1.x - pt2.x,
        yd = pt1.y - pt2.y;
    return Math.sqrt(xd*xd + yd*yd);
}
 
function main() {
    var totalDist = 0;
    var origin = new Point(0, 0); 
    for (var i = 0; i < 20000; i++) {
        totalDist += dist(new Point(i, i), origin);
    }
    // The following "eval" is just there to prevent IonMonkey from
    // compiling main().  Functions containing calls to eval don't
    // currently get compiled by Ion.
    eval("");
    return totalDist;
}
 
main();

When this script is run, the dist function is compiled by IonMonkey after roughly 10,000 iterations, generating the following intermediate representation (IR) code:

[1]   Parameter 0          => Value     // (pt1 value)
[2]   Parameter 1          => Value     // (pt2 value)
[3]   Unbox [1]            => Object    // (unbox pt1 to object) 
[4]   Unbox [2]            => Object    // (unbox pt2 to object)
[5]   LoadFixedSlot(x) [3] => Int32     // (read pt1.x, unbox to Int32)
[6]   LoadFixedSlot(x) [4] => Int32     // (read pt2.x, unbox to Int32)
[7]   Sub [5] [6]          => Int32     // xd = (pt1.x - pt2.x)
[8]   LoadFixedSlot(y) [3] => Int32     // (read pt1.y, unbox to Int32)
[9]   LoadFixedSlot(y) [4] => Int32     // (read pt2.y, unbox to Int32)
[10]  Sub [8] [9]          => Int32     // yd = (pt1.y - pt2.y)
[11]  Mul [7] [7]          => Int32     // (xd*xd)
[12]  Mul [10] [10]        => Int32     // (yd*yd)
[13]  Add [11] [12]        => Int32     // ((xd*xd) + (yd*yd))
[14]  Sqrt [13]            => Double    // Math.sqrt(...)
[15]  Return [14]

The above is a cleaned-up version of the actual IR for illustration. For the actual nitty-gritty low-level IR, Click Here.

In instructions [3] and [4], Ion blindly unboxes the argument values into Object pointers without checking to see if they are actually object pointers and not primitives. In instructions [5], [6], [8], and [9], Ion blindly converts the x and y values loaded from the objects to Int32s.

(Note: Unboxing in this case refers to decoding a generic JavaScript value into a raw value of a specific type such as Int32, Double, Object pointer, or Boolean).

If we were only using guards to check our assumptions, the following extra checks would have gone into this code:

  1. Two type checks: An extra check before each of [3] and [4] to check that the input argument was actually an object pointer before unboxing it.
  2. Four type checks: Ensuring that pt1.x, pt2.x, pt1.y, and pt2.y were all Int32 values before unboxing them.

Instead, the IR code skips these six extra checks, generating extremely tight code. Normally, we wouldn’t be able to do this because the jitcode would simply be wrong if any of these assumptions were not held. If the function dist is ever called with non-object arguments, the jitcode would crash. If dist was ever called with instances of Point with x and y values that were not Int32s, the jitcode would crash.

To get away with generating this efficient code while maintaining correctness, we must make sure that we never run it after its assumptions become invalid. Accomplishing that requires leveraging SpiderMonkey’s type inference system.

Type Inference

SpiderMonkey’s type inference (TI) dynamically tracks known type information for JavaScript objects and scripts, and how those types flow through different parts of the code. The data structures maintained and updated by TI represent the current type knowledge about the program. By tracking when these structures change, the engine can trigger events whenever particular type assumptions are broken.

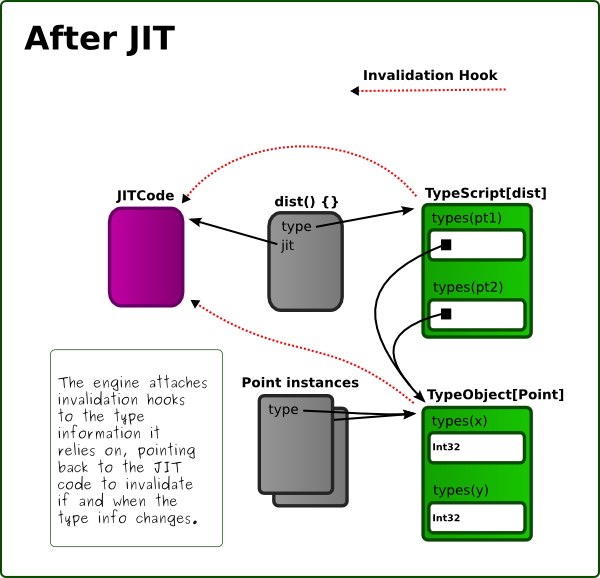
The following is a very simplified diagram of the type model generated for our program as it runs.

The TypeScript at the top keeps track of the type information for the function dist – such as the type sets associated with the first and second arguments (‘pt1’ and ‘pt2’).

The TypeObject diagrammed below keeps track of the type information associated with instances of Point – such as the type sets associated with the fields ‘x’ and ‘y’.

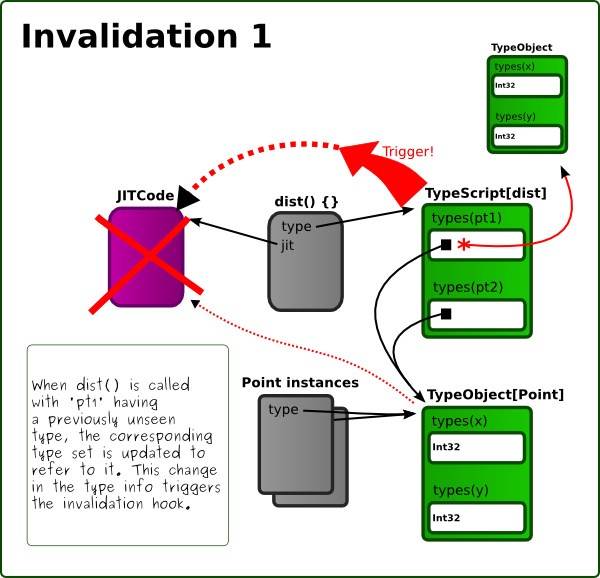
These structures will be updated by TI as needed. For example, if dist is ever called with an object that is not an instance of Point, TI will update the appropriate argument typeset on the TypeScript. Likewise, if Point is ever instantiated with values for ‘x’ or ‘y’ that are not integers, the parameter type sets on the TypeObject will be updated.

When Ion JIT-compiles a function and makes implicit assumptions about types, it adds invalidation hooks to the appropriate type sets, like so:

Whenever new types are added to type sets, the relevant invalidation hook will be triggered, which will cause the jitcode to be marked invalid.

Experiments With Ion

Let’s see if we can experimentally trigger these kinds of invalidations by changing the code above. I’ll be using the standalone JavaScript shell built from the Mozilla sources to run these examples. You can verify these tests yourself by building a debug version of the JS shell. (See the SpiderMonkey build documentation for more information).

First, let’s start easy – and verify that no invalidations occur with the script above:

$ IONFLAGS=osi js-debug points.js
[Invalidate] Start invalidation.
[Invalidate]  No IonScript invalidation.

(ignore the spurious, extra “Start invalidation” in this and subsequent outputs – it’s due to garbage-collection starting, which makes the engine check for potential invalidations caused by the GC. It’s not relevant to this post)

Passing the environment variable IONFLAGS=osi just asks Ion to dump all invalidation related events to its output as it runs. As the output notes, this program causes no invalidations – since no type assumptions are broken after compilation.

Stab 2

For our second try, let’s break the assumption that all arguments to dist are instances of Point, and see what happens. Here is the modified main() function:

...
function main() {
    var totalDist = 0;
    var origin = new Point(0, 0); 
    for (var i = 0; i < 20000; i++) {
        totalDist += dist(new Point(i, i), origin);
    }
    dist({x:3,y:9}, origin); /** NEW! **/
 
    // The following "eval" is just there to prevent IonMonkey from
    // compiling main().  Functions containing calls to eval don't
    // currently get compiled by Ion.
    eval("");
    return totalDist;
}
...

In this program, the loop is going to run and make dist hot enough that it gets compiled with the assumption that its arguments are always going to be instances of Point. Once the loop is completed, we call dist again, but with its first argument being an object which is not an instance of Point, which breaks the assumption made by the jitcode.

$ IONFLAGS=osi js-debug points.js
[Invalidate] Start invalidation.
[Invalidate]  No IonScript invalidation.
[Invalidate] Start invalidation.
[Invalidate]  Invalidate points.js:6, IonScript 0x1f7e430

(once again, the first “Start invalidation” is just caused by GC kicking in, and it’s not relevant to this post.)

Aha! We’ve managed to trigger invalidation of dist (points.js, line 6). Life is good.
The diagram below shows what’s happening. The dist TypeScript’s first-argument-typeset changes, adding a reference to a new TypeObject. This triggers its invalidation hook, and marks the IonScript invalid:

Stab 3

For our third stab, we break the assumption that fields of Point instances always contain Int32 values. Here is the modified main() function:

...
function main() {
    var totalDist = 0;
    var origin = new Point(0, 0); 
    for (var i = 0; i < 20000; i++) {
        totalDist += dist(new Point(i, i), origin);
    }
    dist(new Point(1.1, 5), origin); /** NEW! **/
 
    // The following "eval" is just there to prevent IonMonkey from
    // compiling main().  Functions containing calls to eval don't
    // currently get compiled by Ion.
    eval("");
    return totalDist;
}
...

And the associated output:

$ IONFLAGS=osi js-debug points.js
[Invalidate] Start invalidation.
[Invalidate]  No IonScript invalidation.
[Invalidate] Start invalidation.
[Invalidate]  Invalidate points.js:6, IonScript 0x1f7e430

And the diagram showing how the script is invalidated:

Invalidation vs. Guarding

Invalidation and guarding are two distinct approaches to generating jitcode for any given operation. Within the jitcode for any given function, both techniques may be used, and neither one is strictly better than the other in all cases.

The advantage of invalidation-based optimization is that guards can be omitted, allowing very hot code to execute extremely quickly. However, there are also downsides. When an assumption fails, every piece of jitcode that relies on that assumption must be marked invalid, and prevented from being executed. This means that the function returns to running via the interpreter, until such a time as we compile it again with a new set of assumptions. If we have the bad luck of choosing invalidation-based optimization on an assumption that happens to break, then we’re suddenly stuck with a very high cost.

With guard-based optimization, we sacrifice the speed of the optimize code, but the resulting code is more resilient to changes in assumptions – we don’t have to throw away jitcode when assumptions break. In those cases, the code will just execute a slowpath. If the number of times a function is called with invalid assumptions is small (but greater than zero), then guard-based optimization might be a better choice than invalidation-based optimization.

The question of which optimization strategy to pick when is not always easily answered. Even if an assumption is invalidated occasionally, the jitcode which assumes it may be hot enough to make it worthwhile to use invalidation-based optimization, and just pay the cost of the occasional recompile – the time saved in between will be worth the recompile cost. Alternatively, it may not be worth the cost. Beyond a certain point, deciding between the two approaches becomes a matter of heuristics and tuning.

On-Stack Invalidation

The post so far gives a general idea of the main principles behind invalidations. That said, there is a very important corner case with invalidation that all JIT engines need to take care of.

The corner case is called on-stack invalidation, and it arises because sometimes, the jitcode that becomes invalid is code that’s on the call stack (i.e. it’s one of the callers of the code that’s currently executing). This means that once the current code finishes running, it’s going to execute a machine-level return to jitcode that we can no longer safely execute.

Handling this case requires a bit of juggling, and consideration for a number of subtle errors that may arise. I’ll cover more on that in a follow-up post.

IonMonkey in Firefox 18

Today we enabled IonMonkey, our newest JavaScript JIT, in Firefox 18. IonMonkey is a huge step forward for our JavaScript performance and our compiler architecture. But also, it’s been a highly focused, year-long project on behalf of the IonMonkey team, and we’re super excited to see it land.

SpiderMonkey has a storied history of just-in-time compilers. Throughout all of them, however, we’ve been missing a key component you’d find in typical production compilers, like for Java or C++. The old TraceMonkey*, and newer JägerMonkey, both had a fairly direct translation from JavaScript to machine code. There was no middle step. There was no way for the compilers to take a step back, look at the translation results, and optimize them further.

IonMonkey provides a brand new architecture that allows us to do just that. It essentially has three steps:

  1. Translate JavaScript to an intermediate representation (IR).
  2. Run various algorithms to optimize the IR.
  3. Translate the final IR to machine code.

We’re excited about this not just for performance and maintainability, but also for making future JavaScript compiler research much easier. It’s now possible to write an optimization algorithm, plug it into the pipeline, and see what it does.

Benchmarks

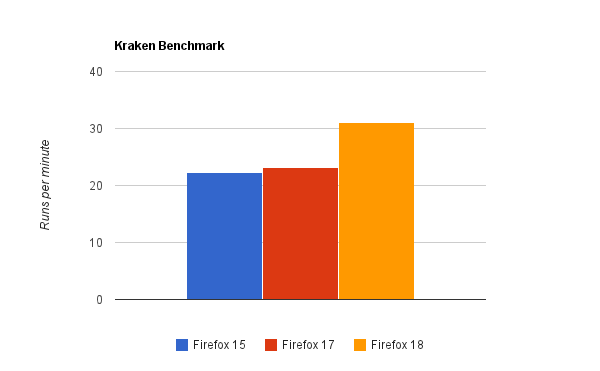
With that said, what exactly does IonMonkey do to our current benchmark scores? IonMonkey is targeted at long-running applications (we fall back to JägerMonkey for very short ones). I ran the Kraken and Google V8 benchmarks on my desktop (a Mac Pro running Windows 7 Professional). On the Kraken benchmark, Firefox 17 runs in 2602ms, whereas Firefox 18 runs in 1921ms, making for roughly a 26% performance improvement. For the graph, I converted these times to runs per minute, so higher is better:

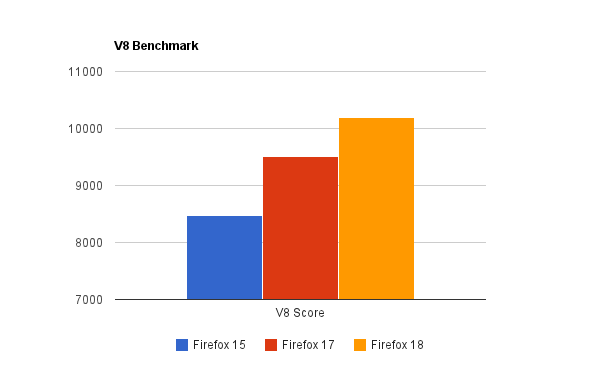
On Google’s V8 benchmark, Firefox 15 gets a score of 8474, and Firefox 17 gets a score of 9511. Firefox 18, however, gets a score of 10188, making it 7% faster than Firefox 17, and 20% faster than Firefox 15.

We still have a long way to go: over the next few months, now with our fancy new architecture in place, we’ll continue to hammer on major benchmarks and real-world applications.

The Team

For us, one of the coolest aspects of IonMonkey is that it was a highly-coordinated team effort. Around June of 2011, we created a somewhat detailed project plan and estimated it would take about a year. We started off with four interns – Andrew Drake, Ryan Pearl, Andy Scheff, and Hannes Verschore – each implementing critical components of the IonMonkey infrastructure, all pieces that still exist in the final codebase.

In late August 2011 we started building out our full-time team, which now includes Jan de Mooij, Nicolas Pierron, Marty Rosenberg, Sean Stangl, Kannan Vijayan, and myself. (I’d also be remiss not mentioning SpiderMonkey alumnus Chris Leary, as well as 2012 summer intern Eric Faust.) For the past year, the team has focused on driving IonMonkey forward, building out the architecture, making sure its design and code quality is the best we can make it, all while improving JavaScript performance.

It’s really rewarding when everyone has the same goals, working together to make the project a success. I’m truly thankful to everyone who has played a part.

Technology

Over the next few weeks, we’ll be blogging about the major IonMonkey components and how they work. In brief, I’d like to highlight the optimization techniques currently present in IonMonkey:

  • Loop-Invariant Code Motion (LICM), or moving instructions outside of loops when possible.
  • Sparse Global Value Numbering (GVN), a powerful form of redundant code elimination.
  • Linear Scan Register Allocation (LSRA), the register allocation scheme used in the HotSpot JVM (and until recently, LLVM).
  • Dead Code Elimination (DCE), removing unused instructions.
  • Range Analysis; eliminating bounds checks (will be enabled after bug 765119)

Of particular note, I’d like to mention that IonMonkey works on all of our Tier-1 platforms right off the bat. The compiler architecture is abstracted to require minimal replication of code generation across different CPUs. That means the vast majority of the compiler is shared between x86, x86-64, and ARM (the CPU used on most phones and tablets). For the most part, only the core assembler interface must be different. Since all CPUs have different instruction sets – ARM being totally different than x86 – we’re particularly proud of this achievement.

Where and When?

IonMonkey is enabled by default for desktop Firefox 18, which is currently Firefox Nightly. It will be enabled soon for mobile Firefox as well. Firefox 18 becomes Aurora on Oct 8th, and Beta on November 20th.

* Note: TraceMonkey did have an intermediate layer. It was unfortunately very limited. Optimizations had to be performed immediately and the data structure couldn’t handle after-the-fact optimizations.

Incremental GC in Firefox 16!

Firefox 16 will be the first version to support incremental garbage collection. This is a major feature, over a year in the making, that makes Firefox smoother and less laggy. With incremental GC, Firefox responds more quickly to mouse clicks and key presses. Animations and games will also draw more smoothly.

The basic purpose of the garbage collector is to collect memory that JavaScript programs are no longer using. The space that is reclaimed can then be reused for new JavaScript objects. Garbage collections usually happen every five seconds or so. Prior to incremental GC landing, Firefox was unable to do anything else during a collection: it couldn’t respond to mouse clicks or draw animations or run JavaScript code. Most collections were quick, but some took hundreds of milliseconds. This downtime can cause a jerky, frustrating user experience. (On Macs, it causes the dreaded spinning beachball.)

Incremental garbage collection fixes the problem by dividing the work of a GC into smaller pieces. Rather than do a 500 millisecond garbage collection, an incremental collector might divide the work into fifty slices, each taking 10ms to complete. In between the slices, Firefox is free to respond to mouse clicks and draw animations.

I’ve created a demo to show the difference made by incremental GC. If you’re running a Firefox 16 beta, you can try it out here. (If you don’t have Firefox 16, the demo will still work, although it won’t perform as well.) The demo shows GC performance as an animated chart. To make clear the difference between incremental and non-incremental GC, I’ll show two screenshots from the demo. The first one was taken with incremental GC disabled. Later I’ll show a chart with incremental collections enabled. Here is the non-incremental chart:

Time is on the horizontal axis; the red dot moves to the right and shows the current time. The vertical axis, drawn with a log scale, shows the time it takes to draw each frame of the demo. This number is the inverse of frame rate. Ideally, we would like to draw the animation at 60 frames per second, so the time between frames should be 1000ms / 60 = 16.667ms. However, if the browser needs to do a garbage collection or some other task, then there will be a longer pause between frames.

The two big bumps in the graph are where non-incremental garbage collections occured. The number in red shows that the time of the worst bump–in this case, 260ms. This means that the browser was frozen for a quarter second, which is very noticeable. (Note: garbage collections often don’t take this long. This demo allocates a lot of memory, which makes collections take longer to demonstrate the benefits of incremental GC.)

To generate the chart above, I disabled incremental GC by visiting about:config in the URL bar and setting the javascript.options.mem.gc_incremental preference to false. (Don’t forget to turn it on again if you try this yourself!) If I enable incremental GC, the chart looks like this:

This chart also shows two collections. However, the longest pause here is only 67ms. This pause is small enought that it is unlikely to be discernible. Notice, though, that the collections here are more spread out. In the top image, the 260ms pause is about 30 pixels wide. In the bottom image, the GCs are about 60 pixels wide. That’s because the incremental collections in the bottom chart are split into slices; in between the slices, Firefox is drawing frames and responding to input. So the total duration of the garbage collection is about twice as long. But it is much less likely that anyone will be affected by these shorter collection pauses.

At this point, we’re still working heavily on incremental collection. There are still some phases of collection that have not been incrementalized. Most of the time, these phases don’t take very long. But users with many tabs open may still see unacceptable pauses. Firefox 17 and 18 will have additional improvements that will decrease pause times even more.

If you want to explore further, you can install MemChaser, an addon for Firefox that shows garbage collection pauses as they happen. For each collection, the worst pause is displayed in the addon bar at the bottom of the window. It’s important to realize that not all pauses in Firefox are caused by garbage collection. You can use MemChaser to correlate the bumps in the chart with garbage collections reported by MemChaser.

If there is a bump when no garbage collection happened, then something else must have caused the pause. The Snappy project is a larger effort aimed at reducing pauses in Firefox. They have developed tools to figure out the sources of pauses (often called “jank”) in the browser. Probably the most important tool is the SPS profiler. If you can reliably reproduce a pause, then you can profile it and figure out what Firefox code was running that made us slow. Then file a bug!