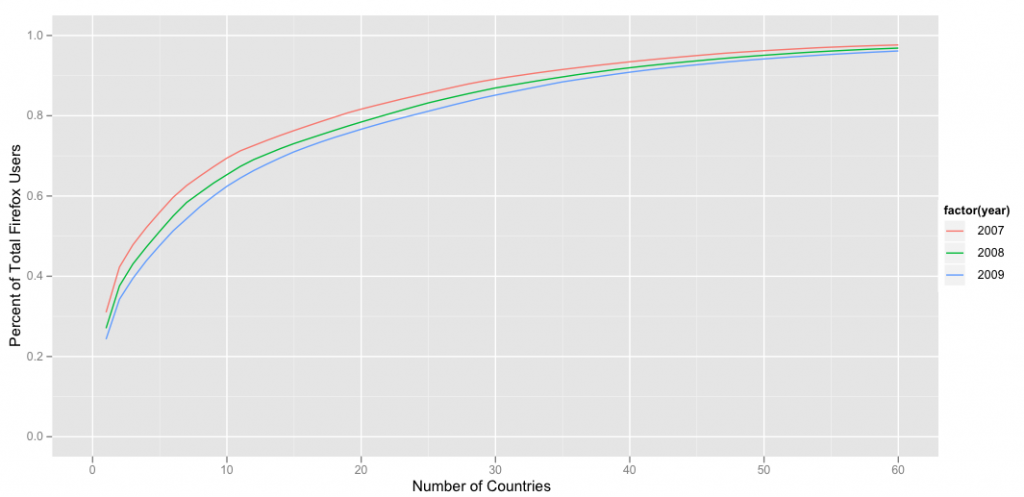
Now that we’ve reviewed our growth in 2009, you may wonder which countries added the most Firefox users. Are a handful of countries with high Internet populations responsible for Firefox’s growth? Or does our growth primarily come from countries with few Internet users?
To answer this question, I looked at the cumulative distribution of Firefox use. The x-axis represents the cumulative number of countries, ordered by decreasing active daily users. The y-axis represents share of total Firefox users.
By plotting the distribution in 2007 against the distributions in 2008 and 2009, we can clearly see whether high or low Internet population countries are increasing their share of users and are thus growing more quickly.
The shift over the last two years has been dramatic. In 2007, five countries accounted for over 55% of Firefox usage. Today, that figure is below 48%. Countries with relatively few Internet user are responsible for an increasing share of Firefox’s growth.
This flattening distribution curve, no doubt, is largely due to increasing Internet penetration in developing countries. (And it should also be noted that many of these users wouldn’t have been reached without the fantastic contributions of our localization community!)

Cornelius wrote on
: