Over the last couple of weeks, I’ve been working with Jan Bambas’s visual event tracer and using it to analyze why we’re slower than the stock Android browser on Eideticker’s New York Times pageload test.
The first order of business was to add trace-saving capabilities to the tracer. With this change, I could capture traces on my Android device and view them on my desktop, which is much more convenient than looking at them on my phone. (Especially because Simile Timeline, which the about:timeline extension uses, is difficult to use on mobile and slow in Firefox, so it needs all the CPU power it can get. If any JS hackers out there have a replacement timeline widget recommendation, I am all ears!)
The second order of business was to modify Firefox to start and stop tracing automatically, rather than requiring the user to push buttons in about:timeline. Pushing buttons works fine on desktop, not so much on automated tests on mobile devices. I experimented with way too many fully general solutions before settling on the straightforward path: modifying nsDocShell::LoadURI to start and stop the tracer when certain URIs were fetched.
Now the tracer would automatically record profiles, on to viewing them! I modified Jan’s about:timeline extension to function properly in a browser not built with event tracing support. I also added the ability to use a trace saved in a file, rather than recording one in a browser. You can see the changes I made in my about:timeline github repository.
With all those changes in hand, we can view pretty pictures of what’s going on when the browser runs Eideticker tests. First, a normal Firefox for Android.
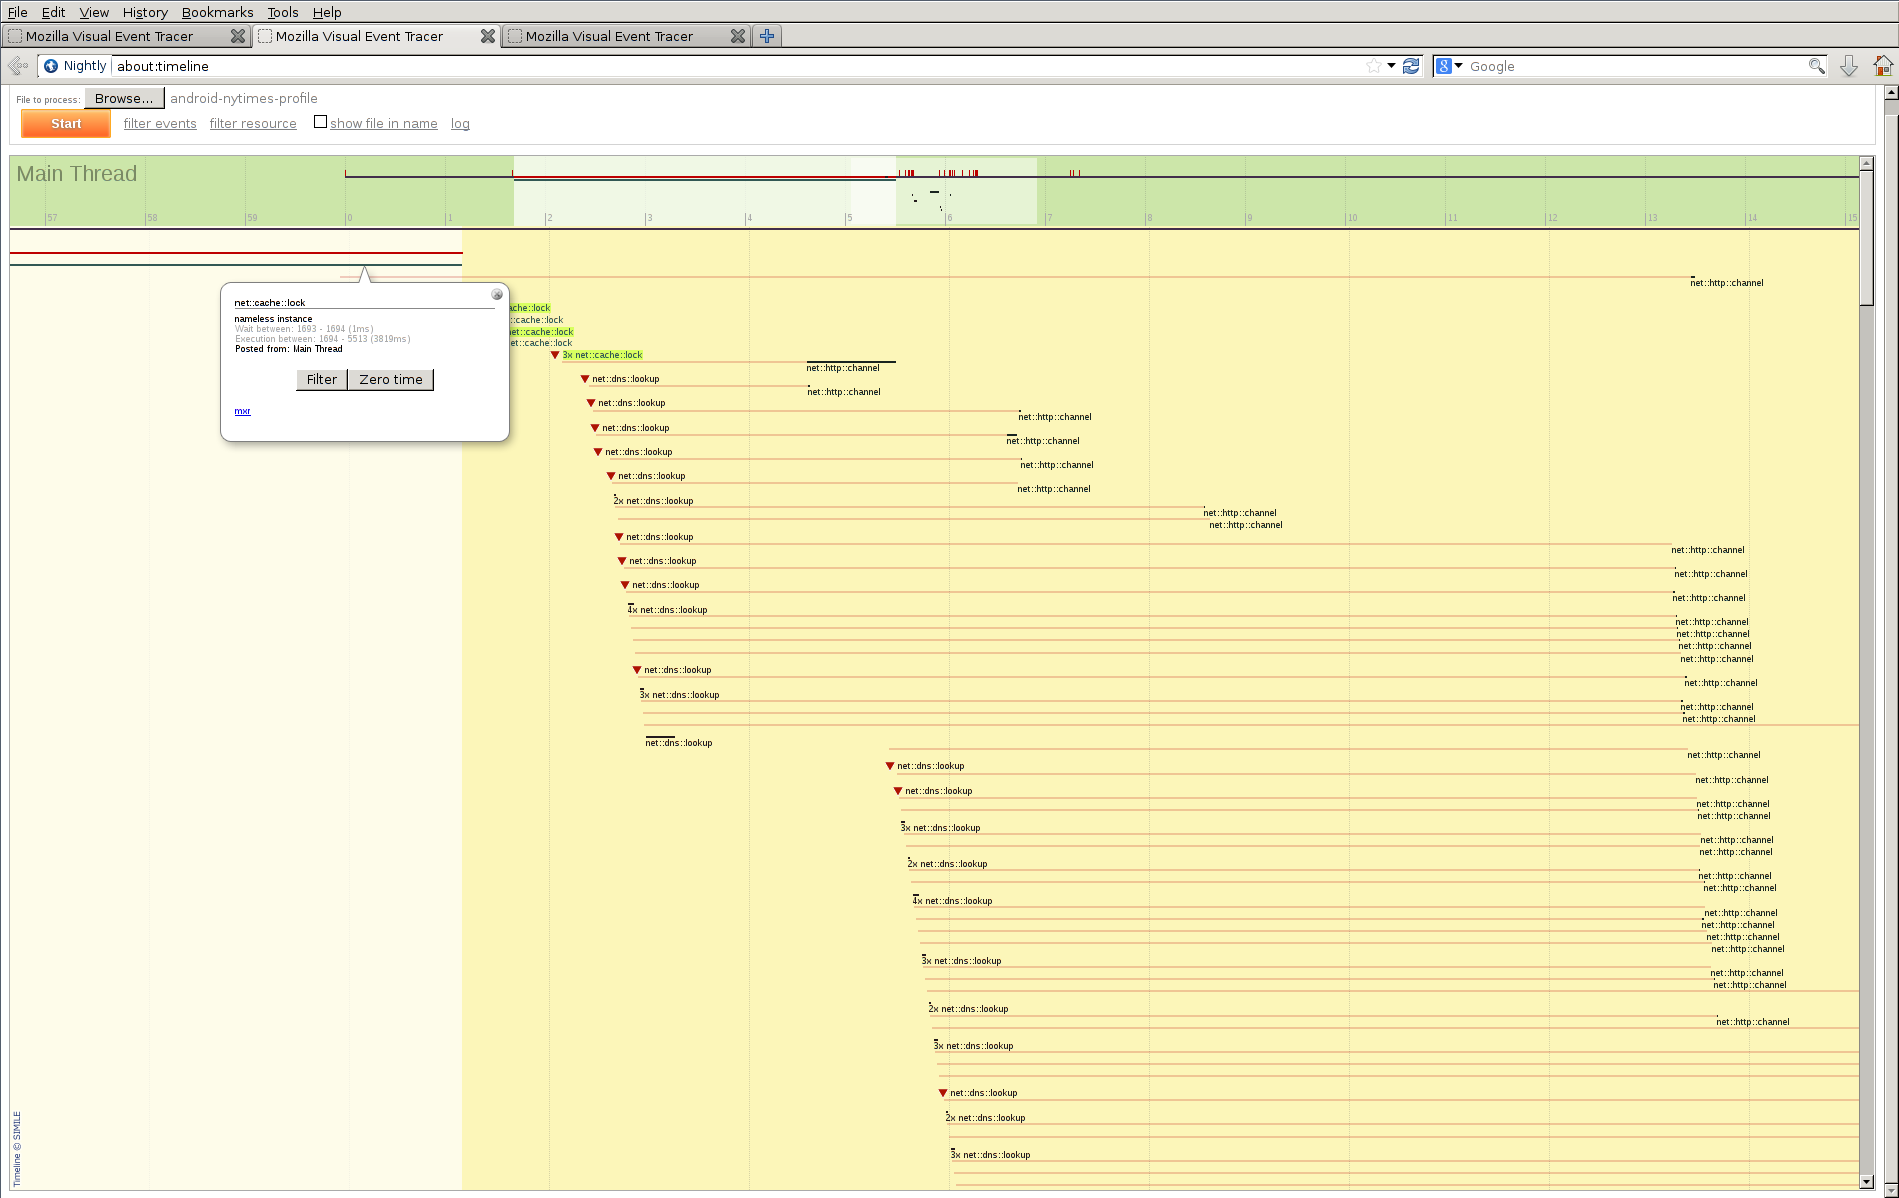
That almost-4-second delay you see there is the cache getting opened. Yes, that’s happening on the main thread and yes, it’s blocking everything else from moving forward. This is a great illustration of why we are rewriting the network cache. If the cache is so slow, what happens if we disable the cache?
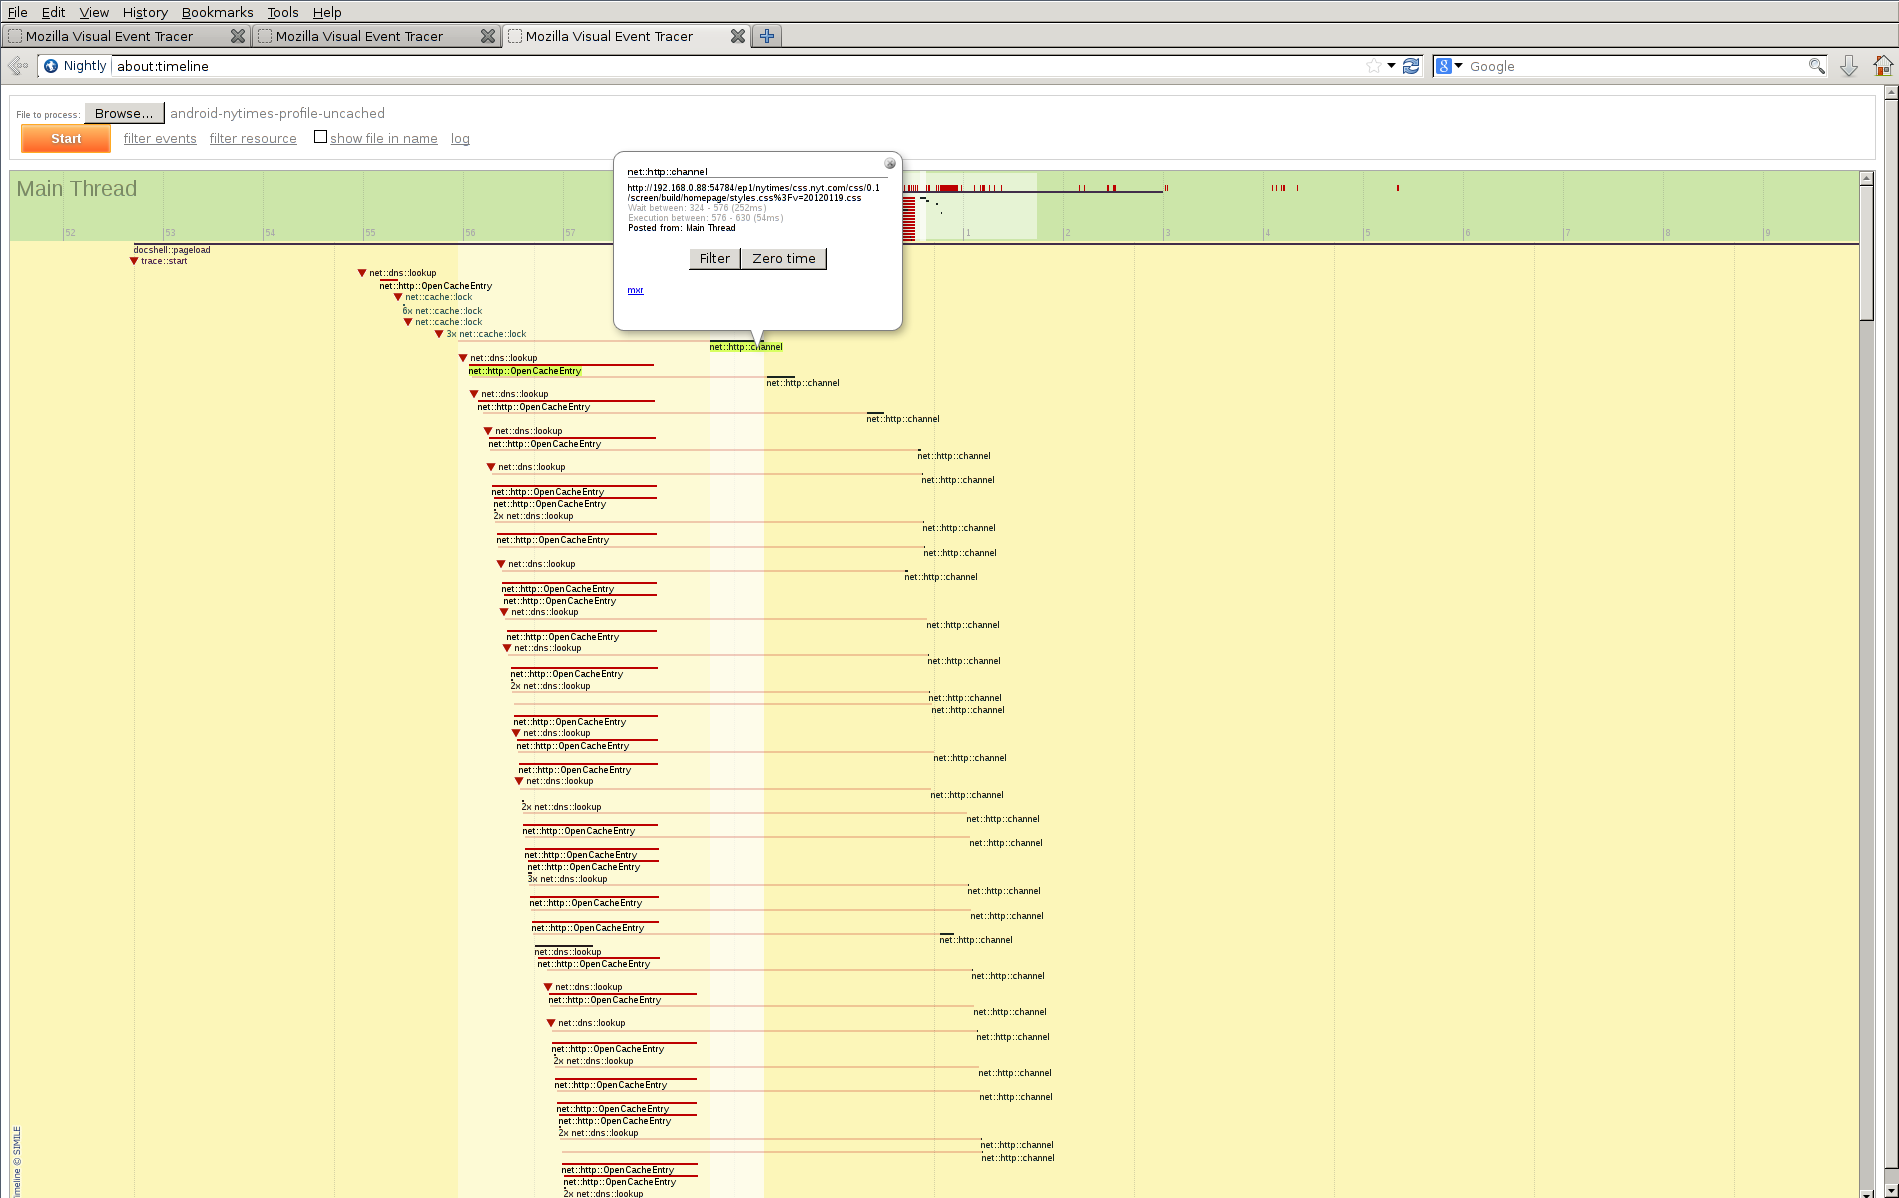
It’s hard to tell from the picture, but if you looked at the Eideticker log of network requests, you’d see that everything completes somewhere around a 0.5-1 second faster (!). Why doesn’t it speed up more than that, since we’ve removed all that cache blocking by disabling the cache? Not sure yet, although you can see that cache entries are still getting opened. Also, you can see highlighted in the picture that the first network request takes about 250ms to start executing from the time that it’s fired off. That also needs to be investigated (and fixed!).
What about this new cache rewrite, how does it fare? Thought you’d never ask.

Again, you have to check out the HTTP request log, but this is still another 0.3 seconds or so faster than the uncached case that we see above. So the new network cache is a clear win in this instance. It’s worth pointing out that the network request delays are still present here and are taking slightly longer than the cache-disabled case. Variance in profiles? Effects of the new cache? Not sure yet!
I’m still figuring out my way around the tracer, but it’s a useful tool to peer into the Firefox network stack. It would be great if other subsystems (images, CSS, layout) would hook into the event tracer so we could have visibility into what they’re doing, too. The API is pretty simple and causes no runtime overhead in our usual release builds.
Very cool!
Various Gecko subsystems are hooked up to the SPS profiler. E.g. see nsRefreshDriver::Tick where it has PROFILER_LABEL(“nsRefreshDriver”, “Tick”).
I think the thing to do here is to integrate the visual event tracer with these SPS profiler labels. We do not want to duplicate hooks here.
Yeah, we could integrate those with the event tracer. The only wrinkle is that the SPS profiler’s labels are measuring the inclusive cost of the particular block of code in which they reside, whereas the event tracer can tell you how long an operation associated with a given object takes (and how long it’s waiting before it starts), e.g. if the event loop is involved somehow. My impression is that the labels are sprinkled much more widely about the codebase than event tracer markers would be, since the labels were/are used for “stack unwinding” in lieu of native stack frame unwinding. Maybe there’s a good way to integrate them; I haven’t thought much about it. The fewer annotations we need to add, the better.
I understand that event tracing is more general, but SPS labels are a natural special case of the event tracer’s intervals, so I think they fit.
If we don’t want them all to show up in the visual event tracer, then either we could create a way to selectively enable subsets of SPS labels in the VET, or we could have variants of the SPS label macros that opt into appearing in the VET (and convert some of the existing labels to use those new macros).
Very cool! I suspected something was wrong here. Glad to see someone getting to the root of the issues. 🙂
It would be nice if the timeline were just a standard webpage, ala Cleopatra, the SPS profiler. If that were the case, we could generate these timelines every eideticker run and make them viewable just by clicking a link on the dashboard.