TL;DR: Cross-browser comparisons of memory consumption should be avoided. If you want to evaluate how efficiently browsers use memory, you should do cross-browser comparisons of performance across several machines featuring a range of memory configurations.
Cross-browser Memory Comparisons are Bad
Various tech sites periodically compare the performance of browsers. These often involve some cross-browser comparisons of memory efficiency. A typical one would be this: open a bunch of pages in tabs, measure memory consumption, then close all of them except one and wait two minutes, and then measure memory consumption again. Users sometimes do similar testing.
I think comparisons of memory consumption like these are (a) very difficult to make correctly, and (b) very difficult to interpret meaningfully. I have suggestions below for alternative ways to measure memory efficiency of browsers, but first I’ll explain why I think these comparisons are a bad idea.
Cross-browser Memory Comparisons are Difficult to Make
Getting apples-to-apples comparisons are really difficult.
- Browser memory measurements aren’t easy. In particular, all browsers use multiple processes, and accounting for shared memory is difficult.
- Browsers are non-deterministic programs, and this can cause wide variation in memory consumption results. In particular, whether or not the JavaScript garbage collector runs can greatly reduce memory consumption. If you get unlucky and the garbage collector runs just after you measure, you’ll get an unfairly high number.
- Browsers can exhibit adaptive memory behaviour. If running on a machine with lots of free RAM, a browser may choose to take advantage of it; if running on a machine with little free RAM, a browser may choose to discard regenerable data more aggressively.
If you are comparing two versions of the same browser, problems (1) and (3) are avoided, and so if you are careful with problem (2) you can get reasonable results. But comparing different browsers hits all three problems.
Indeed, Tom’s Hardware de-emphasized memory consumption measurements in their latest Web Browser Grand Prix due to problem (3). Kudos to them!
Cross-browser Memory Comparisons are Difficult to Interpret
Even if you could get the measurements right, memory consumption is still not a good thing to compare. Before I can explain why, I’ll introduce a couple of terms.
- A primary metric is one a user can directly perceive. Metrics that measure performance and crash rate are good examples.
- A secondary metric is one that a user can only indirectly perceive via some kind of tool. Memory consumption is one example. The L2 cache miss rate is another example.
(I made up these terms, I don’t know if there are existing terms for these concepts.)
Primary metrics are obviously important, precisely because user can detect them. They measure things that users notice: “this browser is fast/slow”, “this browser crashes all the time”, etc.
Secondary metrics are important because they can affect primary metrics: memory consumption can affect performance and crash rate; the L2 cache miss rate can affect performance.
Secondary metrics are also difficult to interpret. They can certainly be suggestive, but there are lots of secondary metrics that affect each primary metric of interest, so focusing too strongly on any single secondary metric is not a good idea. For example, if browser A has a higher L2 cache miss rate than browser B, that’s suggestive, but you’d be unwise to draw any strong conclusions from it.
Furthermore, memory consumption is harder to interpret than many other secondary metrics. If all else is equal, a higher L2 cache miss rate is worse than a lower one. But that’s not true for memory consumption. There are all sorts of time/space trade-offs that can be made, and there are many cases where using more memory can make browsers faster; JavaScript JITs are a great example.
And I haven’t even discussed which memory consumption metric you should use. Physical memory consumption is an obvious choice, but I’ll discuss this more below.
A Better Methodology
So, I’ve explained why I think you shouldn’t do cross-browser memory comparisons. That doesn’t mean that efficient usage of memory isn’t important! However, instead of directly measuring memory consumption — a secondary metric — it’s far better to measure the effect of memory consumption on primary metrics such as performance.
In particular, I think people often use memory consumption measurements as a proxy for performance on machines that don’t have much RAM. If you care about performance on machines that don’t have much RAM, you should measure performance on a machine that doesn’t have much RAM instead of trying to infer it from another measurement.
Experimental Setup
I did exactly this by doing something I call memory sensitivity testing, which involves measuring browser performance across a range of memory configurations. My test machine had the following characteristics.
- CPU: Intel i7-2600 3.4GHz (quad core with hyperthreading)
- RAM: 16GB DDR3
- OS: Ubuntu 11.10, Linux kernel version 3.0.0.
I used a Linux machine because Linux has a feature called cgroups that allows you to restrict the machine resources available to one or more processes. I followed Justin Lebar’s instructions to create the following configurations that limited the amount of physical memory available: 1024MiB, 768MiB, 512MiB, 448MiB, 384MiB, 320MiB, 256MiB, 192MiB, 160MiB, 128MiB, 96MiB, 64MiB, 48MiB, 32MiB.
(The more obvious way to do this is to use ulimit, but as far as I can tell it doesn’t work on recent versions of Linux or on Mac. And I don’t know of any way to do this on Windows. So my experiments had to be on Linux.)
I used the following browsers.
- Firefox 12 Nightly, from 2012-01-10 (64-bit)
- Firefox 9.0.1 (64-bit)
- Chrome 16.0.912.75 (64-bit)
- Opera 11.60 (64-bit)
IE and Safari aren’t represented because they don’t run on Linux. Firefox is over-represented because that’s the browser I work on and care about the most 🙂 The versions are a bit old because I did this testing about six months ago.
I used the following benchmark suites: Sunspider v0.9.1, V8 v6, Kraken v1.1. These are all JavaScript benchmarks and are all awful for gauging a browser’s memory efficiency; but they have the key advantage that they run quite quickly. I thought about using Dromaeo and Peacekeeper to benchmark other aspects of browser performance, but they take several minutes each to run and I didn’t have the patience to run them a large number of times. This isn’t ideal, but I did this exercise to test-drive a benchmarking methodology, not make a definitive statement about each browser’s memory efficiency, so please forgive me.
Experimental Results
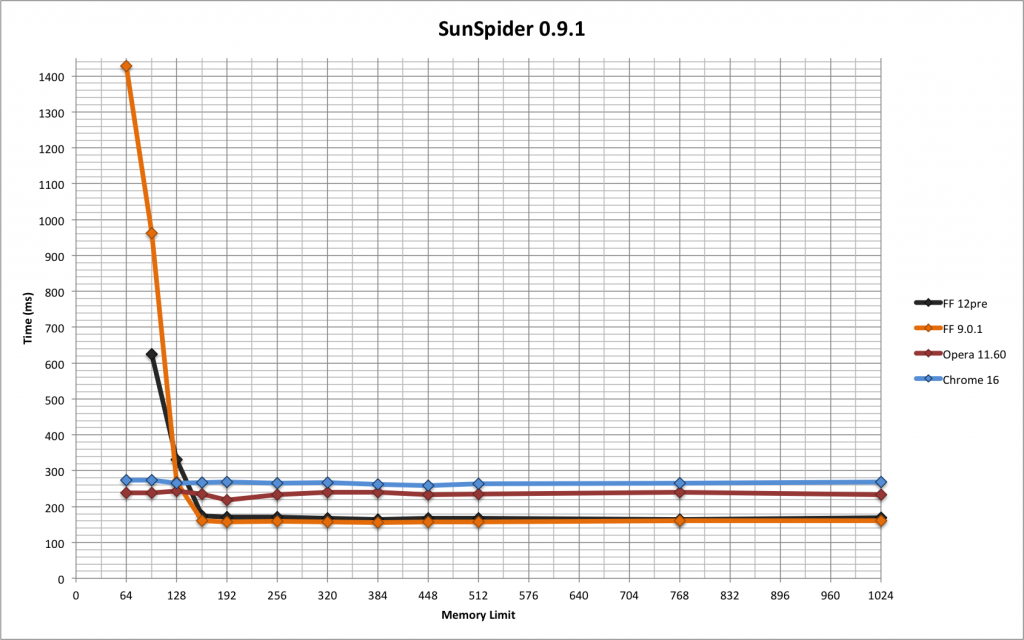
The following graph shows the Sunspider results. (Click on it to get a larger version.)
As the lines move from right to left, the amount of physical memory available drops. Firefox was clearly the fastest in most configurations, with only minor differences between Firefox 9 and Firefox 12pre, but it slowed down drastically below 160MiB; this is exactly the kind of curve I was expecting. Opera was next fastest in most configurations, and then Chrome, and both of them didn’t show any noticeable degradation at any memory size, which was surprising and impressive.
All the browsers crashed/aborted if memory was reduced enough. The point at which the graphs stop on the left-hand side indicate the lowest size that each browser successfully handled. None of the browsers ran Sunspider with 48MiB available, and FF12pre failed to run it with 64MiB available.
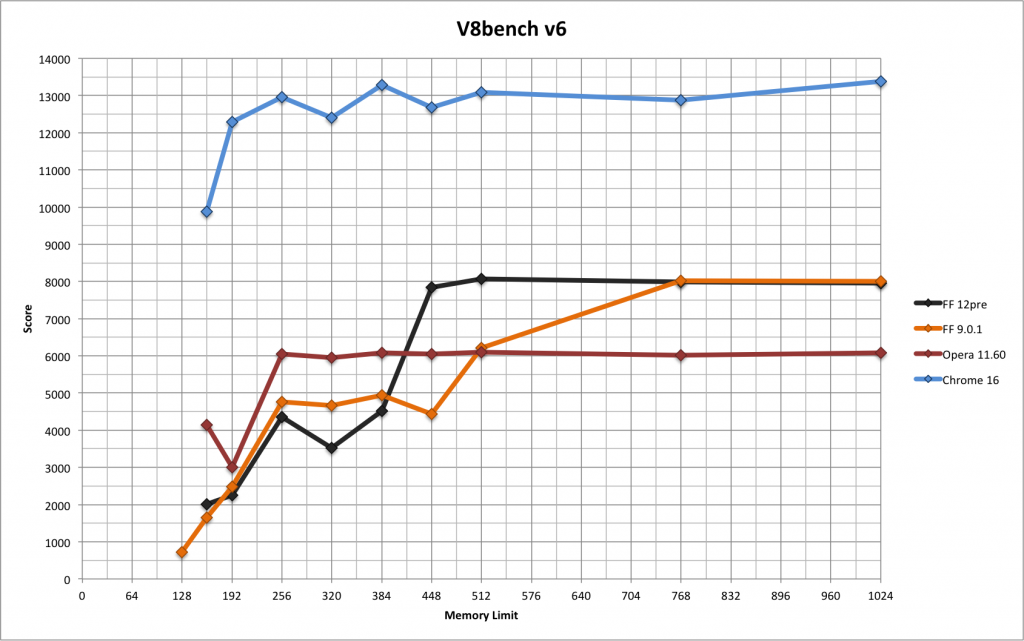
The next graph shows the V8 results.
The curves go the opposite way because V8 produces a score rather than a time, and bigger is better. Chrome easily got the best scores. Both Firefox versions degraded significantly. Chrome and Opera degraded somewhat, and only at lower sizes. Oddly enough, FF9 was the only browser that managed to run V8 with 128MiB available; the other three only ran it with 160MiB or more available.
I don’t particularly like V8 as a benchmark. I’ve always found that it doesn’t give consistent results if you run it multiple times, and these results concur with that observation. Furthermore, I don’t like that it gives a score rather than a time or inverse-time (such as runs per second), because it’s unclear how different scores relate.
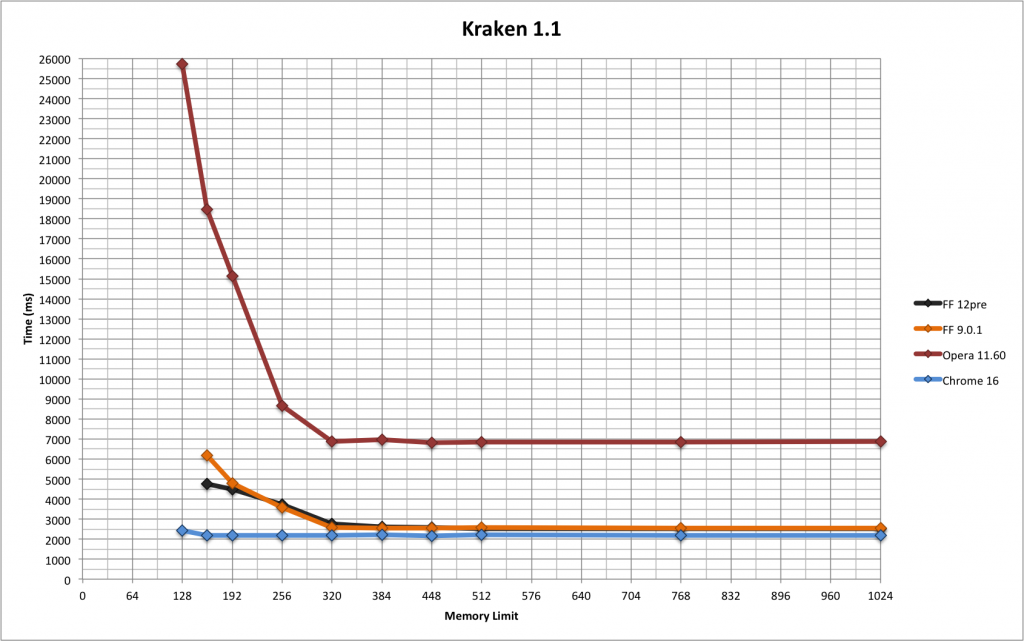
The final graph shows the Kraken results.
As with Sunspider, Chrome barely degraded and both Firefoxes degraded significantly. Opera was easily the slowest to begin with and degraded massively; nonetheless, it managed to run with 128MiB available (as did Chrome), which neither Firefox managed.
Experimental Conclusions
Overall, Chrome did well, and Opera and the two Firefoxes had mixed results. But I did this experiment to test a methodology, not to crown a winner. (And don’t forget that these experiments were done with browser versions that are now over six months old.) My main conclusion is that Sunspider, V8 and Kraken are not good benchmarks when it comes to gauging how efficiently browsers use memory. For example, none of the browsers slowed down on Sunspider until memory was restricted to 128MiB, which is a ridiculously small amount of memory for a desktop or laptop machine; it’s small even for a smartphone. V8 is clearly stresses memory consumption more, but it’s still not great.
What would a better benchmark look like? I’m not completely sure, but it would certainly involve opening multiple tabs and simulate real-world browsing. Something like Membench (see here and here) might be a reasonable starting point. To test the impact of memory consumption on performance, a clear performance measure would be required, because Membench lacks one currently. To test the impact of memory consumption on crash rate, Membench could be modified to just keep opening pages until the browser crashes. (The trouble with that is that you’d lose your count when the browser crashed! You’d need to log the current count to a file or something like that.)
BTW, if you are thinking “you’ve just measured the working set size“, you’re exactly right! I think working set size is probably the best metric to use when evaluating memory consumption of a browser. Unfortunately it’s hard to measure (as we’ve seen) and it is best measured via a curve rather than a single number.
A Simpler Methodology
I think memory sensitivity testing is an excellent way to gauge the memory efficiency of different browsers. (In fact, the same methodology can be used for any kind of program, not just browsers.)
But the above experiment wasn’t easy: it required a Linux machine, some non-trivial configuration of that machine that took me a while to get working, and at least 13 runs of each benchmark suite for each browser. I understand that tech sites would be reluctant to do this kind of testing, especially when longer-running benchmark suites such as Dromaeo and Peacekeeper are involved.
A simpler alternative that would still be quite good would be to perform all the performance tests on several machines with different memory configurations. For example, a good experimental setup might involve the following machines.
- A fast desktop with 8GB or 16GB of RAM.
- A mid-range laptop with 4GB of RAM.
- A low-end netbook with 1GB or even 512MB of RAM.
This wouldn’t require nearly as many runs as full-scale memory sensitivity testing would. It would avoid all the problems of cross-browser memory consumption comparisons: difficult measurements, non-determinism, and adaptive behaviour. It would avoid secondary metrics in favour of primary metrics. And it would give results that are easy for anyone to understand.
(In some ways it’s even better than memory sensitivity testing because it involves real machines — a machine with a 3.4GHz i7-2600 CPU and only 128MiB of RAM isn’t a realistic configuration!)
I’d love it if tech sites started doing this.


19 replies on “How to Compare the Memory Efficiency of Web Browsers”
So, what’s up with the recent ~30MB oscillations on areweslimyet for the following measures?
RSS: After TP5, tabs closed [+30s]
RSS: After TP5, tabs closed [+30s, forced GC]
Off-topic.
Well, are they due to an inadequacy of your internally used metric, or changes in the moz-central code base?
If you care about this, why not contact Nicholas directly, rather than leaving comment on his blog that make it harder to follow relevant conversation?
> Cross-browser comparisons of memory consumption should be avoided.
You just know people are going to take this out of context and scream “losers!”
I would have led with “To evaluate how efficiently browsers use memory, you should do cross-browser comparisons of performance across several machines featuring a range of memory configurations, instead of trying to measure memory usage directly.”
TL;DR.
so you suck at memory so you say we shouldn’t compare on memory..
bloatware!
/s
Please tell me this is joke comment. Please.
/s is the sarcasm mark. HAMBURGER, abbreviated {//}, can also play the same role. People and screenwriters sometimes also use a parenthesised exclamation point (!)
I did not know that. Thanks for the clarification!
perceived speed is important. How many times i did kill my browser is important. I kill firefox more frequently then any other browser,
What does cgroups do when a process uses more memory? Start swapping that process (and only that process) to disk? Why would that cause crashes?
Have you tried using mlock? For example, on a machine with 4GB RAM, have a process mlock 3GB of memory into RAM, leaving 1GB RAM for the OS and Firefox. The API exists on both Mac and Linux.
I think it starts swapping. Not sure why it causes crashes.
I didn’t know about mlock; thanks for the suggestion.
I don’t agree that the argument, that I see too frequently, that memory footprint should not be a variable when looking at performance. At least for me it is very much an important factor. Especially when you take into account that most users also run many other applications, not just the browser.
The, bar none, memory hog today is the browser. Its the application I use the most, but I have to restart it several times a day due to that it is slowly eating up the memory resources and slowing down all the other applications I am using.
I’ve been following your #MemShrink work since it was first announced and am thrilled about how it has improved my UX using the computer. BM (Before MemShrink) Firefox frequently gobbled up 3-4Gb, rendering both it and my 4Gb machine practically useless. Now it rarely gets above 1Gb even with 40+ tabs open.
Best though is that my overall productivity using the machine exponentially has improved!
I am also pleased that your work not only has improved Firefox, but also created more general awareness about how applications hog memory.
For me its simple. Developers need to respect that their application has to share the resources with others and stop taking for granted there is an unlimited amount to use.
That’s one more reason for why I applaud your now 1+ year effort!
Keep up the good work.
You’re missing the point. If the case that is interesting to you is the performance of the system with multiple applications, then *directly measure the performance of the system with multiple applications*. Don’t use memory consumption as a proxy for that. More succinctly: directly measure what you care about, don’t try to infer it from secondary metrics.
In the interest of automated testing, how hard would it be to combine something like Membench with Peptest and run the whole thing on a VM with various memory configurations? Perhaps a VM configured to run without a swap file, to avoid that variable (so you can look at how browsers cut back on memory use more aggressively instead of looking how much slower swapping is) – though that would probably make things crash sooner.
you say that browser have adaptive behavior but from the graph it seems not, they slow down only when memory is very limited and that can be just from more GC cycle.
For example in about:cache I see a 32MB memory cache that’s almost completely empty. I don’t know exactly what’s used for but if I have memory why don’t use it? I would use even 500MB of memory if it means faster browsing until there’s external memory pressure.
Another thing is image caching, I changed values on about:config because many times I switched tab and they were regenerated again. I don’t mind aggressive memory usage if it means a faster browser. Even the low end netbooks have 2GB of memory and every laptop and desktop have at least 4GB. If the browser use half of that it’s not a problem, just be fast 🙂
Ideally, the OS would help us manage uncompressed image data much like it manages the filesystem cache. We’d tell it “this 1MB chunk of memory is tossable; in fact, we’d prefer it being tossed rather than swapped to disk”. Upon tossing the memory, it would tell us and/or allow us to handle page faults to that memory.
I think measuring performance degradation as you go down down isn’t the only interesting thing to measure. How well a browser scales up to gigabytes of memory usage (due to many open taps, many high-res images loaded, some fancy HTML5 stuff going on…) can be interesting too. Personally i have many many tabs open and even if they’re doing nothing at all they seem to slow down garbage collections (and thus the whole browser) as the garbage collector does not scale well enough.
Multithreaded garbage collection would be such a nice thing…
Unless you have a garbage-collected language and the garbage collector starts pulling out pages out of swap. Then measuring the virtual memory size may be a better choice.
Or when you’re running a 32bit process and crash due to the 4GB limit, then the virtual memory footprint is a better measure too.
Sure, if you have loads of tabs on a 32-bit Firefox vsize is also important. That’s a case that’s experienced by a tiny fraction of users, though.