Categories
about:compartments about:memory Firefox Memory consumption MemShrink

MemShrink progress, week 117–120

Lots of important MemShrink stuff has happened in the last 27 days:  22 bugs were fixed, and some of them were very important indeed.

Images

Timothy Nikkel fixed bug 847223, which greatly reduces peak memory consumption when loading image-heavy pages.  The combination of this fix and the fix from bug 689623 — which Timothy finished earlier this year and which shipped in Firefox 24 — have completely solved our longstanding memory consumption problems with image-heavy pages!  This was the #1 item on the MemShrink big ticket items list.

To give you an idea of the effect of these two fixes, I did some rough measurements on a page containing thousands of images, which are summarized in the graph below.

Improvements in Firefox's Memory Consumption on One Image-heavy Page

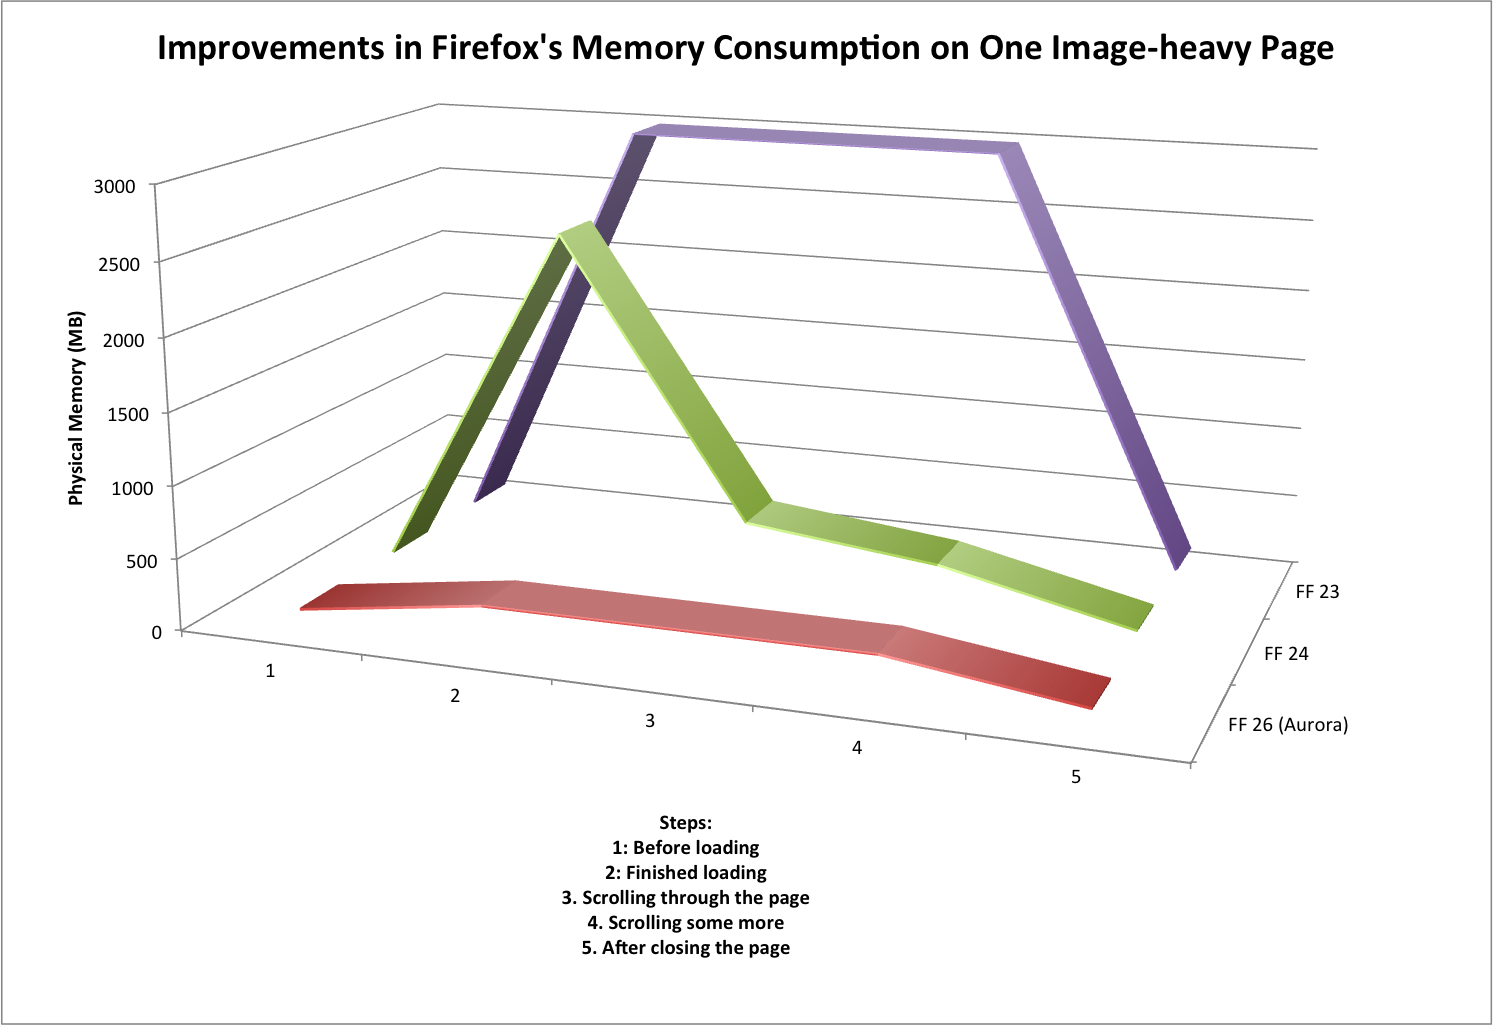
First consider Firefox 23, which had neither fix, and which is represented by the purple line in the graph.  When loading the page, physical memory consumption would jump to about 3 GB, because every image in the page was decoded (a.k.a. decompressed).  That decoded data was retained so long as the page was in the foreground.

Next, consider Firefox 24 (and 25), which had the first fix, and which is represented by the green line on the graph.  When loading the page, physical memory consumption would still jump to almost 3 GB, because the images are still decoded.  But it would soon drop down to a few hundred MB, as the decoded data for non-visible images was discarded, and stay there (with some minor variations) while scrolling around the page. So the scrolling behaviour was much improved, but the memory consumption spike still occurred, which could still cause paging, out-of-memory problems, and the like.

Finally consider Firefox 26 (currently in the Aurora channel), which has both fixes, and which is represented by the red line on the graph.  When loading the page, physical memory jumps to a few hundred MB and stays there.  Furthermore, the loading time for the page dropped from ~5 seconds to ~1 second, because the unnecessary decoding of most of the images is skipped.

These measurements were quite rough, and there was quite a bit of variation, but the magnitude of the improvement is obvious.  And all these memory consumption improvements have occurred without hurting scrolling performance.  This is fantastic work by Timothy, and great news for all Firefox users who visit image-heavy pages.

[Update: Timothy emailed me this:  “Only minor thing is that we still need to turn it on for b2g. We flipped the pref for fennec on central (it’s not on aurora though). I’ve been delayed in testing b2g though, hopefully we can flip the pref on b2g soon. That’s the last major thing before declaring it totally solved.”]

[Update 2: This has hit Hacker News.]

NuWa

Cervantes Yu landed Nuwa, which is a low-level optimization of B2G.  Quoting from the big ticket items list (where this was item #3):

Nuwa… aims to give B2G a pre-initialized template process from which every subsequent process will be forked… it greatly increases the ability for B2G processes to share unchanging data.  In one test run, this increased the number of apps that could be run simultaneously from five to nine

Nuwa is currently disabled by default, so that Cervantes can fine-tune it, but I believe it’s intended to ship with B2G version 1.3.  Fingers crossed it makes it!

Memory Reporting

I made some major simplifications to our memory reporting infrastructure, paving the way for future improvements.

First, we used to have two kinds of memory reporters:  uni-reporters (which report a single measurement) and multi-reporters (which report multiple measurements).  Multi-reporters, unsurprisingly, subsume uni-reporters, and so I got rid of uni-reporters, which simplified quite a bit of code.

Second, I removed about:compartments and folded its functionality into about:memory.  I originally created about:compartments at the height of our zombie compartment problem.  But ever since Kyle Huey made it more or less impossible for add-ons to cause zombie compartments, about:compartments has hardly been used.   I was able to fold about:compartments’ data into about:memory, so there’s no functionality loss, and this change simplified quite a bit more code.  If you visit about:compartments now you’ll get a message telling you to visit about:memory.

Third, I removed the smaps (size/rss/pss/swap) memory reporters.  These were only present on Linux, they were of questionable utility, and they complicated about:memory significantly.

Finally, I fixed a leak in about:memory.  Yeah, it was my fault.  Sorry!

Summit

The Mozilla summit is coming up!  In fact, I’m writing this report a day earlier than normal because I will be travelling to Toronto tomorrow.  Please forgive any delayed responses to comments, because I will be travelling for almost 24 hours to get there.

Categories
about:memory Firefox Memory consumption MemShrink

MemShrink progress, week 113–116

It’s been a relatively quiet four weeks for MemShrink, with 17 bugs fixed.  (Relatedly, in today’s MemShrink meeting we only had to triage 10 bugs, which is the lowest we’ve had for ages.)  Among the fixed bugs were lots for B2G leaks and leak-like things, many of which are hard to explain, but are important for the phone’s stability.

Fabrice Desré made a couple of notable B2G non-leak fixes.

On desktop, Firefox users who view about:memory may notice that it now sometimes mentions more than one process.  This is due to the thumbnails child process, which generates the thumbnails seen on the new tab page, and which occasionally is spawned and runs briefly in the background.  about:memory copes with this child process ok, but the mechanism it uses is sub-optimal, and I’m planning to rewrite it to be nicer and scale better in the presence of multiple child processes, because that’s a direction we’re heading in.

Finally, some sad news:  Justin Lebar, whose name should be familiar to any regular reader of these MemShrink reports, has left Mozilla.  Justin was a core MemShrink-er from the very beginning, and contributed greatly to the success of the project.  Thanks, Justin, and best of luck in the future!

Categories
about:memory B2G Firefox Memory consumption MemShrink

MemShrink progress, week 109–112

There’s been a lot of focus on B2G memory consumption in the past four weeks.  Indeed, of the 38 MemShrink bugs fixed in that time, a clear majority of them relate in some way to B2G.

In particular, Justin Lebar, Kyle Huey and Andrew McCreight have done a ton of important work tracking down leaks in both Gecko and Gaia.  Many of these have been reported by B2G partner companies doing stress testing such as opening and closing apps 100s or 1000s of times over long period.  Some examples (including three MemShrink P1s) are here, here, here, here, here, here, here and here.  There are still some P1s remaining (e.g. here, here, here).  This work is painstaking and requires lots of futzing around with low-level tools such as the GC/CC logs, unfortunately.

Relatedly, Justin modified the JS memory reporter to report “notable” strings, which includes smallish strings that are duplicated many times, a case that has occurred on B2G a couple of times.  Justin also moved some of the “heap-*” reports that previously lived in about:memory’s “Other measurements” section into the “explicit” tree.  This makes “explicit” closer to “resident” a lot of the time, which is a useful property.

Finally, Luke Wagner greatly reduced the peak memory usage seen during parsing large asm.js examples.  For the Unreal demo, this reduced the peak from 881MB to 6MB, and reduced start-up time by 1.5 seconds!  Luke also slightly reduced the size of JSScript, which is one of the very common structures on the JS GC heap, thus reducing pressure on the GC heap, which is always a good thing.


Categories
about:memory add-ons Firefox Memory consumption MemShrink

MemShrink progress, week 105–108

This is the first of the every-four-weeks MemShrink reports that I’m now doing.  The 21 bugs fixed in the past four weeks include 11 leak fixes, which is great, but I won’t bother describing them individually.  Especially when I have several other particularly impressive fixes to describe…

Image Handling

Back in March I described how Timothy Nikkel had greatly improved Firefox’s handling of image-heavy pages.  Unfortunately, the fix had to be disabled in Firefox 22 and Firefox 23 because it caused jerky scrolling on pages with lots of small images, such as Pinterest.

Happily, Timothy has now fixed those problems, and so his previous change has been re-enabled in Firefox 24.  This takes a big chunk out of the #1 item on the MemShrink big ticket items list.  Fantastic news!

Lazy Bytecode Generation

Brian Hackett finished implementing lazy bytecode generation.  This change means that JavaScript functions don’t have bytecode generated for them until they run.  Because lots of websites use libraries like jQuery, in practice a lot of JS functions are never run, and we’ve found this can reduce Firefox’s memory consumption by 5% or more on common workloads!  That’s a huge, general improvement.

Furthermore, it significantly reduces the number of things that are allocated on the GC heap (i.e. scripts, strings, objects and shapes that are created when bytecode for a function is generated).  This reduces pressure on the GC which makes it less likely we’ll have bad GC behaviour (e.g. pauses, or too much memory consumption) in cases where the GC heuristics aren’t optimal.

The completion of this finished off item #5 on the old Memshrink big ticket items list.  Great stuff.  This will be in Firefox 24.

Add-on Memory Reporting

Nils Maier implemented add-on memory reporting in about:memory.  Here’s some example output from my current session.

├───33,345,136 B (05.08%) -- add-ons
│   ├──18,818,336 B (02.87%) ++ {d10d0bf8-f5b5-c8b4-a8b2-2b9879e08c5d}
│   ├──11,830,424 B (01.80%) ++ {59c81df5-4b7a-477b-912d-4e0fdf64e5f2}
│   └───2,696,376 B (00.41%) ++ treestyletab@piro.sakura.ne.jp/js-non-window/zones/zone(0x7fbd7bf53800)

It’s obvious that Tree Style Tabs is taking up 2.7 MB.  What about the other two entries?  It’s not immediately obvious, but if I look in about:support at the “extensions” section I can see that they are AdBlock Plus and ChatZilla.

If you’re wondering why those add-ons are reported as hex strings, it’s due to a combination of the packaging of each individual add-on, and the fact that the memory reporting code is C++ and the add-on identification code is JS and there aren’t yet good APIs to communicate between the two.  (Yes, it’s not ideal and should be improved, but it’s a good start.)  Also, not all add-on memory is reported, just that in JS compartments;  old-style XUL add-ons in particular can have their memory consumption under-reported.

Despite the shortcomings, this is a big deal.  Users have been asking for this information for years, and we’ve finally got it.  (Admittedly, the fact that we’ve tamed add-on leaks makes it less important than it used to be, but it’s still cool.)  This will also be in Firefox 24.

b2g

Gregor Wagner has landed a nice collection of patches to help the Twitter and Notes+ apps on B2G.

While on the topic of B2G, in today’s MemShrink meeting we discussed the ongoing problem of slow memory leaks in the main B2G process.  Such leaks can cause the phone to crash or become flaky after its been running for hours or days or weeks, and they’re really painful to reproduce and diagnose.  Our partners are finding these leaks when doing multi-hour stress tests as part of their QA processes.  In contrast, Mozilla doesn’t really have any such testing, and as a result we are reacting, flat-footed, to external reports, rather than catching them early ourselves.  This is a big problem because users will rightly expect to have their phones run for weeks (or even months) without rebooting.

Those of us present at the meeting weren’t quite sure how we can improve our QA situation to look for these leaks.  I’d be interested to hear any suggestions.  Thanks!

Categories
about:memory Firefox MemShrink

Recent about:memory improvements

The landing of patches from two recent bugs has substantially changed the look of about:memory.  When you load the page all see now is the following.

about:memory screenshot

Measurements aren’t taken away;  you have to click on the “Measure” button for that to happen.  Also, adding ?verbose to the URL no longer has an effect.  If you want verbose output, you need to click on the “verbose” checkbox.

The motivation for this change was that about:memory’s functionality has expanded greatly over the past two years, and cramming more functionality into the existing UI was a bad idea.  There are numerous advantages to the new UI.

  • No need to control behaviour via the URL, which is admittedly an odd way to do it.
  • You can switch between verbose and non-verbose modes without having to reload the page.
  • All the buttons are at the top of the page instead of the bottom, so you don’t have to scroll down.
  • You can trigger a GC/CC/minimize memory usage event without having do a memory measurement.
  • When you save reports to file, it’s clearer that a new measurement will be taken, rather than saving any measurements that are currently displayed on the screen.
  • The buttons are grouped by function, which makes them easier to understand.

There’s also the “Load and diff…” button, which lets you easily find the difference between two saved memory report files.  Here’s some example output taken after closing a tab containing a Google search result.

about:memory diff output

You can see that all the measurements are negative.  The [-] markers on leaf nodes in the tree indicate that they are present in the first file but not in the second file.  Corresponding [+] markers are used for measurements present in the second file but not the first.

Categories
about:memory B2G Memory consumption MemShrink

MemShrink progress, week 95–96

B2G Fixes

Kyle Huey made image.src='' discard the image immediately even if the image is not in the document.  This provides a way for image memory to be discarded immediately, which is important for some B2G apps such as the Gallery app.  This was a MemShrink:P1 bug.

Justin Lebar fixed a bad leak in AudioChannelAgent.

Mike Habicher fixed an image-related leak that was manifesting on B2G.

Other Fixes

I exposed the existing JSON memory report dumping functionality in about:memory.  As a result, gzipped JSON is now the preferred format for attaching memory report data to bugs.  This was a MemShrink:P1 bug.

Honza Bambas overhauled the DOM storage code.  Apparently this might reduce memory consumption, but I fully admit to not knowing the details.

Nicolas Silva fixed a leak in layers code relating to OMTC.

I removed the MEMORY_EXPLICIT telemetry measurement.  I didn’t want to do this, but it’s been causing hangs for some users, and those hangs are hard to avoid due to the complexity of reporting memory consumption from web workers.  Furthermore, in practice the measurement was sufficiently noisy that we’ve never gotten anything useful from it.

Help Needed

Mozilla code uses a mixture of fallible and infallible allocations.  In theory, any allocation that could allocate a large amount of memory (e.g. a few hundred KiB or more) should use a fallible allocator.  We’ve seen recently some cases where large allocations were being made infallibly, which led to OOM crashes.  Bug 862592 proposes adding an assertion to the infallible allocators that the request size isn’t too large.  This is an easy bug to get started with, if anyone is interested.  Details are in the bug.

Bug Counts

Here are the current bug counts.

  • P1: 15 (-4/+4)
  • P2: 145 (-0/+7)
  • P3: 131 (-2/+4)
  • Unprioritized: 5 (-1/+5)

Interregnum

I will be on vacation during May.  As a result, there will be no MemShrink reports for the next three fortnights.  (Although I’ll be away for just over four weeks, that period covers three MemShrink meetings.)  I’ll be back with the next report on June 11.  See you then!

Categories
about:memory MemShrink

Gzipped JSON is now the preferred format for attaching memory report data to bugs

Old: Text

about:memory is our main memory profiling tool.  You can copy and paste the memory reports shown by about:memory and they will reproduce nicely — so long as the displaying text is a fixed-width font — as the following example shows.

Main Process

Explicit Allocations
536.22 MB (100.0%) -- explicit
├──217.45 MB (40.55%) -- window-objects
│  ├───91.55 MB (17.07%) -- top(https://mail.google.com/mail/u/0/#label/A-moz%2Fbugz/13d41da77907a707, id=16)/active
│  │   ├──61.18 MB (11.41%) -- window(https://mail.google.com/_/mail-static/_/js/main/m_i,t/rt=h/ver=sobKNxkH_hk.en./sv=1/am=!rsy2VLKefbT1RPF-0_JbQoI4nDfwRxdk-CbEiLu_TGxDGzw05OfUOUODZR_O2flp0CcdPg/d=1)
│  │   │  ├──56.29 MB (10.50%) -- js
│  │   │  │  ├──56.11 MB (10.46%) -- compartment(https://mail.google.com/_/mail-static/_/js/main/m_i,t/rt=h/ver=sobKNxkH_hk.en./sv=1/am=!rsy2VLKefbT1RPF-0_JbQoI4nDfwRxdk-CbEiLu_TGxDGzw05OfUOUODZR_O2flp0CcdPg/d=1)
│  │   │  │  │  ├──35.23 MB (06.57%) -- gc-heap
│  │   │  │  │  │  ├──18.17 MB (03.39%) -- objects
│  │   │  │  │  │  │  ├───9.88 MB (01.84%) ── dense-array
│  │   │  │  │  │  │  ├───6.08 MB (01.13%) ── ordinary
│  │   │  │  │  │  │  └───2.21 MB (00.41%) ++ (2 tiny)
│  │   │  │  │  │  ├──10.71 MB (02.00%) ++ (6 tiny)
│  │   │  │  │  │  └───6.35 MB (01.18%) ── unused-gc-things
│  │   │  │  │  ├──12.01 MB (02.24%) ++ (7 tiny)
│  │   │  │  │  └───8.86 MB (01.65%) ++ objects-extra
│  │   │  │  └───0.19 MB (00.04%) ++ compartment(https://mail.google.com/_/mail-static/_/js/main/m_i,t/rt=h/ver=sobKNxkH_hk.en./sv=1/am=!rsy2VLKefbT1RPF-0_JbQoI4nDfwRxdk-CbEiLu_TGxDGzw05OfUOUODZR_O2flp0CcdPg/d=1, about:blank)
│  │   │  └───4.89 MB (00.91%) ++ (4 tiny)

Accordingly, until now the preferred way of reporting about:memory’s data in bug reports has been to include a copy of the entire contents of about:memory?verbose.

This worked well when about:memory contained a few dozen lines.  But the level of detail in the underlying memory reporters has increased greatly since then.  This is a good thing — more data is helpful — but it means that a full about:memory?verbose is now typically thousands of lines.  When viewing the data directly in about:memory?verbose this isn’t a problem, because you can easily collapse and expand sub-trees to focus on the interesting parts.  However, when reading pasted data as text, it’s overwhelming, even for experts.

New: Gzipped JSON

With the landing of bug 848560, about:memory can now import and export memory reports as gzipped JSON.  Use the “Write reports to a file” and “Read reports from a file” buttons at the bottom of about:memory.  (Note: the UI will likely change soon, but not substantively.)

(The JSON schema is documented in a comment near the top of xpcom/base/nsIMemoryInfoDumper.idl, for those who are interested.)

This is now the preferred format for attaching memory report data to bug reports.  It has two important advantages over text.

  • When you load one of these files into about:memory, you can do the aforementioned collapsing and expanding of sub-trees.
  • If you have two of these files, you can diff them using toolkit/components/aboutmemory/tools/diff-memory-reports.js.  (For the moment you’ll have to ungzip both files first, which is stupid.  Hopefully this’ll be fixed soon.)

The ability to compute memory report diffs will be extremely useful for diagnosing cases where Firefox’s memory consumption increases unexpectedly.  (There are already two bugs that are waiting on this feature for a better diagnosis.)

There is a bug open to implement a “Load reports from URL” feature in about:memory, which will make the viewing memory reports attached to bugs even easier.  It’s currently unassigned;  please email me or comment in the bug if you are interested in implementing it.

Finally, although the gzipped JSON format is now the preferred format for transferring the full memory report data, copy and paste is still useful for communicating snippets of about:memory’s contents.  Support for it won’t be disappearing.

Categories
about:memory Fennec Firefox Memory consumption MemShrink

MemShrink progress, week 93–94

After lots of activity in the previous month, the past two weeks have been fairly quiet for MemShrink.

AWSY

areweslimyet.com has been proving its worth.

Jonathan Kew reduced the amount of memory taken by fonts on Fennec at start-up, which was detected by AWSY/mobile.  Jonathan also reverted a change that AWSY detected as increasing Fennec memory consumption, and filed a follow-up to investigate further.

Joe Drew fixed a bad regression on AWSY relating to image decoding.  It’s not clear to me if this was a genuine regression that users would have seen, or if it was an artifact of the way AWSY does its measurements.  Either way, it’s good that it was fixed, and props to Joe for doing it so quickly.

Finally, we closed bug 833518, which was for an AWSY regression caused by the new DOM bindings.  This was previously improved by an Aurora-only hack, but enough cases have been translated to the new bindings that we’re naturally down almost to where we were.

Miscellaneous

The mobile team abandoned their goal of making Fennec work on phones with only 256 MiB of memory.  The rationale is that Android phones with only 256 MiB of RAM are uncommon, whereas low-end phones that meet the current minimum of 384 MiB are much more common.  The mobile team will of course continue to look for ways to improve memory consumption in order to make life for users with 384 MiB phones.

I modified the JS engine so that it doesn’t emit bytecode for asm.js functions in the normal case.  This reduced the memory consumption of the Unreal 3 demo used at GDC by about 100 MiB.  I also added a memory reporter for array buffers used by asm.js, which are often quite large and weren’t being measured on 64-bit platforms.

Alexandre Poirot fixed a leak relating to dev tools.

Randell Jesup fixed a small leak in WebRTC.

Help Needed

I’m working on adding a button to about:memory trigger the dumping of memory reporter data to file.  I have a patch awaiting review, but I’m getting a test failure on Windows.  The test saves gzipped memory reports to file, and then immediately loads that saved file (and uncompresses it) and checks the data looks as expected.  This works fine on Mac and Linux, but on Windows I’m sometimes getting incomplete data in the load step.  The file is quite short (just 253 bytes compressed, and 620 bytes uncompressed) and the truncation point varies between runs;  in the most severe occurrence only 9 bytes of uncompressed data were loaded, though the cut-off point seems to vary randomly.

I suspect there’s a file synchronization problem between the save and the load, even though gzclose() is called on the save file before the loading occurs.  If anyone has ideas about what the problem might be, I’d love to hear them.

Update: Nils Maier and an anonymous commenter pointed out the problem — I was using “r” instead of “rb” for the file mode.  On Windows, this causes mangling of EOL chars.

Also, we’re seeing some strange behaviour on Mac OS X where memory managed by jemalloc doesn’t appear to be released back to the OS as it should.  This is both alarming and hard to understand, which is not a good combination.

Good First Bugs

I have two easy bugs assigned to me that I probably won’t get around to for some time.  Both of them would be good first (or second, or third…) bugs.

  • Bug 857382 is about making about:memory handle memory report diffs more elegantly.
  • Bug 798914 is just a minor code clean-up.  Nothing too exciting, but first bugs often aren’t!

Please email or comment in one of the bugs if you are interested in helping.

Bug Counts

Here are the current bug counts.

  • P1: 15 (-0/+2)
  • P2: 138 (-4/+8)
  • P3: 129 (-2/+7)
  • Unprioritized: 1 (-3/+0)
Categories
about:memory B2G Firefox Memory consumption MemShrink

MemShrink progress, week 83–84

Fixed

Justin Lebar made it so that memory reports could be collected on production B2G phones (i.e. not just developer phones with root access).  This was a MemShrink:P1, because getting these reports is crucial.

Gregor Wagner tuned the GC heuristics used by workers.  This is important for B2G, which uses workers extensively.

Andrew McCreight fixed a leak involving audio contexts.

I added a memory reporter for event targets, which includes XHRs.  This can measure multiple MiB of memory when running Gmail.

I added a memory reporter for data held by the JS engine’s regexp JIT compiler.  It usually measures insignificant amounts.

I fixed an inaccuracy in the “resident” memory report tree, which is visible in about:memory when running on Linux, which was caused by a change in recent kernels.

AWSY

The recent results on AWSY have been ugly.  There were two bad regressions in December, as the following graph makes clear.

areweslimyet.com, december 2012

John Schoenick did some work to improve AWSY to make regression hunting easier, and as a result we finally know which changes caused these regressions.

  • A refactoring of images code caused the bigger regression, on December 18.  Seth Fowler is looking into this.
  • Two changes relating to the new DOM bindings caused the smaller regression on December 11/12.  This is largely because many more JS getter/setter functions are present.  It’s not clear yet how to win back this memory, though it should be possible to turn these changes off in the short-term.

These regressions have made it to the Aurora branch, which means there is some urgency now to either fix them or back out/disable them soon.  We don’t want them to reach Beta.

Bug Counts

Here are the current bug counts.

  • P1: 21 (-1/+7)
  • P2: 125 (-2/+11)
  • P3: 104 (-1/+3)
  • Unprioritized: 4 (-17/+3)

The changes are larger than usual because we had a big log of untriaged bugs to go through, due to the six week break since the last MemShrink meeting.

Categories
about:memory B2G DMD Fennec Firefox Memory consumption MemShrink

MemShrink progress, week 79–82

I skipped the last MemShrink report due to Christmas, so we have four weeks’ worth of bug fixes today.

LEAKS

Joe Walker fixed a bad leak found by Jesse Ruderman:  if you closed a browser window with the developer toolbar open it would leak “everything”.  This was a MemShrink P1 bug.

Anton Kovalyov fixed a leak involving scratchpad.  This bug was also found by Jesse Ruderman.

Randell Jesup fixed some WebRTC leaks.

John Schoenick fixed a leak involving plugins.

Josh Aas fixed a leak in some networking code.

DMD

I wrote a more detailed blog post about DMD.  Here is the take-away message.

about:memory is MemShrink’s not-so-secret weapon when it comes to understanding Firefox’s memory consumption… and DMD is how we make about:memory better.

Lots of under-the-hood improvements have been made to DMD since I wrote that.  Users on Mac, Linux and B2G who aren’t afraid of doing their own builds should try it out.  Also, Ehsan Akhgari got it to build on Windows, though it’s not yet clear how well it works on that platform.  If anyone wants to try it out, please let me know how it goes.

Memory Reporters

Ben Turner made the workers memory reporter be able to handle workers that use ctypes.  This was important, especially on B2G, because each process can have one or two or more such workers — this is for Firefox chrome stuff, not web content — and we weren’t measuring them at all, and they can take multiple MiB each.

I fixed the orphan DOM node memory reporter.  The introduction of WebIDL had changed the layout of some paired JS/DOM objects, and such objects weren’t being reported.  (DMD discovered the unreported memory, and Boris Zbarsky helped me interpret what it meant.)  I see this accounting for multiple MiB of orphan nodes when using Gmail.

I added a memory reporter for the event listenener manager’s hash table.  It starts off small, but I’ve seen it go as high as 1.5 MiB after lots of browsing.  (DMD helped me identify this too.)

Kartikaya Gupta added a memory reporter for graphics textures on Android.

I added a memory reporter for any ctypes data that is hanging off JS objects.  I added it because one DMD profile on B2G showed non-trivial amounts of ctypes data, but that seems to have been a fluke and it rarely shows much memory now.  Oh well.

Miscellaneous

Andrew McCreight improved CC shutdown logging, which will make it easier to identify shutdown leaks.

Rail Aliiev and Kartikaya Gupta enabled a new NDK for Fennec builds on releng machines.  This might result in smaller binary sizes, which saves memory.

Bug Counts

Here are the current bug counts.

  • P1: 15 (-2/+0)
  • P2: 116 (-10/+0)
  • P3: 102 (-4/+0)
  • Unprioritized: 18 (-0/+18)

The number of unprioritized bugs is high because we didn’t have a MemShrink meeting this week.  This was because Justin Lebar and Kyle Huey are in Berlin for the B2G work week.  We’ll have our next meeting two weeks from today.