Categories
about:compartments about:memory add-ons Firefox Garbage Collection Memory consumption MemShrink Performance

MemShrink progress, week 51-52

Memory Reporting

Nathan Froyd added much more detail to the DOM and layout memory reporters, as the following example shows.

├──3,268,944 B (03.76%) -- window(http://www.reddit.com/)
│  ├──1,419,280 B (01.63%) -- layout
│  │  ├────403,904 B (00.46%) ── style-sets
│  │  ├────285,856 B (00.33%) -- frames
│  │  │    ├───90,000 B (00.10%) ── nsInlineFrame
│  │  │    ├───72,656 B (00.08%) ── nsBlockFrame
│  │  │    ├───62,496 B (00.07%) ── nsTextFrame
│  │  │    ├───42,672 B (00.05%) ── nsHTMLScrollFrame
│  │  │    └───18,032 B (00.02%) ── sundries
│  │  ├────259,392 B (00.30%) ── pres-shell
│  │  ├────168,480 B (00.19%) ── style-contexts
│  │  ├────160,176 B (00.18%) ── pres-contexts
│  │  ├─────55,424 B (00.06%) ── text-runs
│  │  ├─────45,792 B (00.05%) ── rule-nodes
│  │  └─────40,256 B (00.05%) ── line-boxes
│  ├────986,240 B (01.13%) -- dom
│  │    ├──780,056 B (00.90%) ── element-nodes
│  │    ├──156,184 B (00.18%) ── text-nodes
│  │    ├───39,936 B (00.05%) ── other [2]
│  │    └───10,064 B (00.01%) ── comment-nodes
│  └────863,424 B (00.99%) ── style-sheets

Although these changes slightly improved the coverage of the reporters (i.e. they reduce “heap-unclassified” a bit), the more important effect is that they give greater insight into DOM and layout memory consumption.  [Update:  Nathan blogged about these changes.]

I modified the memory reporter infrastructure and about:memory to allow trees of measurements to be shown in the “Other Measurements” section of about:memory.  The following excerpt shows two sets of measurements that were previously shown in a flat list.

108 (100.0%) -- js-compartments
├──102 (94.44%) ── system
└────6 (05.56%) ── user

3,900,832 B (100.0%) -- window-objects
├──2,047,712 B (52.49%) -- layout
│  ├──1,436,464 B (36.82%) ── style-sets
│  ├────402,056 B (10.31%) ── pres-shell
│  ├────100,440 B (02.57%) ── rule-nodes
│  ├─────62,400 B (01.60%) ── style-contexts
│  ├─────30,464 B (00.78%) ── pres-contexts
│  ├─────10,400 B (00.27%) ── frames
│  ├──────2,816 B (00.07%) ── line-boxes
│  └──────2,672 B (00.07%) ── text-runs
├──1,399,904 B (35.89%) ── style-sheets
└────453,216 B (11.62%) -- dom
     ├──319,648 B (08.19%) ── element-nodes
     ├──123,088 B (03.16%) ── other
     ├────8,880 B (00.23%) ── text-nodes
     ├────1,600 B (00.04%) ── comment-nodes
     └────────0 B (00.00%) ── cdata-nodes

This change improves the presentation of measurements that cross-cut those in the “explicit” tree.  I intend to modify a number of the JS engine memory reports to take advantage of this change.

One interesting bug was this one, where various people were seeing multiple compartments for the same site in about:compartments, as the following excerpt shows.

https://bugzilla.mozilla.org/
https://bugzilla.mozilla.org/, about:blank

It turns out this is not a bug.  The sites in question contain an empty iframe that doesn’t specify a URL, and so the memory reporters are doing exactly the right thing.  Still, a useful case to know about when reading about:compartments.

Add-ons

Justin Lebar fixed the FUEL API, which is used by numerous add-ons including Test Pilot and PDF.js, so that it doesn’t leak most of the objects it creates.  This leak caused 10+ minute shut-down times(!) for one user, so it’s a good one to have fixed.

Kyle Huey briefly broke his own Hueyfix, and then fixed it.  You had us worried for a bit there, Kyle!

asgerklasker fixed a leak in the HttpFox add-on that caused zombie compartments.

Miscellaneous

I restricted the amount of context that is shown in JavaScript error messages.  This fixed a longstanding bug where if you had enabled the javascript.options.strict option in about:config, and you had the error console open or Firebug installed, memory consumption would spike dramatically when viewing pages that contain JavaScript code that triggered many strict warnings.  This bug manifested rarely, but would bring Firefox to its knees when it did.

Asaf Romano fixed a leak that caused a zombie compartment if you used the “Highlight All” checkbox when doing a text search in a page.

Mike Hommey finished importing the new version of jemalloc into the Mozilla codebase, and then wrote about it.  The new version is currently disabled, but we hope to turn it on soon.  Preliminary experiments indicate that the new version is unlikely to affect performance or memory consumption much.  However, it will be good to be on a version that is in sync with the upstream version, instead of having a highly hacked Mozilla-specific version.

Justin Lebar wrote a nice blog post explaining what “ghost windows” are, and how we’ve used them to gauge some recent leak fixes.

Till Schneidereit fixed a garbage collection defect that could cause memory usage to spike in certain cases involving Firefox Sync.

LifeHacker published a new browser performance comparison which looked at Firefox 13, Chrome 19, IE9, and Opera 11.64.  Firefox did the best overall and also won both the memory consumption tests.  I personally take these kinds of comparisons with a huge bucket of salt.  Indeed, quoting from the article:

Our tests aren’t the most scientific on the planet, but they do reflect a relatively accurate view of the kind of experience you’d get from each browser, speed-wise.

If you ask me, the text before the “but” contradicts the rest of the sentence.  What I found more interesting was the distinct lack of “lolwut everyone knows Chrome is faster than Firefox” comments, which I’m used to seeing when Firefox does well in these kinds of articles.

Bug Counts

Here are the current bug counts.

  • P1: 25 (-1/+3)
  • P2: 88 (-3/+6)
  • P3: 106 (-0/+4)
  • Unprioritized: 2 (-2/+2)

Nothing too exciting there.

Categories
about:memory add-ons Firefox Garbage Collection Memory consumption MemShrink

MemShrink progress, week 37

It’s been a huge week for MemShrink.

Add-ons

I filed a bug on testing the top 100 add-ons for memory leaks.  The majority of these add-ons are not available on AMO and so are not subject to the leak checking done during AMO reviews.  The instructions and current test results are here.  Randell Jesup helped identify some some add-ons with unclear identities, and Nils Maier and Archaeopteryx have both tested several add-ons.  A month ago I said that add-ons that leak are the #1 problem for MemShrink, and this bug represents a huge step towards reducing that problem.  We’ll need lots of additional help to test this many add-ons, so please feel free to jump in!

As far as I know, comprehensive testing of the most popular add-ons has never been done before.  Although this testing is aimed at finding memory leaks, it’s quite possible it will uncover various other problems with add-ons.  Indeed, it’s clear just from looking at the list that quite a few of the non-AMO add-ons are of dubious merit, and this has stimulated some interesting discussion on dev-platform about third-party add-ons, i.e. those that are installed into Firefox by an external program.

The following add-ons had leaks fixed or mostly fixed by their authors: McAfee Site Advisor, Ghostery, Spool, Screengrab (fix version), Roboform, UF Comment Board ToolsGeenstijl, Long URL Please, HTML Desktop Notifications.

Nils Maier greatly improved the documentation on common causes of memory leaks in add-ons.  This was a MemShrink:P1 bug.  That doesn’t mean the document can’t be improved further, however;  it’s a wiki so please continue to add to it if you can.

Regression testing

John Schoenick’s excellent areweslimyet.com is getting close to being ready for a public unveiling.  The site is currently live but password-protected, simply to prevent large numbers of people accessing it before it’s ready.  (If you want a sneak peek, contact me for the password.)  More importantly, it identified a large regression in memory consumption caused by the landing of the JS engine’s incremental garbage collector on February 19, which Bill McCloskey is investigating.

Tim Taubert improved Firefox’s regression testing to ensure that no new DocShell and DOMWindow leaks are introduced.  This was a MemShrink:P1 bug because these leaks are quite easy to introduce.  Tim wrote some more about this change here.

Cycle collector

Jan Honza Odvarko’s about:ccdump add-on made it onto AMO this week.  Jan has been using this to hunt down some tricky leaks in Firebug.

Marco Bonardo fixed a leak in PlacesUtils.removeLazyBookmarkObserver() that I won’t pretend to understand, but which was a MemShrink:P1.  Marco also fixed a leak that occurred after bookmarking a page, closing the window, and opening a new window.

Olli Pettay fixed an equally impenetrable (to me) leak involving nsFormFillController::mFocusedInput.

Kyle Huey fixed a leak in the About Firefox dialog.

Andrew McCreight added additional information to cycle collector’s error console logging, which helps with identifying and debugging cycle collector problems.

Miscellaneous

Jason Duell fixed an obscure leak involve web sockets.

Bill McCloskey fixed a minor JS engine leak.

I added a new memory reporter called “js/runtime/gc-marker”.  It starts out at 256KB and I saw it reach 2.8MB when running MemBench.  I also converted the existing source image reporters to the new style, which seems to haved fixed some bogus results in about:memory as a side-effect.

Quote of the week

Adam Overa of Tom’s Hardware did another browser Grand Prix.  Devin Coldewey used the results from the Grand Prix to conclude that Firefox and Chrome are both great, and which you prefer basically comes down to a matter of taste.  While that is an interesting conclusion, what caught my eye was this comment, by Balaji Viswanathan:

I guess the title could have been “All browsers suck equally bad now”. Firefox and Chrome have grown to become more resources hogs – closer to IE. These days I shudder to fire up the firefox as the memory leaks are terrible. Two hours of Firefox with a Facebook tab is enough to gobble up 25% of my memory. With Chrome, I would have 20 rendering processes showing up when I would have just 3 tabs open.

In the first 2 years of Chrome I had probably 2 or 3 crashes. These days, it crashes every week or so. I long for the 2006 era Firefox – clean, simple and lean. Its been a long time since I have used IE actively and with Safari lesser said the better. For the developers, we have to deal with the ultra slow update cycles of IE and ultraspeed update cycles of Chrome. In short, we are getting worse and worse in the browser arena. The market is ripe for a breakthrough.

“2006 era Firefox” would have been Firefox 1.5 or Firefox 2.  Balaji may think he’s nostalgic for browsers of that era, but really he’s nostalgic for the web of that era, which was massively simpler than the web of today.  If Balaji tried Firefox 1.5 or Firefox 2 today — with no HTML5 support, no JavaScript JIT and no hardware acceleration — today, I’m sure he’d quickly decide that 2012-era browsers aren’t so bad after all.  I guess the interesting question is this: why do people blame browsers instead of websites for high resource consumption?

Bug counts

This week’s bug counts:

  • P1: 28 (-5/+5)
  • P2: 129 (-12/+7)
  • P3: 83 (-8/+12)
  • Unprioritized: 2 (-2/+2)

That’s a net reduction of one bug.  But more importantly, there is lots of movement, which is great!  It means that problems are being identified and fixed.

(Finally, commenters please note that I’ve turned on the WP-reCAPTCHA plug-in, and this the first post I’ve written since doing so.  In my testing it’s worked fairly well.  Hopefully it won’t cause problems.)

Categories
about:memory AdBlock Plus add-ons Firefox Garbage Collection Memory consumption MemShrink

MemShrink progress, week 32

There wasn’t much MemShrink activity this week in terms of bugs fixed, just bug 718100 and bug 720359.  So I’m going to take the opportunity this week to talk about the bigger picture.

Bug Counts

As a prelude, here are this week’s bug counts.

  • P1: 20 (-4/+0)
  • P2: 131 (-3/+3)
  • P3: 74 (-2/+7)
  • Unprioritized: 4 (-3/+4)

The drop in P1s was just due to bug re-classification;  in particular, three bugs relating to long cycle collector pauses were un-MemShrink’d because they are more about responsiveness, and they are being tracked by Project Snappy.

The Big Ticket Items

David Mandelin asked me today what where the big ticket items for MemShrink.  I’d been looking a lot at the MemShrink:P1 list recently (which is why some were re-classified) and so I was able to break it down into six main areas that cover most of the P1s and various P2s.  I’ll list these from what I think is least important to most important.

#6: Better Script Handling

Internally, a JSScript represents (more or less) the code of a JS function, including things like the internal bytecode that SpiderMonkey generates for it.  The memory used by JSScripts is measured by the “gc-heap/scripts” and “script-data” entries in about:memory.

Luke Wagner did some measurements that showed that most (70–80%) JSScripts created in the browser are never run.  In hindsight, this isn’t so surprising — many websites load libraries like jQuery but only use a fraction of the functions in those libraries.  If SpiderMonkey could be changed to generate bytecode for scripts lazily, it could reduce “script-data” memory usage by 60–70%.  This would also allow the decompiler to be removed, which would be great.

Luke also proposed sharing immutable parts of scripts between web pages.  This would avoid a lot of duplication in the case where you have many tabs open with pages from a single site.

Both of these changes potentially will make the browser faster as well, because SpiderMonkey will spend less time compiling JavaScript source code to bytecode.

No-one is assigned to work on these bugs.  The lazy script creation can be done entirely within the JS engine;  the script sharing requires assistance from Necko.  Luke is currently busy with some other righteous refactorings, but I’m quietly hoping once they’re done he might find time for one or both of these bugs.

#5: Better Memory Reporting

Before you can reduce memory consumption you have to measure it.  about:memory is the critical tool that has facilitated much of MemShrink’s work.  (For example, we never would have known about zombie compartments without it.)  It’s in pretty good shape now but there are two major improvements that can be made.

First, the “heap-unclassified” number (a.k.a “dark matter”) is still typically around 20–25%.  My goal is to reduce that to 10%. This won’t require any great new insights, we already have the tools and data required.  Rather, it’s just a matter of grinding through the list of memory reporters that need to be added and improved.

Second, the resources used by each browser tab are reported in an unwieldy fashion:  JS memory on a per-compartment basis;  layout memory on a per-docshell basis;  DOM memory on a per-window basis.  Only a few internal architectural changes stand in the way of uniting these to provide the oft-requested feature of per-tab memory reporting.  This will be great for users, because if Firefox is using more memory than they’d like, it tells them which tabs they should close in order to free up memory.

I am actively working on both these improvements, and I’m hoping that within a couple of months they’ll be mostly done.

#4: Better Memory Consumption Tracking

One thing we haven’t done well in MemShrink is to improve the state of tracking Firefox’s memory consumption.  We have plenty of anecdotes but not much hard data about the improvements we’ve made, and we don’t have good ways to detect any regressions.  A couple of ideas haven’t gone very far, but some good news is that John Schoenick is making great progress on a proper areweslimyet.com implementation.  John has demonstrated preliminary versions of the site at two MemShrink meetings and it’s looking very promising.  It uses the endurance test framework to make the measurements, and opens lots of pages from the Talos tp5 pageset.

We also hope to use telemetry data to analyze how the memory consumption of each released version of Firefox stacks up.  That analysis would come with a significant delay — weeks or months after each release — but it would be much more comprehensive than any oft-run benchmark, coming from the real-world usage patterns of thousands of users.

#3: Compacting Generational GC

If you look in about:memory, JavaScript memory usage usually dominates.  In particular, the “js-gc-heap” is usually large.  There’s also the “js-gc-heap-unused-fraction” number, often 30% or higher, which tells you how much of that space is unused because of fragmentation.  That percentage overstates things somewhat, because often a good proportion of that unused space (see “js-gc-heap-decommitted”) is decommitted, which means that it’s costing nothing but address space… but that is cold comfort if you’re suffering out-of-memory aborts on Windows due to virtual memory exhaustion.

A compacting garbage collector is one that can move objects around the heap, filling up all those little gaps that constitute fragmentation.  The JS team (especially Bill McCloskey and Terrence Cole) is implementing a compacting generational garbage collector, which is a particular kind that tends to have good performance.  In particular, many objects die young and generational collectors find these quickly, which means that the heap will grow at a significantly slower rate than it currently does.  I could be wrong, but I’m convinced this will be a big win for both memory consumption and speed.

#2: Better Foreground Tab Image Handling

Images are stored in a compressed format (e.g. JPEG, PNG, GIF) on disk.  In order to display them, a browser must decompress (a.k.a decode) the compressed form into a raw pixel form that can easily be ten times larger.  This decoded form can be discarded and regenerated as necessary, and there are trade-offs to be made — for example, if you are too aggressive in discarding decoded images, you might have to decode them again, which will take CPU cycles and the user might see flickering if the decoding occurs in the visible part of the page.

However, Firefox goes way too far in the other direction.  If you open a page in the foreground tab, every single image in that page will be immediately decoded, and none of the decoded data will be discarded unless you switch away to another tab.  For pages that contain many images, this is a recipe for horrific memory consumption, and Firefox does much worse than all the other browsers.  So this is a problem that doesn’t rear its head for all users, but it’s terrible for those that are affected.

There are three MemShrink:P1 bugs relating to this:  one about not decoding all images immediately, one about discarding non-visible decoded images after some time, and one about some infrastructure work that is required for the first two.  As far as I know, no progress has been made on these three bugs, and although two of them are assigned they are not being actively worked on.

(See this discussion on the dev-platform mailing list for more details about this topic.)

#1: Better Detection and Notification of Leaky Add-ons

It’s been the case for several months that when a user complains about Firefox consuming an excessive amount of memory, it’s usually because of one or more add-ons, and the “can you try that again in safe mode?” / “oh yeah, that fixes it” dance is getting tiresome.

Many add-ons leak.  Even popular, well-written ones:  in the past few months leaks have been found in Adblock Plus, Video DownloadHelper, GreaseMonkey and Firebug.  That’s four of the top five add-ons on AMO!  We’re now getting several reports about leaky add-ons a week;  in this week’s MemShrink meeting there were four:  TorButton, NoSquint, Customize Your Web, and 1Password.  I strongly suspect the leaks we know about are just the tip of the iceberg.

Although leaks in add-ons are not Mozilla’s fault, they are Mozilla’s problem:  Firefox gets blamed for the sins of its add-ons.  And it’s not just memory consumption;  the story is the same for performance in general.  Here’s the quote of the week, from a user of 1Password:

I only use a handful of extensions and honestly never suspected 1P, however after disabling it I noticed my FireFox performance increased very noticibly. I’ve been running for 48 hours now without the 1P extension in Firefox and wow what a difference. Browsing is faster, switching is faster, memory usage is way down.

I’ve lost count of the number of stories like this that I’ve heard.  How many users have we lost to Chrome because of these issues, I wonder?

(And it’s not just leaks.  See this analysis of 16 add-ons and their effect on memory consumption when Firefox starts.)

One small step towards improving this situation was made this week:  Jorge Villalobos and Andrew Williamson added a “check for memory leaks” item to the AMO review checklist (under “Memory leaks from content”).  And Kris Maglione added some support for this checking in his Extension Test add-on.  This means that add-ons with obvious memory leaks (and many of them are obvious if you are actively looking for them) will not be accepted by AMO.

So that will prevents leaks in some new add-ons and new versions of established add-ons.  What about existing add-ons?  One idea is that AMO could also have a flag that indicates add-ons that have known memory problems (and other performance problems).  (This flag wouldn’t be an automatic thing, it would only be set once a leak has been confirmed, and after giving the author notification and some time to fix the problem.)  So that would also improve things a bit.

But lots of add-ons aren’t hosted on AMO.  Another idea is to have a stronger mechanism, one that informs the user if they have any add-ons installed that are known to cause high memory consumption (or other bad performance problems).  There is an existing mechanism for blocking add-ons that are known to be malware or exceptionally crashy, so hopefully the warnings could piggy-back on top of that.

Then, we need a better way to detect leaky add-ons.  Currently this is entirely done manually — and a couple of excellent contributors have found leaks on multiple add-ons — but I’m hoping that it’ll be possible to do a much more thorough job by analyzing telemetry data to find out which add-ons are correlated with high memory consumption.  That information could be used to trigger manual checking.

Finally, once you know an add-on leaks, it’s not always easy to work out why.  Tools could help a lot here, if they can be made to work well.

Conclusion

I listed six big areas for improvement. If we fixed all of these I think we’d be in a fantastic position.

Three of them (#5 better memory reporting, #4 better memory consumption tracking, #3 compacting generational GC) have people working on them and are in a good state.

Three of them (#6 better script handling, #2 better foreground image tab handling, #1 better detection and notification of leaky add-ons) don’t have people working on them, as far as I know.  If you are willing and have the skills to contribute to any of these areas, please contact me!

And if you think I’ve overestimated or underestimated the importance of any issue, I’d love to hear about it.  Thanks!
Categories
about:memory AdBlock Plus add-ons compartments DMD Firefox Garbage Collection JägerMonkey Massif Memory allocation Memory consumption MemShrink Performance SQLite Talks Valgrind

Notes on Reducing Firefox’s Memory Consumption

I gave a talk yesterday at the linux.conf.au Browser MiniConf, held in Ballarat, Australia.  Its title was “Notes On Reducing Firefox’s Memory Consumption”.

Below are the slides and notes in a SlideShare embedding. If you find that embedding problematic (some people do) you may prefer to download the PDF version directly.

Categories
about:memory Firefox Garbage Collection Memory consumption MemShrink SQLite

MemShrink progress, week 21

MemShrink:P1 Bugs fixed

Terrence Cole made a change that allows unused arenas in the JS heap to be decommitted, which means they more or less don’t cost anything.  This helps reduce the cost of JS heap fragmentation, which is a good short-term step while we are waiting for a compacting garbage collector to be implemented.  Terrence followed it up by making the JS garbage collector do more aggressive collections when many decommitted arenas are present.

Justin Lebar enabled jemalloc on MacOS 10.7.  This means that jemalloc is finally used on all supported versions of our major OSes: Windows, Mac, Linux and Android.  Having a common heap allocator across these platforms is great for consistency of testing and behaviour, and makes future improvements involving jemalloc easier.

Gabor Krizsanits created a new API in the add-on SDK that allows multiple sandboxes to be put into the same JS compartment.

Other Bugs Fixed

I registered jemalloc with SQLite’s pluggable allocator interface.  This had two benefits.  First, it means that SQLite no longer needs to store the size of each allocation next to the allocation itself, avoiding some clownshoes allocations that wasted space.  This reduces SQLite’s total memory usage by a few percent.  Second, it makes the SQLite numbers in about:memory 100% accurate;  previously SQLite was under-reporting its memory usage, sometimes significantly.

Relatedly, Marco Bonardo made three changes (here, here and here) that reduce the amount of memory used by the Places database.

Peter Van der Beken fixed a cycle collector leak.

I tweaked the JavaScript type inference memory reporters to provide better coverage.

Jiten increased the amount of stuff that is released on memory pressure events, which are triggered when Firefox on Android moves to the background.

Finally, I created a meta-bug for tracking add-ons that are known to have memory leaks.

Bug Counts

I accidentally deleted my record of the live bugs from last week, so I don’t have the +/- numbers for each priority this week.

  • P1: 29 (last week: 35)
  • P2: 126 (last week: 116)
  • P3: 59 (last week: 55)
  • Unprioritized: 0 (last week: 5)

The P1 result was great this week — six fewer than last week.  Three of those were fixed, and three of those I downgraded to P2 because they’d been partially  addressed.

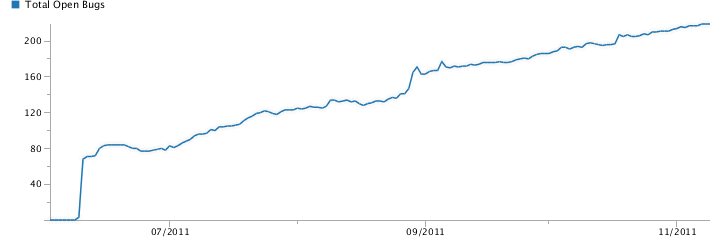
For a longer view of things, here is a graph showing the MemShrink bug count since the project started in early June.

memshrink bug count

There was an early spike as many existing bugs were tagged with “MemShrink”, and a smaller spike in the middle when Marco Castellucio tagged a big pile of older bugs.  Other than that, the count has marched steadily upward at the rate of about six per week.  Many bugs are being fixed and definite improvements are being made, but this upward trend has been concerning me.

Future Directions

So in today’s MemShrink meeting we spent some time discussing future directions of MemShrink.  Should we continue as is?  Should we change our focus, e.g. by concentrating more on mobile, or setting some specific targets?

The discussion was long and wide-ranging and not easy to summarize.  One topic was “what is the purpose of MemShrink?”  The point being that memory usage is really a secondary measure.  By and large, people don’t really care how many MB of memory Firefox is using;  they care how responsive it is, and it’s just assumed that reducing memory usage will help with that.  With that in mind, I’ll attempt to paraphrase and extrapolate some goals (apologies if I’ve misrepresented people’s opinions).

  • On 64-bit desktop, the primary goal is that Firefox’s performance should not degrade after using it heavily (e.g. many tabs) for a long time.  This means it shouldn’t page excessively, and that operations like garbage collection and cycle collection shouldn’t get slower and slower.
  • On mobile, the primary goal probably is to reduce actual memory usage.  This is because usage on mobile tends to be lighter (e.g. not many tabs) so the longer term issues are less important.  However, Firefox will typically be killed by the OS if it takes up too much memory.
  • On 32-bit desktop, both goals are relevant.

As for how these goals would change our process, it’s not entirely clear.  For desktop, it would be great to have a benchmark that simulates a lot of browsing (opening and closing many sites and interacting with them in non-trivial ways).  At the end we could measure various things, such a memory usage, garbage and cycle collection time, and we could set targets to reduce those.  For mobile, the current MemShrink process probably doesn’t need to change that much, though more profiling on mobile devices would be good.

Personally, I’ve been spreading myself thinly over a lot of MemShrink bugs.  In particular, I try to push them along and not let them stall by doing things like trying to reproduce them, asking questions, etc.  I’ve been feeling lately like it would be a better use of my time to do less of that and instead dig deeply into a particular area.  I thought about working on making JS script compilation lazy, but now I’ve decided instead to focus primarily on improving the measurements in about:memory, in particular, reducing the size of “heap-unclassified” by improving existing memory reporters and adding new ones. I’ve decided this because it’s an area where I have expertise, clear ideas on how to make progress, and tools to help me.  Plus it’s important;  we can’t make improvements without measurements, and about:memory is the best memory measurement tool we have.  Hopefully other people agree that this is important to work on 🙂

Categories
about:memory Firefox Garbage Collection JägerMonkey Memory consumption MemShrink Tracemonkey

SpiderMonkey is on a diet

One thing I’ve learnt while working for Mozilla is that a web browser can be characterized as a JavaScript execution environment that happens to have some multimedia capabilities.  In particular, if you look at Firefox’s about:memory page, the JS engine is very often the component responsible for consuming the most memory.

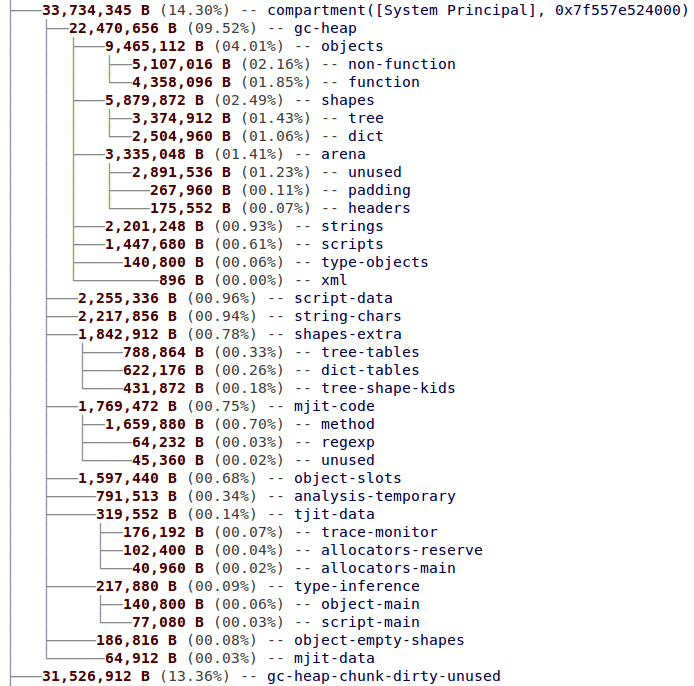
Consider the following snapshot from about:memory of the memory used by a single JavaScript compartment.

about:memory snapshot

(For those of you who have looked at about:memory before, some of those entries may look unfamiliar, because I landed a patch to refine the JS memory reporters late last week.)

There is work underway to reduce many of the entries in that snapshot.  SpiderMonkey is on a diet.

Objects

Objects are the primary data structure used in JS programs;  after all, it is an object-oriented language.  Inside SpiderMonkey, each object is represented by a JSObject, which holds basic information, and possibly a slots array, which holds the object’s properties. The memory consumption for all JSObjects is measured by the “gc-heap/objects/non-function” and “gc-heap/objects/function” entries in about:memory, and the slots arrays are measured by the “object-slots” entries.

The size of a non-function JSObject is currently 40 bytes on 32-bit platforms and 72 bytes on 64-bit platforms.  Brian Hackett is working to reduce that to 16 bytes and 32 bytes respectively. Function JSObjects are a little larger, being (internally) a sub-class of JSObject called JSFunction.  JSFunctions will therefore benefit from the shrinking of JSObject, and Brian is slimming down the function-specific parts as well.  In fact, these changes are complete in the JaegerMonkey repository, and will likely be merged into mozilla-central early in the Firefox 11 development period.

As for the slots arrays, they are currently arrays of “fatvals” A fatval is a 64-bit internal representation that can hold any JS value — number, object, string, whatever.  (See here for details, scroll down to “Mozilla’s New JavaScript Value Representation”;  the original blog entry is apparently no longer available).  64-bits per entry is overkill if you know, for example, that you have an array full entirely of integers that could fit into 32 bits.  Luke Wagner and Brian Hackett have been discussing a specialized representation to take advantage of such cases.  Variations on this idea have been tried twice before and failed, but perhaps SpiderMonkey’s new type inference support will provide the right infrastructure for it to happen.

Shapes

There are a number of data structures within SpiderMonkey dedicated to making object property accesses fast.  The most important of these are Shapes.  Each Shape corresponds to a particular property that is present in one or more JS objects.  Furthermore, Shapes are linked into linear sequences called “shape lineages”, which describe object layouts.  Some shape lineages are shared and live in “property trees”.  Other shape lineages are unshared and belong to a single JS object;  these are “in dictionary mode”.

The “shapes/tree” and “shapes/dict” entries in about:memory measure the memory consumption for all Shapes.  Shapes of both kinds are the same size;  currently they are 40 bytes on 32-bit platforms and 64 bytes on 64-bit platforms.  But Brian Hackett has also been taking a hatchet to Shape, reducing them to 24 bytes and 40 bytes respectively.  This has required the creation of a new auxiliary BaseShape type, but there should be many fewer BaseShapes than there are Shapes.  This change will also increase the number of Shapes, but should result in a space saving overall.

SpiderMonkey often has to search shape lineages, and for lineages that are hot it creates an auxiliary hash table, called a “property table”, that makes lookups faster.  The “shapes-extra/tree-tables” and “shapes-extra/dict-tables” entries in about:memory measure these tables.  Last Friday I landed a patch that avoids building these tables if they only have a few items in them;  in that case a linear search is just as good.  This reduced the amount of memory consumed by property tables by about 20%.

I mentioned that many Shapes are in property trees.  These are N-ary trees, but most Shapes in them have zero or one child;  only a small fraction have more than that, but the maximum N can be hundreds or even thousands.  So there’s a long-standing space optimization where each shape contains (via a union) a single Shape pointer which is used if it has zero or one child.  But if the number of children increases to 2 or more, this is changed into a pointer to a hash table, which contains pointers to the N children.  Until recently, if a Shape had a child deleted and that reduced the number of children from 2 to 1, it wouldn’t be converted from the hash form back to the single-pointer.  I changed this last Friday.  I also reduced the minimum size of these hash tables from 16 to 4, which saves a lot of space because most of them only have 2 or 3 entries.  These two changes together reduced the size of the “shapes-extra/tree-shape-kids” entry in about:memory by roughly 30–50%.

Scripts

Internally, a JSScript represents (more or less) the code of a JS function, including things like the internal bytecode that SpiderMonkey generates for it.  The memory used by JSScripts is measured by the “gc-heap/scripts” and “script-data” entries in about:memory.

Luke Wagner did some measurements recently that showed that most (70–80%) JSScripts created in the browser are never run.  In hindsight, this isn’t so surprising — many websites load libraries like jQuery but only use a fraction of the functions in those libraries.  It wouldn’t be easy, but if SpiderMonkey could be changed to generate bytecode for scripts lazily, it could reduce “script-data” memory usage by 60–70%, as well as shaving non-trivial amounts of time when rendering pages.

Trace JIT

TraceMonkey is SpiderMonkey’s original JIT compiler, which was introduced in Firefox 3.5.  Its memory consumption is measured by the “tjit-*” entries in about:memory.

With the improvements that type inference made to JaegerMonkey, TraceMonkey simply isn’t needed any more.  Furthermore, it’s a big hairball that few if any JS team members will be sad to say goodbye to.  (js/src/jstracer.cpp alone is over 17,000 lines and over half a megabyte of code!)

TraceMonkey was turned off for web content JS code when type inference landed.  And then it was turned off for chrome code.  And now it is not even built by default.  (The about:memory snapshot above was from a build just before it was turned off.)  And it will be removed entirely early in the Firefox 11 development period.

As well as saving memory for trace JIT code and data (including the wasteful ballast hack required to avoid OOM crashes in Nanojit, ugh), removing all that code will significantly shrink the size of Firefox’s code.  David Anderson told me the binary of the standalone JS shell is about 0.5MB smaller with the trace JIT removed.

Method JIT

JaegerMonkey is SpiderMonkey’s second JIT compiler, which was introduced in Firefox 4.0.  Its memory consumption is measured by the “mjit-code/*” and “mjit-data” entries in about:memory.

JaegerMonkey generates a lot of code.  This situation will hopefully improve with the introduction of IonMonkey, which is SpiderMonkey’s third JIT compiler.  IonMonkey is still in early development and won’t be integrated for some time, but it should generate code that is not only much faster, but much smaller.

GC HEAP

There is a great deal of work being done on the JS garbage collector, by Bill McCloskey, Chris Leary, Terrence Cole, and others.  I’ll just point out two long-term goals that should reduce memory consumption significantly.

First, the JS heap currently has a great deal of wasted space due to fragmentation, i.e. intermingling of used and unused memory.  Once moving GC — i.e. the ability to move things on the heap — is implemented, it will pave the way for a compacting GC, which is one that can move live things that are intermingled with unused memory into contiguous chunks of memory.  This is a challenging goal, especially given Firefox’s high level of interaction between JS and C++ code (because moving C++ objects is not feasible), but one that could result in very large savings, greatly reducing the “gc-heap/arena/unused” and “gc-heap-chunk-*-unused” measurements in about:memory.

Second, a moving GC is a prerequisite for a generational GC, which allocates new things in a small chunk of memory called a “nursery”.  The nursery is garbage-collected frequently (this is cheap because it’s small), and objects in the nursery that survive a collection are promoted to a “tenured generation”.  Generational GC is a win because in practice the majority of things allocated die quickly and are not promoted to the tenured generation.  This means the heap will grow more slowly.

Is that all?

It’s all I can think of right now.  If I’ve missed anything, please add details in the comments.

There’s an incredible amount of work being done on SpiderMonkey at the moment, and a lot of it will help reduce Firefox’s memory consumption.  I can’t wait to see what SpiderMonkey looks like in 6 months!

Categories
Fennec Firefox Garbage Collection Memory consumption MemShrink

MemShrink progress, week 19

Good News

Peter Van der Beken fixed a leak caused by chrome code that injects a function into pages.  This was a MemShrink P1 bug.  The commentary in the bug is confusing, but this may have been affecting numerous add-ons including Firebug. (Bug 669730 is open for tracking leaks in Firebug;  it hasn’t yet been confirmed whether this fix has helped Firebug.)

Andrew McCreight rewrote JS_DumpHeap so that it dumps the complete JS object graph.  This was a MemShrink P1 bug because it’s an important piece of infrastructure for writing leak detection tools.

Justin Lebar fixed the measurement of RSS on Mac.  This was a MemShrink P1 bug because it prevented us from enabling jemalloc on Mac 10.5 machines.

Brian Hackett tweaked the JS engine so that more method JIT code can be discarded periodically, particularly chrome code in system compartments.

Oleg Romashin avoided using transparent layers in Fennec remote offscreen viewports.  This saves 5MB of memory in the active tab.

I added a memory reporter for the startup cache.  This is often around 1MB of memory, but it’s allocated via mmap/VirtualAlloc and so doesn’t change the “heap-unclassified” number in about:memory.

Boris Zbarsky fixed a small leak involving CSS transforms.

Bad News

It appears a bad memory regression has occurred in the past week or so.  Several people have reported multi-second pauses caused by garbage collection and cycle collection.  The problem only seems to strike when many tabs are open and/or the browser has been running for multiple days.  This needs investigation;  if you are experiencing similar problems please report in the bug.  Reliable steps to reproduce this bug will be invaluable.  If you turn on javascript.options.mem.log in about:config you can see when GCs and CCs occur and how long they take, which is helpful for diagnosis.

Bug Counts

The current bug counts are as follows.

  • P1: 35 (-5, +3)
  • P2: 113 (-3, +8)
  • P3: 54 (-0, +1)
  • Unprioritized: 4 (-5, +3)

I want to point out this bug, which presents an idea to help hunt down reproducible leaks that occur when users have multiple add-ons present.  This is important because many of the leaks reported by users recently are due to add-ons, but often the reporter has many add-ons installed which makes finding the culprit painful.  The goal is to write a Firefox add-on that selectively disables installed add-ons, so that a user can bisect them to discover which add-on is responsible for the leak.  This bisecting process is something that people can do manually, but an add-on that automates the process would make things easier and less error-prone.  Mercurial’s ‘hg bisect’ command would serve as a useful comparison.  Ehsan Akhgari has volunteered to mentor anyone who would like to try to implement this.


Categories
about:memory Firefox Garbage Collection Memory allocation Memory consumption MemShrink Tracemonkey Valgrind

MemShrink progress, week 9

Firefox 8 graduated to the Aurora channel this week, and the development period for what will become Firefox 9 began.  Lots of MemShrink activity happened this week, and I think all the changes listed below will make it into Firefox 8.

Avoiding Wasted Memory

I have blogged previously about memory wasted by “clownshoes” bugs.   Ed Morley found a webpage that resulted in 700MB of memory being wasted by the PLArena clownshoes bug.  Basically, on platforms where jemalloc is used (Windows, Linux), half the memory allocated by nsPresArena (which is built on top of PLArena) was wasted.  (On Mac the waste was 11%, because the Mac allocator rounds up less aggressively than jemalloc).

Fixing this problem properly for all PLArenas takes time because it requires changes to NSPR, so I made a spot-fix for the nsPresArena case.  This is a particularly big win on very large pages, but it saves around 3MB even on Gmail. This spot-fix has been granted beta approval and so will, barring disaster, make it into Firefox 7.

A Firefox Nightly user did some measurements with different browsers on the problematic page:

  • Firefox 8.0a1 before patch: 2.0 GB
  • Firefox 8.0a1 after patch: 1.3 GB
  • Latest Chrome canary build and dev (15.0.849.0): 1.1GB
  • Webkit2Process of Safari 5.1: 1.05 GB
  • Internet Explorer 9.0.2: 838 MB
  • Latest Opera Next 12.00: 727 MB

So this fix gets Firefox within spitting distance of other browsers, which is good!

In other developments related to avoiding wasted memory:

  • Luke Wagner discovered that, on typical websites, most JSScripts are byte-compiled but never run.  A JSScript roughly corresponds to a JavaScript function.  In hindsight, it’s not such a surprising result — Firefox byte-compiles all loaded JavaScript code, and you can imagine lots of websites use libraries like jQuery but only use a small fraction of the functions in the library.  Making byte-compilation lazy could potentially save MBs of memory per compartment.  But that will require some non-trivial reworking of the JS engine, and so is unlikely to happen in the short-term.
  • Kyle Huey avoided a small amount (~100KB per browser process) of waste due to rounding up in XPT arenas.

Improving about:memory

I made some progress on a Valgrind tool to help identify the memory that is currently reported only by the “heap-unclassified” bucket in about:memory.  It’s called “DMD”, short for “Dark Matter Detector”.  It’s in early stages and I still need to teach it about most of Firefox’s memory reporters, but it’s already spitting out useful data, which led to me and Ehsan Akhgari landing memory reporters for the JS atom table and the Hunspell spell checker.  We also now have some insight (here and here) about memory usage for very large pages.

Mounir Lamouri turned on the memory reporter for the DOM that he’s been working on for some time.  This shows up under “dom” in about:memory.  There are still some cases that require handling;  you can follow the progress of these here.

Andrew McCreight replaced about:memory’s buttons so you can force a cycle collection without also forcing a garbage collection, which may be useful in hunting down certain problems.

Finally, Sander van Veen added the existing “js-compartments-user” and “js-compartments-system” to the statistics collected by telemetry (his first landed patch!), and I did likewise for the “storage/sqlite” reporter.  I also added a new “tjit-data/trace-monitor” memory reporter that accounts for some of the memory used by TraceMonkey.

Miscellaneous

Igor Bukanov tweaked the handling of empty chunks by the JavaScript garbage collector.  That sounds boring until you see the results on Gregor Wagner’s 150-tab stress test: resident memory usage dropped 9.5% with all 150 tabs open, and dropped by 27% after all those tabs were closed.

Brian Hackett fixed a memory leak in type inference, which gets it one step closer to being ready to land.

Christian Höltje fixed a leak in his “It’s All Text” add-on that was causing zombie compartments.  This fix will be in version 1.6.0, which is currently awaiting to receive AMO approval, but can be obtained here in the meantime.  This fix and last week’s fix of a memory leak in LastPass are very encouraging — per-compartment reporters in about:memory have, for the first time, given add-on developers a reasonable tool for identifying memory leaks.  I hope we can continue to improve the situation here.  Several people have asked me for documentation on how to avoid memory leaks in add-ons.  I’m not the person to write that guide (I’m not a Gecko expert and I know almost nothing about add-ons) but hopefully someone else can step up to the plate.

Bug counts

Here’s the change in MemShrink bug counts.

  • P1: 30 (-0, +1)
  • P2: 64 (-4, +6)
  • P3: 36 (-5, +0)
  • Unprioritized: 1 (-2, +1)

Good progress on P3 bugs, but they’re the least important ones.  Other than that, new bugs are still being reported faster than they’re being fixed.  If you want to help but don’t know where to start, feel free to email me or ping me on IRC and I’ll do my best to help get you involved.