Categories
Firefox JägerMonkey Memory consumption MemShrink Tracemonkey Uncategorized

MemShrink progress, week 20

Surprise of the week

[Update: This analysis about livemarks may be wrong.  Talos results from early September show that the MaxHeaps number increased, and the reduction when the “Latest Headlines” livemark was removed has undone that increase.  So livemarks may not be responsible at all, it could just be a coincidence.  More investigation is needed!]

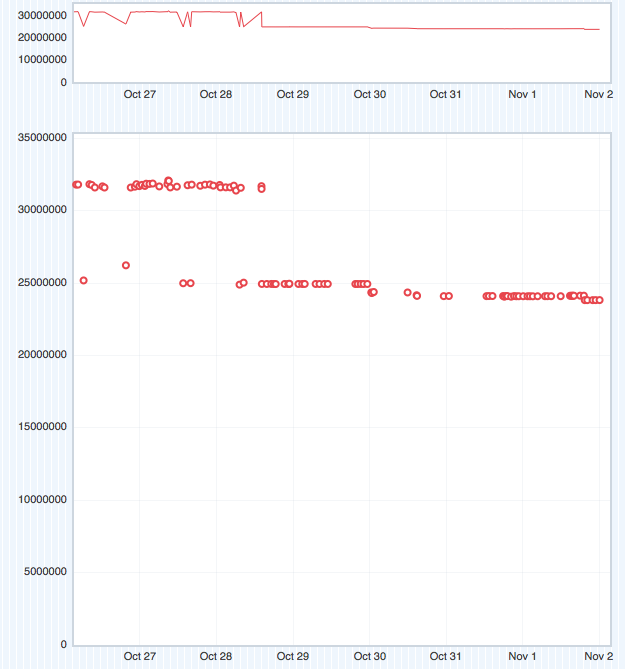
Jeff Muizelaar removed the “Latest Headlines” live bookmark from new profiles.  This was in the Bookmarks Toolbar, and so hasn’t been visible since Firefox 4.0, and most people don’t use it.  And it uses a non-zero amount of memory and CPU.  Just how non-zero was unclear until Marco Bonardo noticed some big performance improvements.  First, in the Talos “MaxHeap” results on WinNT5.2:

Talos MaxHeap graph

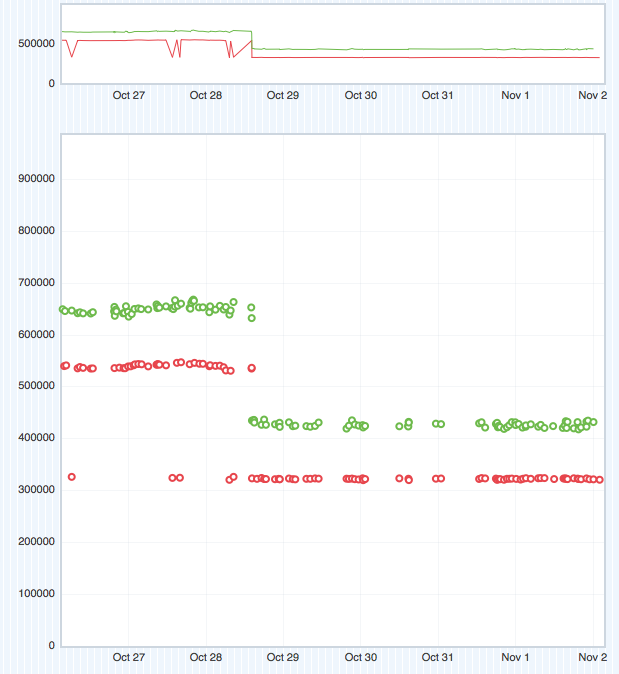
And secondly in the Talos “Allocs” results on WinNT5.2 and Mac10.5.2:

Talos Allocs graph

In the WinNT5.2 cases, it looks like we had a bi-modal distribution previously, and this patch changed things so that the higher of the two cases never occurred.  In the Mac10.5.2 case we just had a simple reduction in the number of allocations.  On Linux the results were less conclusive, but there may have been a similar if smaller effect.

This surprised me greatly.  I’ve done a lot of memory profiling of Firefox and never seen anything that pointed to the feed reader as using a lot of memory.  This may be because the feed reader’s usage is falling into a larger, innocuous bucket, such as JS or generic strings.  Or maybe I just missed the signs altogether.

Some conclusions and questions:

  • If you have live bookmarks in your bookmarks toolbar, remove them! [Update: I meant to say “unused live bookmarks”.]
  • We need to work out what is going on with the feed reader, and optimize its memory usage.
  • Can we disable unused live bookmarks for existing users?

Apparently nobody really owns the feed reader, because previous contributors to it have all moved on.  So I’m planning to investigate, but I don’t know the first thing about it.  Any help would be welcome!

 Other stuff

There was a huge memory leak in the Video DownloadHelper add-on v4.9.5, and possibly earlier versions.  This has been fixed in v4.9.6a3 and the fix will make it into the final version v4.9.6 when it is released.  That’s one more add-on leak down, I wonder how many more there are to go.

TraceMonkey, the trace JIT, is no longer built by default.  This means it’s no longer used, and this saves both code and data space.  The old combination of TraceMonkey and JaegerMonkey is slower than the new combination of JaegerMonkey with type inference, and TraceMonkey is also preventing various clean-ups and simplifications, so it’ll be removed entirely soon.

I refined the JS memory reporters in about:memory to give more information about objects, shapes and property tables.

I avoided creating small property tables, removed KidHashes when possible, and reduced the size of KidHashes with few entries.

I wrote about various upcoming memory optimizations in the JS engine.

Justin Lebar enabled jemalloc on MacOS 10.5 builds.  This was expected to be a space improvement, but it also reduced the “Tp5 MozAfterPaint” page loading benchmark by 8%.

Robert O’Callahan avoided excessive memory usage in certain DOM animations on Windows.

Drew Willcoxon avoided excessive memory usage in context menu items created by the add-on SDK.

Bug Counts

  • P1: 35 (-1, +1)
  • P2: 116 (-2, +5)
  • P3: 55 (-2, +3)
  • Unprioritized: 5 (-4, +5)

At this week’s MemShrink meeting we only had 9 bugs to triage, which is the lowest we’ve had in a long time.  It feels like the MemShrink bug list is growing slower than in the past.

Categories
Firefox Performance Uncategorized

Faster JavaScript parsing

Over the past year or so I’ve almost doubled the speed of SpiderMonkey’s JavaScript parser.  I did this by speeding up both the scanner (bug 564369, bug 584595, bug 588648, bug 639420, bug 645598) and the parser (bug 637549).  I used patch stacks in several of those bugs, and so in those six bugs I actually landed 28 changesets.

Notable things about scanning JavaScript code

Before I explain the changes I made, it will help to explain a few notable things about scanning JavaScript code.

  • JavaScript is encoded using UCS-2.  This means that each character is 16 bits.
  • There are several character sequences that indicate the end of a line (EOL): ‘\n’, ‘\r’, ‘\r\n’, \u2028 (a.k.a. LINE_SEPARATOR), and \u2029 (a.k.a. PARA_SEPARATOR).  Note that ‘\r\n’ is treated as a single character.
  • JavaScript code is often minified, and the characteristics of minified and non-minified code are quite different.  The most important difference is that minified code has much less whitespace.

Scanning improvements

Before I made any changes, there were two different modes in which the scanner could operate.  In the first mode, the entire character stream to be scanned was already in memory.  In the second, the scanner read the characters from a file in chunks a few thousand chars long.  Firefox always uses the first mode (except in the rare case where the platform doesn’t support mmap or an equivalent function), but the JavaScript shell used the second.  Supporting the second made made things complicated in two ways.

  • It was possible for an ‘\r\n’ EOL sequence to be split across two chunks, which required some extra checking code.
  • The scanner often needs to unget chars (up to six chars, due to the lookahead required for \uXXXX sequences), and it couldn’t unget chars across a chunk boundary.  This meant that it used a six-char unget buffer.  Every time a char was ungotten, it would be copied into this buffer.  As a consequence, every time it had to get a char, it first had to look in the unget buffer to see if there was one or more chars that had been previously ungotten.  This was an extra check (and a data-dependent and thus unpredictable check).

The first complication was easy to avoid by only reading N-1 chars into the chunk buffer, and only reading the Nth char in the ‘\r\n’ case.  But the second complication was harder to avoid with that design.  Instead, I just got rid of the second mode of operation;  if the JavaScript engine needs to read from file, it now reads the whole file into memory and then scans it via the first mode.  This can result in more memory being used but it only affects the shell, not the browser, so it was an acceptable change.  This allowed the unget buffer to be completely removed;  when a character is ungotten now the scanner just moves back one char in the char buffer being scanned.

Another improvement was that in the old code, there was an explicit EOL normalization step.  As each char was gotten from the memory buffer, the scanner would check if it was an EOL sequence;  if so it would change it to ‘\n’, if not, it would leave it unchanged.  Then it would copy this normalized char into another buffer, and scanning would proceed from this buffer.  (The way this copying worked was strange and confusing, to make things worse.)  I changed it so that getChar() would do the normalization without requiring the copy into the second buffer.

The scanner has to detect EOL sequences in order to know which line it is on.  At first glance, this requires checking every char to see if it’s an EOL, and the scanner uses a small look-up table to make this fast.  However, it turns out that you don’t have to check every char.  For example, once you know that you’re scanning an identifier, you know that if you hit an EOL sequence you’ll immediately unget it, because that marks the end of the identifier.  And when you unget that char you’ll undo the line update that you did when you hit the EOL.  This same logic applies in other situations (eg. parsing a number).  So I added a function getCharIgnoreEOL() that doesn’t do the EOL check.  It has to always be paired with ungetCharIgnoreEOL() and requires some care as to where it’s used, but it avoids the EOL check on more than half the scanned chars.

As well as detecting where each token starts and ends, for a lot of token kinds the scanner has to compute a value.  For example, after scanning the character sequence ” 123 ” it has to convert that to the number 123.  The old scanner would copy the chars into a temporary buffer before calling the function that did the conversion.  This was unnecessary — the conversion function didn’t even require NULL-terminated strings because it gets passed the length of the string being converted!  Also, the old scanner was using js_strtod() to do the number conversion.  js_strtod() can convert both integers and fractional numbers, but its quite slow and overkill for integers.  And when scanning, even before converting the string to a number, we know if the number we just scanned was an integer or not (by remembering if we saw a ‘.’ or exponent).  So now the scanner instead calls GetPrefixInteger() which is much faster.  Several of the tests in Kraken involve huge arrays of integers, and this made a big difference to them.

There’s a similar story with identifiers, but with an added complication.  Identifiers can contain \uXXXX chars, and these need to be normalized before we do more with the string inside SpiderMonkey.  So the scanner now remembers whether a \uXXXX char has occurred in an identifier.  If not, it can work directly (temporarily) with the copy of the string inside the char buffer.  Otherwise, the scanner will rescan the identifier, normalizing and copying it into a new buffer.  I.e. the scanner de-optimizes the (very) rare case in order to avoid the copying in the common case.

JavaScript supports decimal, hexadecimal and octal numbers.  The number-scanning code handled all three kinds in the same loop, which meant that it checked the radix every time it scanned another number char.  So I split this into three parts, which make it both faster and easier to read.

Although JavaScript chars are 16 bits, the vast majority of chars you see are in the first 128 chars.  This is true even for code written in non-Latin scripts, because of all the keywords (e.g. ‘var’) and operators (e.g. ‘+’) and punctuation (e.g. ‘;’).  So it’s worth optimizing for those.  The main scanning loop (in getTokenInternal()) now first checks every char to see if its value is greater than 128.  If so, it handles it in a side-path (the only legitimate such chars are whitespace, EOL or identifier chars, so that side-path is quite small).  The rest of getTokenInternal() can then assume that it’s a sub-128 char.  This meant I could be quite aggressive with look-up tables, because having lots of 128-entry look-up tables is fine, but having lots of 65,536-entry look-up tables would not be.  One particularly important look-up table is called firstCharKinds;  it tells you what kind of token you will have based on the first non-whitespace char in it.  For example, if the first char is a letter, it will be an identifier or keyword;  if the first char is a ‘0’ it will be a number;  and so on.

Another important look-up table is called oneCharTokens.  There are a handful of tokens that are one-char long, cannot form a valid prefix of another token, and don’t require any additional special handling:  ;,?[]{}().  These account for 35–45% of all tokens seen in real code!  The scanner can detect them immediately and use another look-up table to convert the token char to the internal token kind without any further tests.  After that, the rough order of frequency for different token kinds is as follows:  identifiers/keywords, ‘.’, ‘=’, strings, decimal numbers, ‘:’, ‘+’, hex/octal numbers, and then everything else.  The scanner now looks for these token kinds in that order.

That’s just a few of the improvements, there were lots of other little clean-ups.  While writing this post I looked at the old scanning code, as it was before I started changing it.  It was awful, it’s really hard to see what was happening;  getChar() was 150 lines long because it included code for reading the next chunk from file (if necessary) and also normalizing EOLs.

In comparison, as well as being much faster, the new code is much easier to read, and much more DFA-like.  It’s worth taking a look at getTokenInternal() in jsscan.cpp.

Parsing improvements

The parsing improvements were all related to the parsing of expressions.  When the parser parses an expression like “3” it needs to look for any following operators, such as “+”.  And there are roughly a dozen levels of operator precedence.  The way the parser did this was to get the next token, check if it matched any of the operators of a particular precedence, and then unget the token if it didn’t match.  It would then repeat these steps for the next precedence level, and so on.  So if there was no operator after the “3”, the parser would have gotten and ungotten the next token a dozen times!  Ungetting and regetting tokens is fast, because there’s a buffer used (i.e. you don’t rescan the token char by char) but it was still a bottleneck.  I changed it so that the sub-expression parsers were expected to parse one token past the end of the expression, instead of zero tokesn past the end.  This meant that the repeated getting/ungetting could be avoided.

These operator parsers are also very small.  I inlined them more aggressively, which also helped quite a bit.

Results

I had some timing results but now I can’t find them.  But I know that the overall speed-up from my changes was about 1.8x on Chris Leary’s parsemark suite, which takes code from lots of real sites, and the variation in parsing times for different codebases tends not to vary that much.

Many real websites, e.g. gmail, have MB of JS code, and this speed-up will probably save one or two tenths of a second when they load.  Not something you’d notice, but certainly something that’ll add up over time and help make the browser feel snappier.

Tools

I used Cachegrind to drive most of these changes.  It has two features that were crucial.

First, it does event-based profiling, i.e. it counts instructions, memory accesses, etc, rather than time.  When making a lot of very small improvements, noise variations often swamp the effects of the improvements, so being able to see that instruction counts are going down by 0.2% here, 0.3% there, is very helpful.

Second, it gives counts of these events for individual lines of source code.  This was particularly important for getTokenInternal(), which is the main scanning function and has around 700 lines;  function-level stats wouldn’t have been enough.

Categories
Uncategorized

Warnings-as-errors in js/src/

Bug 609532 changed the way the JavaScript shell is built so that compile warnings are treated as errors.  We already had a zero-tolerance policy for compile warnings in js/src/, but they tend to creep in, especially on Windows, because most people develop on Mac or Linux.  Already at least one Windows build turned red because of a warning, and it was immediately fixed by the dev responsible. Previously that warning would have lasted for days or weeks until someone on Windows got sick enough of it to fix it.

I’d love to see the same thing done for the entire browser, but judging by the reams of compile warnings that go by when building the browser, this won’t happen any time soon.

Oh, and if you don’t know about make -s (a.k.a. make --silent or make --quiet), you should try it. It’s indispensible!

Categories
Uncategorized

Community Service Announcement

Prepending ‘@’ to somebody’s name does something useful in Twitter.  Outside of Twitter, it’s extra typing and looks silly.

Categories
Uncategorized

A note about umlauts

Umlauts appear on three German letters: ä, ö, ü.  If typing non-English characters is difficult, you can substitute ‘ae’, ‘oe’, ‘ue’ respectively.

If you can’t type “JägerMonkey”, you should type “JaegerMonkey”.  “JagerMonkey” is wrong.

Categories
Uncategorized

Memory profiling Firefox on TechCrunch

Rob Sayre suggested TechCrunch to me as a good stress test for Firefox’s memory usage:

  {sayrer} take a look at techcrunch.com if you have a chance. that one is brutal.

So I measured space usage with Massif for a single TechCrunch tab, on 64-bit Linux. Here’s the high-level result:

  34.65% (371,376,128B) _dl_map_object_from_fd (dl-load.c:1199)
  21.14% (226,603,008B) pthread_create@@GLIBC_2.2.5 (allocatestack.c:483)
  08.93% (95,748,276B) in 4043 places, all below massif's threshold (00.20%)
  06.26% (67,112,960B) pa_shm_create_rw (in /usr/lib/libpulsecommon-0.9.21.so)
  03.10% (33,263,616B) JSC::ExecutablePool::systemAlloc(unsigned long) (ExecutableAllocatorPosix.cpp:43)
  02.67% (28,618,752B) NewOrRecycledNode(JSTreeContext*) (jsparse.cpp:670)
  01.90% (20,414,464B) js::PropertyTree::newShape(JSContext*, bool) (jspropertytree.cpp:97)
  01.57% (16,777,216B) GCGraphBuilder::AddNode(void*, nsCycleCollectionParticipant*) (nsCycleCollector.cpp:596)
  01.48% (15,841,208B) JSScript::NewScript(JSContext*, unsigned int, unsigned int, unsigned int, unsigned int, unsigned int, unsigned int, unsigned int, unsigned int, unsigned int, unsigned short, unsigned short, JSVersion) (jsutil.h:210)
  01.45% (15,504,752B) ChangeTable (pldhash.c:563)
  01.44% (15,478,784B) g_mapped_file_new (in /lib/libglib-2.0.so.0.2400.1)
  01.41% (15,167,488B) GCGraphBuilder::NoteScriptChild(unsigned int, void*) (mozalloc.h:229)
  01.37% (14,680,064B) js_NewFunction(JSContext*, JSObject*, int (*)(JSContext*, unsigned int, js::Value*), unsigned int, unsigned int, JSObject*, JSAtom*) (jsgcinlines.h:127)
  00.97% (10,383,040B) js::mjit::Compiler::finishThisUp(js::mjit::JITScript**) (jsutil.h:214)
  00.78% (8,388,608B) js::StackSpace::init() (jscntxt.cpp:164)
  00.69% (7,360,512B) pcache1Alloc (sqlite3.c:33491)
  00.62% (6,601,324B) PL_DHashTableInit (pldhash.c:268)
  00.59% (6,291,456B) js_NewStringCopyN(JSContext*, unsigned short const*, unsigned long) (jsgcinlines.h:127)
  00.59% (6,287,516B) nsTArray_base::EnsureCapacity(unsigned int, unsigned int) (nsTArray.h:88)
  00.52% (5,589,468B) gfxImageSurface::gfxImageSurface(gfxIntSize const&, gfxASurface::gfxImageFormat) (gfxImageSurface.cpp:111)
  00.49% (5,292,184B) js::Vector::growStorageBy(unsigned long) (jsutil.h:218)
  00.49% (5,283,840B) nsHTTPCompressConv::OnDataAvailable(nsIRequest*, nsISupports*, nsIInputStream*, unsigned int, unsigned int) (nsMemory.h:68)
  00.49% (5,255,168B) js::Parser::markFunArgs(JSFunctionBox*) (jsutil.h:210)
  00.49% (5,221,320B) nsStringBuffer::Alloc(unsigned long) (nsSubstring.cpp:209)
  00.43% (4,558,848B) _dl_map_object_from_fd (dl-load.c:1250)
  00.42% (4,554,740B) nsTArray_base::EnsureCapacity(unsigned int, unsigned int) (nsTArray.h:84)
  00.39% (4,194,304B) js_NewGCString(JSContext*) (jsgcinlines.h:127)
  00.39% (4,194,304B) js::NewCallObject(JSContext*, js::Bindings*, JSObject&, JSObject*) (jsgcinlines.h:127)
  00.39% (4,194,304B) js::NewNativeClassInstance(JSContext*, js::Class*, JSObject*, JSObject*) (jsgcinlines.h:127)
  00.39% (4,194,304B) JS_NewObject (jsgcinlines.h:127)
  00.35% (3,770,972B) js::PropertyTable::init(JSRuntime*, js::Shape*) (jsutil.h:214)
  00.35% (3,743,744B) NS_NewStyleContext(nsStyleContext*, nsIAtom*, nsCSSPseudoElements::Type, nsRuleNode*, nsPresContext*) (nsPresContext.h:306)
  00.34% (3,621,704B) XPT_ArenaMalloc (xpt_arena.c:221)
  00.31% (3,346,532B) nsCSSSelectorList::AddSelector(unsigned short) (mozalloc.h:229)
  00.30% (3,227,648B) js::InitJIT(js::TraceMonitor*) (jsutil.h:210)
  00.30% (3,207,168B) js::InitJIT(js::TraceMonitor*) (jsutil.h:210)
  00.30% (3,166,208B) js_alloc_temp_space(void*, unsigned long) (jsatom.cpp:689)
  00.28% (2,987,548B) nsCSSExpandedDataBlock::Compress(nsCSSCompressedDataBlock**, nsCSSCompressedDataBlock**) (mozalloc.h:229)
  00.27% (2,883,584B) js::detail::HashTable::SetOps, js::SystemAllocPolicy>::add(js::detail::HashTable::SetOps, js::SystemAllocPolicy>::AddPtr&, unsigned long const&) (jsutil.h:210)
  00.26% (2,752,512B) FT_Stream_Open (in /usr/lib/libfreetype.so.6.3.22)
  00.24% (2,564,096B) PresShell::AllocateFrame(nsQueryFrame::FrameIID, unsigned long) (nsPresShell.cpp:2098)
  00.21% (2,236,416B) nsRecyclingAllocator::Malloc(unsigned long, int) (nsRecyclingAllocator.cpp:170)

Total memory usage at peak was 1,071,940,088 bytes. Lets go through some of these entries one by one.

  34.65% (371,376,128B) _dl_map_object_from_fd (dl-load.c:1199)
  21.14% (226,603,008B) pthread_create@@GLIBC_2.2.5 (allocatestack.c:483)
  06.26% (67,112,960B) pa_shm_create_rw (in /usr/lib/libpulsecommon-0.9.21.so)

These three, although the biggest single entries, can be more or less ignored;  I explained why previously.

  03.10% (33,263,616B) JSC::ExecutablePool::systemAlloc() (ExecutableAllocatorPosix.cpp:43)

This is for code generated by JaegerMonkey.  I know very little about JaegerMonkey’s code generation so I don’t have any good suggestions for reducing it.  As I understand it very little effort has been made to minimize the size of the generated code so there may well be some easy wins there.

  02.67% (28,618,752B) NewOrRecycledNode() (jsparse.cpp:670)

This is for JSParseNode, the basic type from which JS parse trees are constructed.  Bug 626932 is open to shrink JSParseNode;  there are a couple of good ideas but not much progress has been made.  I hope to do more here but probably not in time for Firefox 4.0.

  01.90% (20,414,464B) js::PropertyTree::newShape() (jspropertytree.cpp:97)

Shapes are a structure used to speed up JS property accesses.  Increasing the MAX_HEIGHT constant from 64 to 128 (which reduces the number of JS objects that are converted to “dictionary mode”, and thus the number of Shapes that are allocated) may reduce this by 3 or 4 MB with negligible speed cost.  I opened bug 630456 for this.

  01.57% (16,777,216B) GCGraphBuilder::AddNode() (nsCycleCollector.cpp:596)
  01.41% (15,167,488B) GCGraphBuilder::NoteScriptChild() (mozalloc.h:229)

This is the cycle collector.  I know almost nothing about it, but I see it allocates 32,768 PtrInfo structs at a time.  I wonder if that strategy could be improved.

  01.48% (15,841,208B) JSScript::NewScript() (jsutil.h:210)
  01.37% (14,680,064B) js_NewFunction() (jsgcinlines.h:127)

Each JS function has a JSFunction associated with it, and each JSFunction has a JSScript associated with it.  Each of them stores various bits of information about the function.  I don’t have any good ideas for how to shrink these structures.  Both of them are reasonably large, with lots of fields.

  00.97% (10,383,040B) js::mjit::Compiler::finishThisUp() (jsutil.h:214)

Each function compiled by JaegerMonkey also has some additional information associated with it, including all the inline caches.  This is allocated here.  Some good progress has already been made here, and I have some more ideas for getting it down a bit further.

  00.59% (6,291,456B) js_NewStringCopyN() (jsgcinlines.h:127)
  00.49% (5,292,184B) js::Vector::growStorageBy() (jsutil.h:218)

These entries are for space used during JS scanning (a.k.a. lexing, tokenizing).  Identifiers and strings get atomized, i.e. put into a table so there’s a single copy of each one.  Take an identifier as an example.  It starts off stored in a buffer of characters.  It gets scanned and copied into a js::Vector, with any escaped chars being converted along the way.  Then the copy in the js::Vector is atomized, which involves copying it again into a malloc’d buffer of just the right size.  I thought about avoiding this copying in bug 588648, but it turned out to be difficult.  (I did manage to remove another extra copy of every character, though!)

In summary, there is definitely room for more improvement.  I hope to get a few more space optimizations in before Firefox 4.0 is released, but there’ll be plenty of other work to do afterwards.  If anyone can see other easy wins for the entries above, I’d love to hear about them.

Categories
Uncategorized

What is this T.3670 function produced by GCC?

When I do differential profiling with cg_diff I see a lot of entries like this:

-333,110  js/src/optg32/../assembler/assembler/AssemblerBuffer.h:T.3670
 333,110  js/src/optg32/../assembler/assembler/AssemblerBuffer.h:T.3703

T.3670 and T.3703 are clearly the same function, one which must be auto-generated by GCC but given different randomized suffixes in different builds.  These entries are uninteresting and I plan to add an option to cg_diff that allows the user to munge function names with a search-and-replace expression so I can get rid of them.

But I’d like to know what the are first, so I can talk about them in the cg_diff documentation.  Does anybody know?  I tried googling, but it’s a very hard thing to find out with a search engine.  (If someone can find something about it with a search engine I’d love to know what search term you used.)

Categories
Uncategorized

Memory profiling Firefox with Massif

I’m worried about Firefox 4.0’s memory consumption.  Bug 598466 indicates that it’s significantly higher than Firefox 3.6’s memory consumption. So I did some profiling with Massif, a memory profiler built with Valgrind.

My test run involved a Firefox profile in which 20 tabs were open to random comics from http://www.cad-comic.com/cad/. This is a site that uses lots of JavaScript code.  I ran a 64-bit version of Firefox on a Ubuntu 10.10 machine.

Here’s the command line I used:

  valgrind --smc-check=all --trace-children=yes --tool=massif --pages-as-heap=yes \
    --detailed-freq=1000000 optg64/dist/bin/firefox -P cad20 -no-remote

Here’s what that means:

  • --smc-check=all tells Valgrind that the program may use self-modifying code (or, in Firefox’s case, overwrite dynamically generated code).
  • --trace-children tells Valgrind to trace into child processes exec’d by the program.  This is necessary because optg64/dist/bin/firefox is a wrapper script.
  • --tool=massif tells Valgrind to run Massif.
  • --pages-as-heap=yes tells Massif to profile allocations of all memory at the page level, rather than just profiling the heap (ie. memory allocated via malloc/new).  This is important because the heap is less than half of Firefox’s memory consumption.
  • --detailed-freq=1000000 tells Massif to do detailed snapshots (which are more informative but more costly) only every 1,000,000th snapshot, which is less often than the default of every 10th snapshot.  This makes it run a bit faster.  This is fine because Massif always takes a detailed snapshot at the peak memory consumption point, and that’s the one I’m interested in.
  • optg64/ is the name of my build directory.
  • -P cad20 tells Firefox to use a particular profile that I set up appropriately.
  • -no-remote tells Firefox to start a new instance;  this is necessary because I had a Firefox 3.6 process already running.

Massif produced a number of files, one per invoked process.  They have names like massif.out.22722, where the number is the process ID.  I worked out which one was the main Firefox executable;  this is not hard because the output file has the invoked command on its second line.  I then viewed it in two ways.  The first was with Massif’s ms_print script, using this command:

    ms_print massif.out.22722

This produces a text representation of the information that Massif collects.

The second was with the massif-visualizer program, which is not part of the Valgrind distribution, but is available here. The information it shows is much the same as that shown by ms_print, but it’s much prettier. Below is a screenshot that shows the basic progression of the memory consumption (click on it for a full-size version).
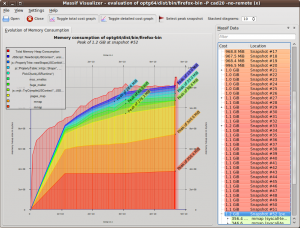
massif-visualizer

At the peak memory usage point, a total of 1,297,612,808 bytes were mapped.

I went through the detailed snapshot taken at the point of peak memory consumption.  Massif takes the stack trace of every memory allocation in the program, and collapses them into a tree structure in which common stack trace prefixes are merged.  See the Massif user manual for more details of this tree structure;  what’s relevant for this blog post is that I (manually) picked out various places in the code that cause significant amounts of memory to be mapped. These places together cover 68.85% (893,463,472 bytes) of the total mapped memory;  the other 31.15% was taken up by smaller allocations that are less worth singling out. Each place contains a partial stack trace as identification.  I’ve listed them from largest to smallest.

28.40% (368,484,352 bytes) here:

  mmap (syscall-template.S:82)
  _dl_map_object_from_fd (dl-load.c:1195)
  _dl_map_object (dl-load.c:2234)

This is for the loading of shared objects, both data and code.

12.94% (167,854,080 bytes) here:

  mmap (syscall-template.S:82)
  pthread_create@@GLIBC_2.2.5 (allocatestack.c:483)
  _PR_CreateThread (ptthread.c:424)

This is for thread stacks. Robert O’Callahan and Chris Jones tell me that Linux thread stacks are quite large (8MB?) but although that space is mapped, most of it won’t be committed (i.e. actually used).

6.54% (84,828,160 bytes) here:

  mmap (syscall-template.S:82)
  JSC::ExecutablePool::systemAlloc(unsigned long) (ExecutableAllocatorPosix.cpp:43)
  JSC::ExecutablePool::create(unsigned long) (ExecutableAllocator.h:374)
  js::mjit::Compiler::finishThisUp(js::mjit::JITScript**) (ExecutableAllocator.h:)

This is for native code generated by JaegerMonkey. Bug 615199 has more about this.

5.17% (67,112,960 bytes) here:

  mmap (syscall-template.S:82)
  pa_shm_create_rw (in /usr/lib/libpulsecommon-0.9.21.so)
  pa_mempool_new (in /usr/lib/libpulsecommon-0.9.21.so)
  pa_context_new_with_proplist (in /usr/lib/libpulse.so.0.12.2)
  ??? (in /usr/lib/libcanberra-0.22/libcanberra-pulse.so)
  pulse_driver_open (in /usr/lib/libcanberra-0.22/libcanberra-pulse.so)
  ??? (in /usr/lib/libcanberra.so.0.2.1)
  ??? (in /usr/lib/libcanberra.so.0.2.1)
  ca_context_play_full (in /usr/lib/libcanberra.so.0.2.1)
  ca_context_play (in /usr/lib/libcanberra.so.0.2.1)
  nsSound::PlayEventSound(unsigned int) (nsSound.cpp:467)
  nsMenuPopupFrame::ShowPopup(int, int) (nsMenuPopupFrame.cpp:749)
  nsXULPopupManager::ShowPopupCallback(nsIContent*, nsMenuPopupFrame*, int, int) (nsXULPopupManager.cpp:709)
  nsXULPopupManager::FirePopupShowingEvent(nsIContent*, int, int) (nsXULPopupManager.cpp:1196)
  nsXULPopupShowingEvent::Run() (nsXULPopupManager.cpp:2196)
  nsThread::ProcessNextEvent(int, int*) (nsThread.cpp:626)
  NS_ProcessNextEvent_P(nsIThread*, int) (nsThreadUtils.cpp:250)
  mozilla::ipc::MessagePump::Run(base::MessagePump::Delegate*) (MessagePump.cpp:110)
  MessageLoop::Run() (message_loop.cc:202)
  nsBaseAppShell::Run() (nsBaseAppShell.cpp:192)
  nsAppStartup::Run() (nsAppStartup.cpp:191)
  XRE_main (nsAppRunner.cpp:3691)
  main (nsBrowserApp.cpp:158)

This is sound-related stuff, which is a bit surprising, because the CAD website doesn’t produce any sound, as far as I can tell.

3.58% (46,505,328 bytes) here:

  js::mjit::Compiler::finishThisUp(js::mjit::JITScript**) (jsutil.h:213)
  js::mjit::Compiler::performCompilation(js::mjit::JITScript**) (Compiler.cpp:208)
  js::mjit::Compiler::compile() (Compiler.cpp:134)
  js::mjit::TryCompile(JSContext*, JSStackFrame*) (Compiler.cpp:245)
  js::mjit::stubs::UncachedCallHelper(js::VMFrame&, unsigned int, js::mjit::stubs::UncachedCallResult*) (InvokeHelpers.cpp:387)
  js::mjit::ic::Call(js::VMFrame&, js::mjit::ic::CallICInfo*) (MonoIC.cpp:831)

This is auxiliary info generated by JaegerMonkey. Bug 615199 again has more on this, and some good progress has been made towards reducing this.

2.42% (31,457,280 bytes) here:

  huge_malloc (jemalloc.c:4654)
  posix_memalign (jemalloc.c:4022)
  XPConnectGCChunkAllocator::doAlloc() (xpcjsruntime.cpp:1169)
  PickChunk(JSRuntime*) (jsgcchunk.h:68)
  RefillFinalizableFreeList(JSContext*, unsigned int) (jsgc.cpp:468)
  js_NewFunction(JSContext*, JSObject*, int (*)(JSContext*, unsigned int, js::Value*), unsigned int, unsigned int, JSObject*, JSAtom*) (jsgcinlines.h:127)

2.04% (26,472,576 bytes) here:

  js::PropertyTable::init(js::Shape*, JSContext*) (jsutil.h:213)
  JSObject::addPropertyInternal(JSContext*, long, int (*)(JSContext*, JSObject*, long, js::Value*), int (*)(JSContext*, JSObject*, long, js::Value*), unsigned int, unsigned int, unsigned int, int, js::Shape**) (jsscope.cpp:859)
  JSObject::putProperty(JSContext*, long, int (*)(JSContext*, JSObject*, long, js::Value*), int (*)(JSContext*, JSObject*, long, js::Value*), unsigned int, unsigned int, unsigned int, int) (jsscope.cpp:905)

Bug 610070 is open about this.

1.58% (20,484,096 bytes) here:

  moz_xmalloc (mozalloc.cpp:98)
  GCGraphBuilder::NoteScriptChild(unsigned int, void*) (mozalloc.h:229)

1.44% (18,698,240 bytes) here:

  JS_ArenaAllocate (jsutil.h:209)
  NewOrRecycledNode(JSTreeContext*) (jsparse.cpp:487)
  JSParseNode::create(JSParseNodeArity, JSTreeContext*) (jsparse.cpp:557)

1.38% (17,898,944 bytes) here:

  JSScript::NewScript(JSContext*, unsigned int, unsigned int, unsigned int, unsigned int, unsigned int, unsigned int, unsigned int, unsigned int, unsigned int, unsigned short, unsigned short) (jsutil.h:209)
  JSScript::NewScriptFromCG(JSContext*, JSCodeGenerator*) (jsscript.cpp:1171)
  js_EmitFunctionScript (jsemit.cpp:3767)
  js_EmitTree (jsemit.cpp:4629)

1.20% (15,560,704 bytes) here:

  sqlite3MemMalloc (sqlite3.c:13855)
  mallocWithAlarm (sqlite3.c:17333)

1.10% (14,315,520 bytes) here:

  JS_ArenaAllocate (jsutil.h:209)
  js::PropertyTree::newShape(JSContext*, bool) (jspropertytree.cpp:97)
  js::PropertyTree::getChild(JSContext*, js::Shape*, js::Shape const&) (jspropertytree.cpp:428)
  JSObject::getChildProperty(JSContext*, js::Shape*, js::Shape&) (jsscope.cpp:580)
  JSObject::addPropertyInternal(JSContext*, long, int (*)(JSContext*, JSObject*, long, js::Value*), int (*)(JSContext*, JSObject*, long, js::Value*), unsigned int, unsigned int, unsigned int, int, js::Shape**) (jsscope.cpp:829)
  JSObject::putProperty(JSContext*, long, int (*)(JSContext*, JSObject*, long, js::Value*), int (*)(JSContext*, JSObject*, long, js::Value*), unsigned int, unsigned int, unsigned int, int) (jsscope.cpp:905)

1.06% (13,791,232 bytes) here:

  mmap (syscall-template.S:82)
  g_mapped_file_new (in /lib/libglib-2.0.so.0.2400.1)
  ??? (in /usr/lib/libgtk-x11-2.0.so.0.2000.1)
  ??? (in /usr/lib/libgtk-x11-2.0.so.0.2000.1)
  ??? (in /usr/lib/libgtk-x11-2.0.so.0.2000.1)
  ??? (in /usr/lib/libgtk-x11-2.0.so.0.2000.1)
  ??? (in /usr/lib/libgtk-x11-2.0.so.0.2000.1)
  gtk_icon_theme_lookup_icon (in /usr/lib/libgtk-x11-2.0.so.0.2000.1)
  gtk_icon_theme_load_icon (in /usr/lib/libgtk-x11-2.0.so.0.2000.1)
  gtk_icon_set_render_icon (in /usr/lib/libgtk-x11-2.0.so.0.2000.1)
  gtk_widget_render_icon (in /usr/lib/libgtk-x11-2.0.so.0.2000.1)
  nsIconChannel::Init(nsIURI*) (nsIconChannel.cpp:497)
  nsIconProtocolHandler::NewChannel(nsIURI*, nsIChannel**) (nsIconProtocolHandler.cpp:115)
  nsIOService::NewChannelFromURI(nsIURI*, nsIChannel**) (nsIOService.cpp:609)
  NewImageChannel(nsIChannel**, nsIURI*, nsIURI*, nsIURI*, nsILoadGroup*, nsCString const&, unsigned int, nsIChannelPolicy*) (nsNetUtil.h:228)
  imgLoader::LoadImage(nsIURI*, nsIURI*, nsIURI*, nsILoadGroup*, imgIDecoderObserver*, nsISupports*, unsigned int, nsISupports*, imgIRequest*, nsIChannelPolicy*, imgIRequest**)(imgLoader.cpp:1621)
  nsContentUtils::LoadImage(nsIURI*, nsIDocument*, nsIPrincipal*, nsIURI*, imgIDecoderObserver*, int, imgIRequest**) (nsContentUtils.cpp:2550)
  nsCSSValue::Image::Image(nsIURI*, nsStringBuffer*, nsIURI*, nsIPrincipal*, nsIDocument*) (nsCSSValue.cpp:1290)
  nsCSSValue::StartImageLoad(nsIDocument*) const (nsCSSValue.cpp:549)
  nsCSSCompressedDataBlock::MapRuleInfoInto(nsRuleData*) const (nsCSSDataBlock.cpp:190)
  nsRuleNode::WalkRuleTree(nsStyleStructID, nsStyleContext*, nsRuleData*, nsCSSStruct*) (nsRuleNode.cpp:2050)
  nsRuleNode::GetListData(nsStyleContext*) (nsRuleNode.cpp:1869)
  nsRuleNode::GetStyleData(nsStyleStructID, nsStyleContext*, int) (nsStyleStructList.h:81)
  nsRuleNode::WalkRuleTree(nsStyleStructID, nsStyleContext*, nsRuleData*, nsCSSStruct*) (nsRuleNode.cpp:2141)
  nsRuleNode::GetListData(nsStyleContext*) (nsRuleNode.cpp:1869)
  nsRuleNode::GetStyleList(nsStyleContext*, int) (nsStyleStructList.h:81)
  nsImageBoxFrame::DidSetStyleContext(nsStyleContext*) (nsStyleStructList.h:81)
  nsFrame::Init(nsIContent*, nsIFrame*, nsIFrame*) (nsFrame.cpp:369)
  nsLeafBoxFrame::Init(nsIContent*, nsIFrame*, nsIFrame*) (nsLeafBoxFrame.cpp:98)
  nsImageBoxFrame::Init(nsIContent*, nsIFrame*, nsIFrame*) (nsImageBoxFrame.cpp:233)

I’m hoping that someone (or multiple people) who reads this will be able to identify places where memory consumption can be reduced.  I’m happy to provide the raw data file to anyone who asks for it, though I also encourage people to try Massif themselves on different workloads.

Update. I forgot to mention that there was also the plugin-container process that ran in parallel to the main Firefox process. It was invoked by Firefox like so:

  /home/njn/moz/ws0/optg64/dist/bin/plugin-container \
    /home/njn/.mozilla/plugins/libflashplayer.so 22658 false plugin

It allocated 458,676,874 bytes at peak.  62.7% was due to the loading of shared objects, 12.8% was due to thread stacks, and the remaining 24.5% was due to unknown allocation sites (probably because the flash binary was missing symbols) and allocations too small to be worth singling out.
Categories
Uncategorized

Nanojit test coverage

On i386, Nanojit has two basic modes of operation:  SSE, and non-SSE.  Non-SSE is for old machines that don’t support SSE instructions.  (It might actually be SSE2 instructions, I’m not sure.)  My two machines both support SSE and so the non-SSE is never exercised unless I specify the environment variable X86_FORCE_SSE=no.  Since this invocation doesn’t exactly roll off the fingertips, I don’t do it often.  It’s also easy to mistype, in which case the normal SSE code will be run but I probably won’t notice and so I’m testing something different to what I think I am testing.

I recently committed a patch (bug 516348) that broke the non-SSE mode.  (It may have also broken the SSE mode, but in a less obvious way.)  Whenever I land a patch that breaks something, I try to work out if I could have avoided the breakage through a better process.  In this case I could have, through automation.  I now have the following set of aliases and functions in my .bashrc:

alias jstt_prefix="python trace-test/trace-test.py"
JSTTARGS32="--no-slow -f -x sunspider/check-date-format-tofte.js"
JSTTARGS64="$JSTTARGS32"

alias jsdtt32="                   jstt_prefix debug32/js $JSTTARGS32"
alias jsott32="                   jstt_prefix opt32/js   $JSTTARGS32"
alias jsdtt32b="X86_FORCE_SSE2=no jstt_prefix debug32/js $JSTTARGS32"
alias jsott32b="X86_FORCE_SSE2=no jstt_prefix opt32/js   $JSTTARGS32"
alias jsott64="                   jstt_prefix opt64/js   $JSTTARGS64"
alias jsdtt64="                   jstt_prefix debug64/js $JSTTARGS64"

function jsatt
{
  if [ -d debug32 ] && [ -d debug64 ] && [ -d opt32 ] && [ -d opt64 ] ; then
    cd debug32 && mq && cd .. && \
    cd debug64 && mq && cd .. && \
    cd opt32 && mq && cd .. && \
    cd opt64 && mq && cd ..

    if [ $? -eq 0 ] ; then
      echo
      echo "debug32"          && jsdtt32   && echo
      echo "debug32 (no SSE)" && jsdtt32b  && echo
      echo "debug64"          && jsdtt64   && echo
      echo "opt32"            && jsott32   && echo
      echo "opt32 (no SSE)"   && jsott32b  && echo
      echo "opt64"            && jsott64   && echo
    fi
  else
    echo "missing one of debug32/debug64/opt32/opt64"
  fi
}

The code is boring.  For those reading closely, it relies on the fact that I always put different builds in the directories debug32/, opt32/, debug64/, opt64/.  And I skip check-data-format-tofte.js because it fails if you’re in a non-US timezone, see bug 515214.

I already had ‘jsdtt32’ et al, each of which tests a single configuration.  But now with a single command ‘jsatt’ (which is short for “JavaScript All trace-tests”) I can run the JS trace-tests on 6 different configurations on a single x86-64 machine: 32-bit debug (SSE), 32-bit debug (non-SSE), 64-bit debug, 32-bit optimised (SSE), 32-bit optimised (non-SSE), 64-bit optimised.  And it builds them to make sure they’re all up-to-date.

It’s only a small process change for me, but it means that it’s unlikely I will break any of these configurations in the future, or at least, not in a way that shows up in the trace-tests.

Categories
Uncategorized

Valgrind on Windows?

With the Valgrind-on-Mac support coming along nicely, it’s worth addressing another widely-used platform:  Windows.  Will Valgrind work on Windows any time soon?  There are actually two answers:  (a) hell no, and (b) it already does (sort of).

The patch I merged from the Darwin branch onto the trunk yesterday was 28,300 lines.  And that was almost entirely new code, because I’d done a lot of work to synchronize the branch and trunk so that all non-addition changes had been dealt with.  Greg Parker spent over four years, off and on, working on the original port, and I spent close to three months full time cleaning it up, and Julian Seward also pitched in a bit.  I roughly estimate the Darwin port represents at least 1,000 person-hours of work, possibly much more.

And Mac OS X is a lot closer to Linux than Windows is.  Also, the Mac OS X kernel is open source, which makes a port much easier.  A Valgrind-on-Windows port would therefore be an enormous undertaking, one that is unlikely to happen soon, if ever.  That is how we get answer (a) above.

However, although Valgrind doesn’t run on Windows, it is possible to run Windows programs under Valgrind, thanks to Wine — you run the Windows program under Wine, and Wine under Valgrind.  The development (trunk) versions of both Valgrind and Wine now have enough awareness of each other that they can apparently be used together.  I say “apparently” because I haven’t tried it myself, but I know that others have had some success.  But please note that this is fairly new and experimental, and should only be tried by those not afraid to get their hands dirty (this page has more details). And that’s how we get the answer (b) above.