Since the Contributions Pilot launched in July, we’ve been working hard to improve this feature and understand its impact on the community. Since we launched the Contributions Dashboards in early September, we’ve been able to look at the data and gather our findings.
One of the first questions that developers want to know is whether or not they’ve picked the right contribution for their add-ons. Let’s take a look at some charts:
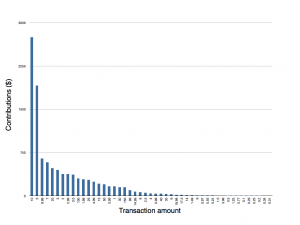
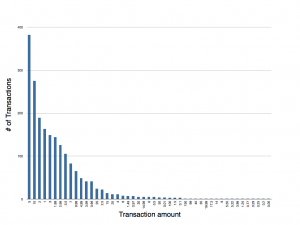
In this chart, you can see a histogram of the total number of successful transactions for each amount paid. The top 6 amounts are all $5 or under, with the notable exception of the $10 category. Let’s take a look at the total revenue in each transaction bucket:
 When we look at transactions and sort by total revenue per bucket, the story unfolds in an interesting way. In this chart, you can see that the $10 contribution generates a majority of revenue for the measured six week period, especially when combined with the $9.99 bucket. What this suggests is that the optimal price appears to be closer to $10 than $5, and that $10 isn’t a significant barrier for contributions.
It’s also great to know that out of 2,031 individual contributions, while 968 were for the requested amount, 742 contributions exceeded the requested amount, 159 went to add-ons with no requested amount, and only 162 were for less than the requested amount.
Of course, this isn’t a scientifically rigorous study, as the sample size is still too small for any strong conclusions, but it’s good to note that app store pricing doesn’t appear to apply to an ecosystem where all add-ons are free and paid contributions are strictly voluntary. If a developer creates a great add-on and asks for $10, that double digit price doesn’t appear to be a barrier to donating. In other words, add-ons users who enjoy using add-ons are also quite generous when they elect to donate contributions to those add-ons.
In future blog posts, we’ll explore the effect of employing the different mechanisms we have for letting users know about contributions.


Michael Kaply wrote on
Michael wrote on
Vin wrote on
seo wales wrote on
Chuck Baker wrote on
Vin wrote on
Top Glendale wrote on