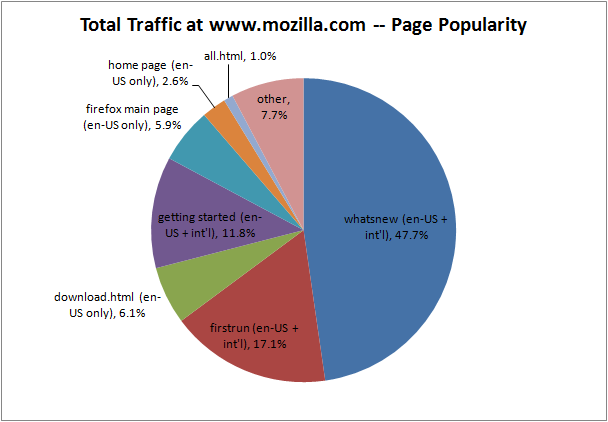
As we’ve found before, sometimes the simplest analysis can deliver the most startling visualization or impact. Our latest example revolves around traffic to www.mozilla.com. Looking at nearly 1.5 Billion page views over the past six months, here is the portfolio of pages visited:
The chart above shows us two different flavors of pages – what I would describe as “product driven” and “user driven”. Visits to product driven pages are directly associated with the Firefox product itself. For example, when a user downloads Firefox, he/she automatically hits our download confirmation page (download.html). When a user successfully installs Firefox, he/she sees our firstrun page. And when there’s a Firefox update or release, the user hits our whatsnew, or update, page. These “product driven” page views — the three biggest slices that you see above — account for 70% of the total traffic at www.mozilla.com.
(Please note that the numbers for some pages include both en-US and localized traffic, whereas other pages only apply to en-US.)
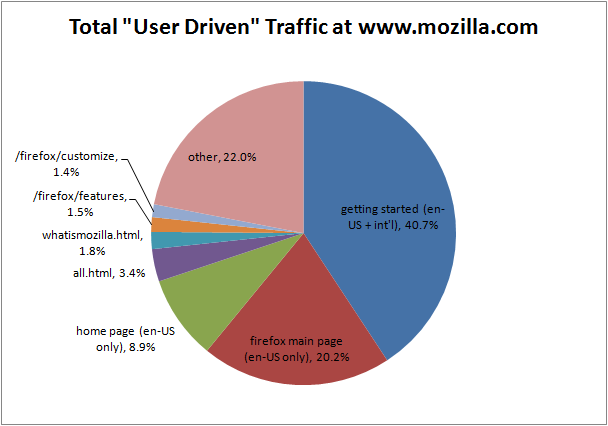
Conversely, I would describe “user driven” traffic as a user making a conscious decision to view a particular page. This includes visits to our homepage, the main Firefox product page, and other typical pages found within the www.mozilla.com site. This category of pages accounts for 30% of our traffic.
What stands out above?
The Getting Started page. That 40% slice of the pie is driven by users clicking in one of two areas: the bookmark toolbar or a featured link on the firstrun/install page, both instances where users are consciously clicking on something in order to find out more about using Firefox. More analysis of this page coming soon…

