I have worked on a lot of different things over my twelve years at Mozilla. Some numbers:
Two areas of work stand out for me.
I have a lot of memories, and the ones relating to these two projects are at the forefront. Thank you to everyone I’ve worked with. It’s been a good time.
As I understand it, this blog will stay up in read-only mode indefinitely. I will make a copy of all the posts and if it ever goes down I will rehost them at my personal site.
All the best to everyone.
]]>So I thought I would wrap up my “How to speed up the Rust compiler” series, which started in 2016.
I wrote ten “How to speed up the Rust compiler” posts.
memcpy
, and several improving the ObligationForest
data structure. It discussed some PRs by others that reduced library code bloat. I also included a table of overall performance changes since the previous post, something that I continued doing in subsequent posts.Beyond those, I wrote several other posts related to Rust compilation.
As well as sharing the work I’d been doing, a goal of the posts was to show that there are people who care about Rust compiler performance and that it was actively being worked on.
Boiling down compiler speed to a single number is difficult, because there are so many ways to invoke a compiler, and such a wide variety of workloads. Nonetheless, I think it’s not inaccurate to say that the compiler is at least 2-3x faster than it was a few years ago in many cases. (This is the best long-range performance tracking I’m aware of.)
When I first started profiling the compiler, it was clear that it had not received much in the way of concerted profile-driven optimization work. (It’s only a small exaggeration to say that the compiler was basically a stress test for the allocator and the hash table implementation.) There was a lot of low-hanging fruit to be had, in the form of simple and obvious changes that had significant wins. Today, profiles are much flatter and obvious improvements are harder for me to find.
My approach has been heavily profiler-driven. The improvements I did are mostly what could be described as “bottom-up micro-optimizations”. By that I mean they are relatively small changes, made in response to profiles, that didn’t require much in the way of top-down understanding of the compiler’s architecture. Basically, a profile would indicate that a piece of code was hot, and I would try to either (a) make that code faster, or (b) avoid calling that code.
It’s rare that a single micro-optimization is a big deal, but dozens and dozens of them are. Persistence is key.
I spent a lot of time poring over profiles to find improvements. I have measured a variety of different things with different profilers. In order of most to least useful:
counts
)cargo-llvm-lines
)memcpy
s (DHAT)Every time I did a new type of profiling, I found new things to improve. Often I would use multiple profilers in conjunction. For example, the improvements I made to DHAT for tracking allocations and memcpy
s were spurred by Cachegrind/Callgrind’s outputs showing that malloc
/free
and memcpy
were among the hottest functions for many benchmarks. And I used counts
many times to gain insight about a piece of hot code.
Off the top of my head, I can think of some unexplored (by me) profiling territories: self-profiling/queries, threading stuff (e.g. lock contention, especially in the parallel front-end), cache misses, branch mispredictions, syscalls, I/O (e.g. disk activity). Also, there are lots of profilers out there, each one has its strengths and weaknesses, and each person has their own areas of expertise, so I’m sure there are still improvement to be found even for the profiling metrics that I did consider closely.
I also did two larger “architectural” or “top-down” changes: pipelined compilation and LLVM bitcode elision. These kinds of changes are obviously great to do when you can, though they require top-down expertise and can be hard for newcomers to contribute to. I am pleased that there is an incremental compilation working group being spun up, because I think that is an area where there might be some big performance wins.
Good benchmarks are important because compiler inputs are complex and highly variable. Different inputs can stress the compiler in very different ways. I used rustc-perf
almost exclusively as my benchmark suite and it served me well. That suite changed quite a bit over the past few years, with various benchmarks being added and removed. I put quite a bit of effort into getting all the different profilers to work with its harness. Because rustc-perf
is so well set up for profiling, any time I needed to do some profiling of some new code I would simply drop it into my local copy of rustc-perf
.
Compilers are really nice to profile and optimize because they are batch programs that are deterministic or almost-deterministic. Profiling the Rust compiler is much easier and more enjoyable than profiling Firefox, for example.
Contrary to what you might expect, instruction counts have proven much better than wall times when it comes to detecting performance changes on CI, because instruction counts are much less variable than wall times (e.g. ±0.1% vs ±3%; the former is highly useful, the latter is barely useful). Using instruction counts to compare the performance of two entirely different programs (e.g. GCC vs clang) would be foolish, but it’s reasonable to use them to compare the performance of two almost-identical programs (e.g. rustc before PR #12345 and rustc after PR #12345). It’s rare for instruction count changes to not match wall time changes in that situation. If the parallel version of the rustc front-end ever becomes the default, it will be interesting to see if instruction counts continue to be effective in this manner.
I was surprised by how many people said they enjoyed reading this blog post series. (The positive feedback partly explains why I wrote so many of them.) The appetite for “I squeezed some more blood from this stone” tales is high. Perhaps this relates to the high level of interest in Rust, and also the pain people feel from its compile times. People also loved reading about the failed optimization attempts.
Many thanks to all the people who helped me with this work. In particular:
rustc-perf
and the CI performance infrastructure, and helping me with many rustc-perf
changes;Rust’s existence and success is something of a miracle. I look forward to being a Rust user for a long time. Thank you to everyone who has contributed, and good luck to all those who will contribute to it in the future!
]]>First up is a process change: I have started doing weekly performance triage. Each Tuesday I have been looking at the performance results of all the PRs merged in the past week. For each PR that has regressed or improved performance by a non-negligible amount, I add a comment to the PR with a link to the measurements. I also gather these results into a weekly report, which is mentioned in This Week in Rust, and also looked at in the weekly compiler team meeting.
The goal of this is to ensure that regressions are caught quickly and appropriate action is taken, and to raise awareness of performance issues in general. It takes me about 45 minutes each time. The instructions are written in such a way that anyone can do it, though it will take a bit of practice for newcomers to become comfortable with the process. I have started sharing the task around, with Mark Rousskov doing the most recent triage.
This process change was inspired by the “Regressions prevented” section of an excellent blost post from Nikita Popov (a.k.a. nikic), about the work they have been doing to improve the speed of LLVM. (The process also takes some ideas from the Firefox Nightly crash triage that I set up a few years ago when I was leading Project Uptime.)
The speed of LLVM directly impacts the speed of rustc, because rustc uses LLVM for its backend. This is a big deal in practice. The upgrade to LLVM 10 caused some significant performance regressions for rustc, though enough other performance improvements landed around the same time that the relevant rustc release was still faster overall. However, thanks to nikic’s work, the upgrade to LLVM 11 will win back much of the performance lost in the upgrade to LLVM 10.
It seems that LLVM performance perhaps hasn’t received that much attention in the past, so I am pleased to see this new focus. Methodical performance work takes a lot of time and effort, and can’t effectively be done by a single person over the long-term. I strongly encourage those working on LLVM to make this a team effort, and anyone with the relevant skills and/or interest to get involved.
There have also been some major improvements to rustc-perf, the performance suite and harness that drives perf.rust-lang.org, and which is also used for local benchmarking and profiling.
#683: The command-line interface for the local benchmarking and profiling commands was ugly and confusing, so much so that one person mentioned on Zulip that they tried and failed to use them. We really want people to be doing local benchmarking and profiling, so I filed this issue and then implemented PRs #685 and #687 to fix it. To give you an idea of the improvement, the following shows the minimal commands to benchmark the entire suite.
# Old target/release/collector --db <DB> bench_local --rustc <RUSTC> --cargo <CARGO> <ID>
# New target/release/collector bench_local <RUSTC> <ID>
Full usage instructions are available in the README.
#675: Joshua Nelson added support for benchmarking rustdoc. This is good because rustdoc performance has received little attention in the past.
#699, #702, #727, #730: These PRs added some proper CI testing for the local benchmarking and profiling commands, which had a history of being unintentionally broken.
Mark Rousskov also made many small improvements to rustc-perf, including reducing the time it takes to run the suite, and improving the presentation of status information.
Last year I wrote about inlining and code bloat, and how they can have a major effect on compile times. I mentioned that tooling to measure code size would be helpful. So I was happy to learn about the wonderful cargo-llvm-lines, which measures how many lines of LLVM IR generated for each function. The results can be surprising, because generic functions (especially commons ones like Vec::push()
, Option::map()
, and Result::map_err()
) can be instantiated dozens or even hundreds of times in a single crate.
I worked on multiple PRs involving cargo-llvm-lines.
#15: This PR added percentages to the output of cargo-llvm-lines, making it easier to tell how important each function’s contribution is to the total amount of code.
#20, #663: These PRs added support for cargo-llvm-lines within rustc-perf, which made it easy to measure the LLVM IR produced for the standard benchmarks.
#72013: RawVec::grow()
is a function that gets called by Vec::push()
. It’s a large generic function that deals with various cases relating to the growth of vectors. This PR moved most of the non-generic code into a separate non-generic function, for wins of up to 5%.
(Even after that PR, measurements show that the vector growth code still accounts for a non-trivial amount of code, and it feels like there is further room for improvement. I made several failed attempts to improve it further: #72189, #73912, #75093, #75129. Even though they reduced the amount of LLVM IR generated, they were performance losses. I suspect this is because these additional changes affected the inlining of some of these functions, which can be hot.)
#72166: This PR added some specialized Iterator
methods (for_each()
, all()
, any()
, find()
, find_map()
) for slices, winning up to 9% on clap-rs
, and up to 2% on various other benchmarks.
#72139: This PR added a direct implementation for Iterator::fold()
, replacing the old implementation that called the more general Iterator::try_fold()
. This won up to 2% on several benchmarks.
#73882: This PR streamlined the code in RawVec::allocate_in()
, winning up to 1% on numerous benchmarks.
cargo-llvm-lines is also useful to application/crate authors. For example, Simon Sapin managed to speed up compilation of the largest crate in Servo by 28%! Install it with cargo install cargo-llvm-lines
and then run it with cargo llvm-lines
(for debug builds) or cargo llvm-lines --release
(for release builds).
#71942: this PR shrunk the LocalDecl
type from 128 bytes to 56 bytes, reducing peak memory usage of a few benchmarks by a few percent.
#72227: If you push multiple elements onto an empty Vec
it has to repeatedly reallocate memory. The growth strategy in use resulted in the following sequence of capacities: 0, 1, 2, 4, 8, 16, etc. “Tiny vecs are dumb”, so this PR changed it to 0, 4, 8, 16, etc., in most cases, which reduced the number of allocations done by rustc itself by 10% or more and sped up many benchmarks by up to 4%. In theory, the change could increase memory usage, but in practice it doesn’t.
#74214: This PR eliminated some symbol interner accesses, for wins of up to 0.5%.
#74310: This PR changed SparseBitSet
to use an ArrayVec
instead of a SmallVec
for its storage, which is possible because the maximum length is known in advance, for wins of up to 1%.
#75133: This PR eliminated two fields in a struct that were only used in the printing of an error message in the case of an internal compiler error, for wins of up to 2%.
Since my last blog post, changes in compile times have been mixed (table, graphs). It’s disappointing to not see a sea of green in the table results like last time, and there are many regressions that seem to be alarming. But it’s not as bad as it first seems! Understanding this requires knowing a bit about the details of the benchmark suite.
Most of the benchmarks that saw large percentage regressions are extremely short-running. (The benchmark descriptions help make this clearer.) For example a non-incremental check build of helloworld
went from 0.03s to 0.08s. (#70107 and #74682) are two major causes.) In practice, a tiny additional overhead of a few 10s of milliseconds per crate isn’t going to be noticeable when many crates take seconds or tens of seconds to compile.
Among the “real-world” benchmarks, some of them saw mixed results (e.g. regex
, ripgrep
), while some of them saw clear improvement, some of which were large (e.g. clap-rs
, style-servo
, webrender
, webrender-wrench
).
With all that in mind, since my last post, the compiler is probably either no slower or somewhat faster for most real-world cases.
Another interesting data point about the speed of rustc over the long-term came from Hacker News: compilation of one project (lewton) got 2.5x faster over the past three years.
LLVM 11 hasn’t landed yet, so that will give some big improvements for real-world cases soon. Hopefully for my next post the results will be more uniformly positive.
]]>
I started the year by profiling incremental compilation and making several improvements there.
#68914: Incremental compilation pushes a great deal of data through a hash function, called SipHasher128
, to determine what code has changed since the last compiler invocation. This PR greatly improved the extraction of bytes from the input byte stream (with a lot of back and forth to ensure it worked on both big-endian and little-endian platforms), giving incremental compilation speed-ups of up to 13% across many benchmarks. It also added a lot more comments to explain what is going on in that code, and removed multiple uses of unsafe
.
#69332: This PR reverted the part of #68914 that changed the u8to64_le
function in a way that made it simpler but slower. This didn’t have much impact on performance because it’s not a hot function, but I’m glad I caught it in case it gets used more in the future. I also added some explanatory comments so nobody else will make the same mistake I did!
#69050: LEB128 encoding is used extensively within Rust crate metadata. Michael Woerister had previously sped up encoding and decoding in #46919, but there was some fat left. This PR carefully minimized the number of operations in the encoding and decoding loops, almost doubling their speed, and giving wins on many benchmarks of up to 5%. It also removed one use of unsafe
. In the PR I wrote a detailed description of the approach I took, covering how I found the potential improvement via profiling, the 18 different things I tried (10 of which improved speed), and the final performance results.
Last year I noticed from profiles that rustc spends some time compressing the LLVM bitcode it produces, especially for debug builds. I tried changing it to not compress the bitcode, and that gave some small speed-ups, but also increased the size of compiled artifacts on disk significantly.
Then Alex Crichton told me something important: the compiler always produces both object code and bitcode for crates. The object code is used when compiling normally, and the bitcode is used when compiling with link-time optimization (LTO), which is rare. A user is only ever doing one or the other, so producing both kinds of code is typically a waste of time and disk space.
In #66598 I tried a simple fix for this: add a new flag to rustc that tells it to omit the LLVM bitcode. Cargo could then use this flag whenever LTO wasn’t being used. After some discussion we decided it was too simplistic, and filed issue #66961 for a more extensive change. That involved getting rid of the use of compressed bitcode by instead storing uncompressed bitcode in a section in the object code (a standard format used by clang), and introducing the flag for Cargo to use to disable the production of bitcode.
The part of rustc that deals with all this was messy. The compiler can produce many different kinds of output: assembly code, object code, LLVM IR, and LLVM bitcode in a couple of possible formats. Some of these outputs are dependent on other outputs, and the choices on what to produce depend on various command line options, as well as details of the particular target platform. The internal state used to track output production relied on many boolean values, and various nonsensical combinations of these boolean values were possible.
When faced with messy code that I need to understand, my standard approach is to start refactoring. I wrote #70289, #70345, and #70384 to clean up code generation, #70297, #70729 , and #71374 to clean up command-line option handling, and #70644 to clean up module configuration. Those changes gave me some familiarity with the code, simplifed it, and I was then able to write #70458 which did the main change.
Meanwhile, Alex Crichton wrote the Cargo support for the new -Cembed-bitcode=no
option (and also answered a lot of my questions). Then I fixed rustc-perf so it would use the correct revisions of rustc and Cargo together, without which the the change would erroneously look like a performance regression on CI. Then we went through a full compiler-team approval and final comment period for the new command-line option, and it was ready to land.
Unfortunately, while running the pre-landing tests we discovered that some linkers can’t handle having bitcode in the special section. This problem was only discovered at the last minute because only then are all tests run on all platforms. Oh dear, time for plan B. I ended up writing #71323 which went back to the original, simple approach, with a flag called -Cbitcode-in-rlib=no
. [EDIT: note that libstd is still compiled with -Cbitcode-in-rlib=yes
, which means that libstd rlibs will still work with both LTO and non-LTO builds.]
The end result was one of the bigger performance improvements I have worked on. For debug builds we saw wins on a wide range of benchmarks of up to 18%, and for opt builds we saw wins of up to 4%. The size of rlibs on disk has also shrunk by roughly 15-20%. Thanks to Alex for all the help he gave me on this!
Anybody who invokes rustc directly instead of using Cargo might want to use -Cbitcode-in-rlib=no
to get the improvements.
[EDIT (May 7, 2020): Alex subsequently got the bitcode-in-object-code-section approach working in #71528 by adding the appropriate “ignore this section, linker” incantations to the generated code. He then changed the option name back to the original -Cembed-bitcode=no
in #71716. Thanks again, Alex!]
#67079: Last year in #64545 I introduced a variant of the shallow_resolved
function that was specialized for a hot calling pattern. This PR specialized that function some more, winning up to 2% on a couple of benchmarks.
#67340: This PR shrunk the size of the Nonterminal
type from 240 bytes to 40 bytes, reducing the number of memcpy
calls (because memcpy
is used to copy values larger than 128 bytes), giving wins on a few benchmarks of up to 2%.
#68694: InferCtxt
is a type that contained seven different data structures within RefCell
s. Several hot operations would borrow most or all of the RefCell
s, one after the other. This PR grouped the seven data structures together under a single RefCell
in order to reduce the number of borrows performed, for wins of up to 5%.
#68790: This PR made a couple of small improvements to the merge_from_succ
function, giving 1% wins on a couple of benchmarks.
#68848: The compiler’s macro parsing code had a loop that instantiated a large, complex value (of type Parser
) on each iteration, but most of those iterations did not modify the value. This PR changed the code so it initializes a single Parser
value outside the loop and then uses Cow
to avoid cloning it except for the modifying iterations, speeding up the html5ever
benchmark by up to 15%. (An aside: I have used Cow
several times, and while the concept is straightforward I find the details hard to remember. I have to re-read the documentation each time. Getting the code to work is always fiddly, and I’m never confident I will get it to compile successfully… but once I do it works flawlessly.)
#69256: This PR marked with #[inline]
some small hot functions relating to metadata reading and writing, for 1-5% improvements across a number of benchmarks.
#70837: There is a function called find_library_crate
that does exactly what its name suggests. It did a lot of repetitive prefix and suffix matching on file names stored as PathBuf
s. The matching was slow, involving lots of re-parsing of paths within PathBuf
methods, because PathBuf
isn’t really designed for this kind of thing. This PR pre-emptively extracted the names of the relevant files as strings and stored them alongside the PathBuf
s, and changed the matching to use those strings instead, giving wins on various benchmarks of up to 3%.
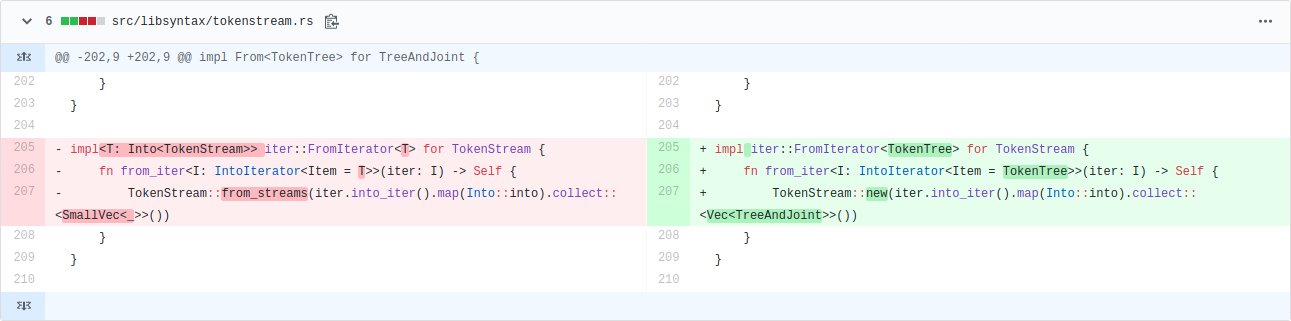
#70876: Cache::predecessors
is an oft-called function that produces a vector of vectors, and the inner vectors are usually small. This PR changed the inner vector to a SmallVec
for some very small wins of up to 0.5% on various benchmarks.
I added support to rustc-perf for the compiler’s self-profiler. This gives us one more profiling tool to use on the benchmark suite on local machines.
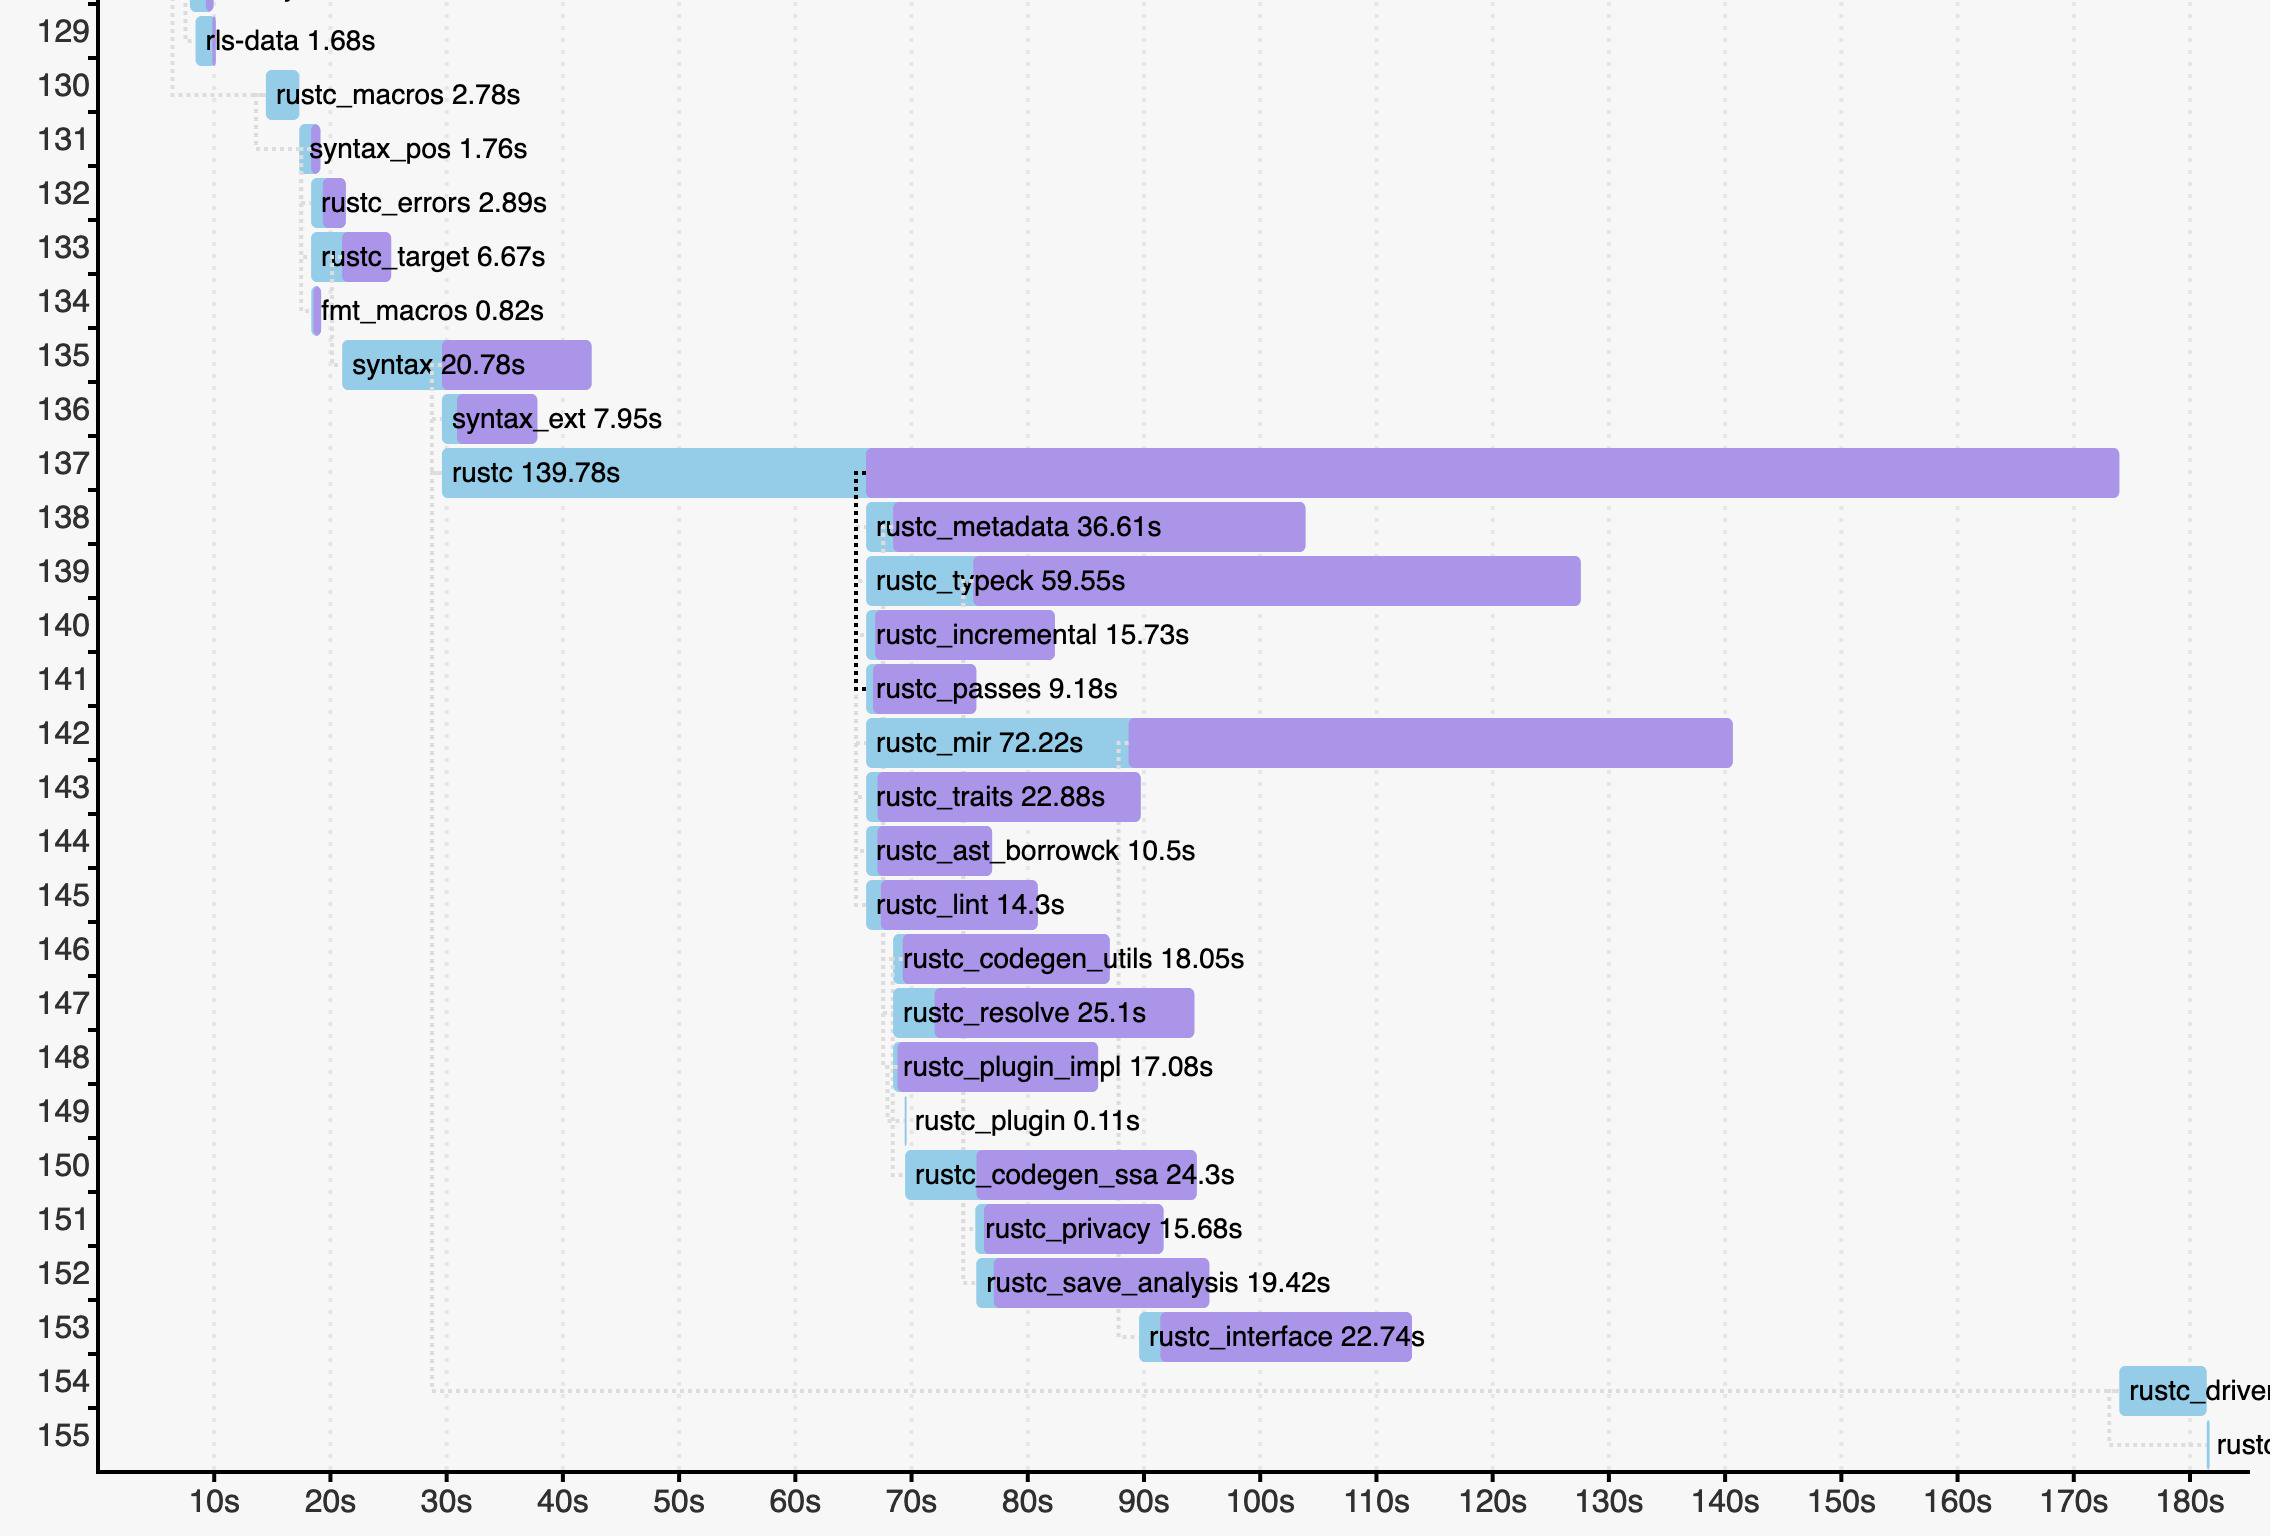
I found that using LLD as the linker when building rustc itself reduced the time taken for linking from about 93 seconds to about 41 seconds. (On my Linux machine I do this by preceding the build command with RUSTFLAGS="-C link-arg=-fuse-ld=lld"
.) LLD is a really fast linker! #39915 is the three-year old issue open for making LLD the default linker for rustc, but unfortunately it has stalled. Alexis Beingessner wrote a nice summary of the current situation. If anyone with knowledge of linkers wants to work on that issue, it could be a huge win for many Rust users.
Not everything I tried worked. Here are some notable failures.
#69152: As mentioned above, #68914 greatly improved SipHasher128
, the hash function used by incremental compilation. That hash function is a 128-bit version of the default 64-bit hash function used by Rust hash tables. I tried porting those same improvements to the default hasher. The goal was not to improve rustc’s speed, because it uses FxHasher
instead of default hashing, but to improve the speed of all Rust programs that do use default hashing. Unfortunately, this caused some compile-time regressions for complex reasons discussed in detail in the PR, and so I abandoned it. I did manage to remove some dead code in the default hasher in #69471, though.
#69153: While working on #69152, I tried switching from FxHasher
back to the improved default hasher (i.e. the one that ended up not landing) for all hash tables within rustc. The results were terrible; every single benchmark regressed! The smallest regression was 4%, the largest was 85%. This demonstrates (a) how heavily rustc uses hash tables, and (b) how much faster FxHasher
is than the default hasher when working with small keys.
I tried using ahash
for all hash tables within rustc. It is advertised as being as fast as FxHasher
but higher quality. I found it made rustc a tiny bit slower. Also, ahash
is also not deterministic across different builds, because it uses const_random!
when initializing hasher state. This could cause extra noise in perf runs, which would be bad. (Edit: It would also prevent reproducible builds, which would also be bad.)
I tried changing the SipHasher128
function used for incremental compilation from the Sip24 algorithm to the faster but lower-quality Sip13 algorithm. I got wins of up to 3%, but wasn’t confident about the safety of the change and so didn’t pursue it further.
#69157: Some follow-up measurements after #69050 suggested that its changes to LEB128 decoding were not as clear a win as they first appeared. (The improvements to encoding were still definitive.) The performance of decoding appears to be sensitive to non-local changes, perhaps due to differences in how the decoding functions are inlined throughout the compiler. This PR reverted some of the changes from #69050 because my initial follow-up measurements suggested they might have been pessimizations. But then several sets of additional follow-up measurements taken after rebasing multiple times suggested that the reversions sometimes regressed performance. The reversions also made the code uglier, so I abandoned this PR.
#66405: Each obligation held by ObligationForest
can be in one of several states, and transitions between those states occur at various points. This PR reduced the number of states from five to three, and greatly reduced the number of state transitions, which won up to 4% on a few benchmarks. However, it ended up causing some drastic regressions for some users, so in #67471 I reverted those changes.
#60608: This issue suggests using FxIndexSet
in some places where currently an FxHashMap
plus a Vec
are used. I tried it for the symbol table and it was a significant regression for a few benchmarks.
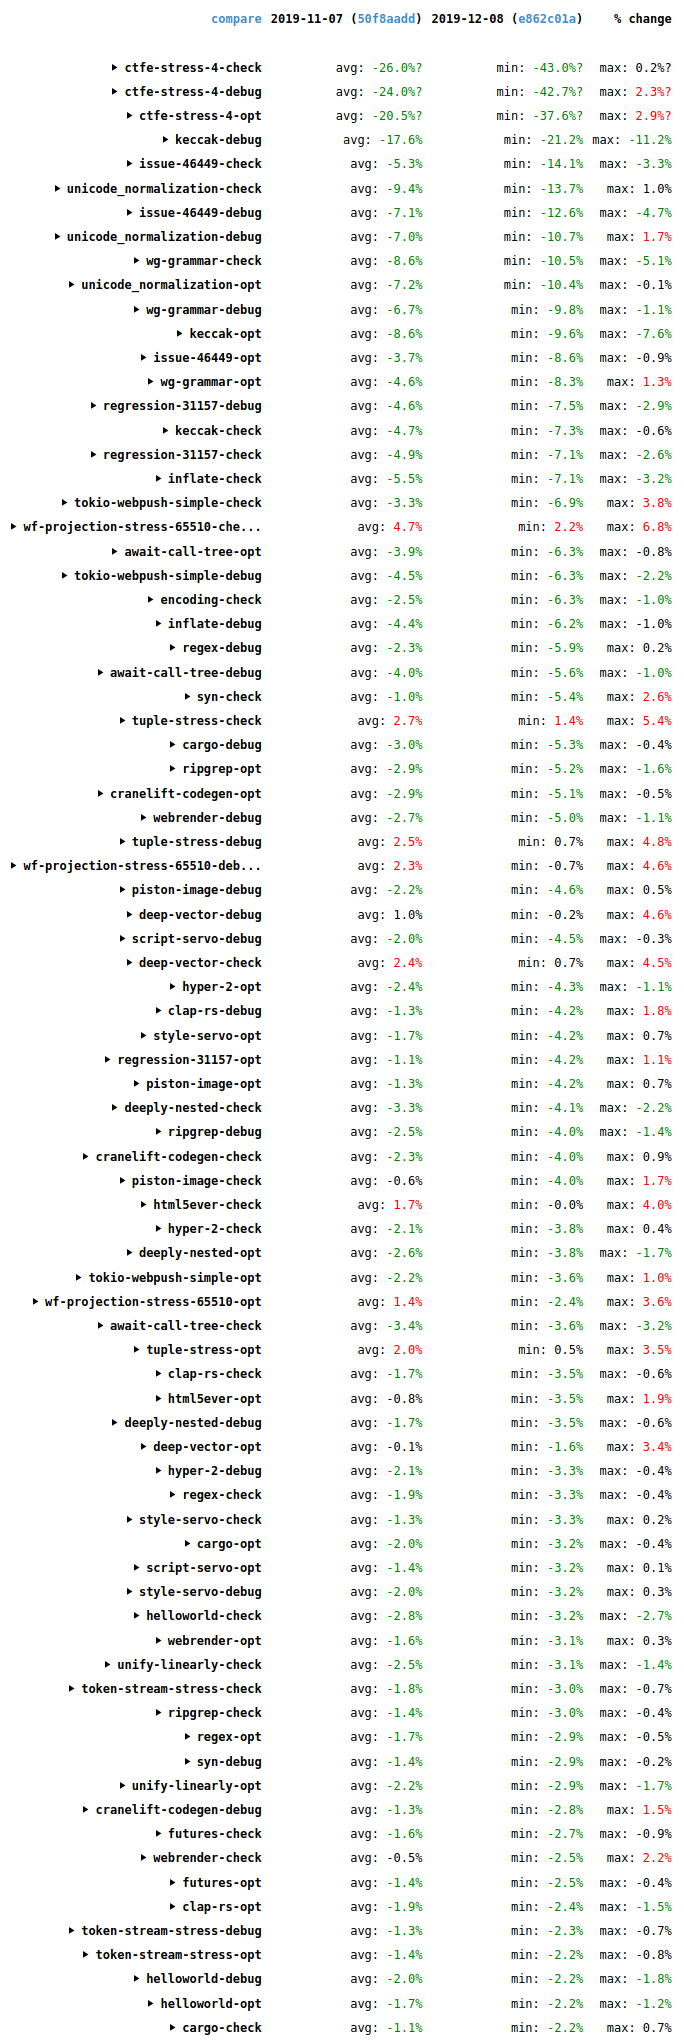
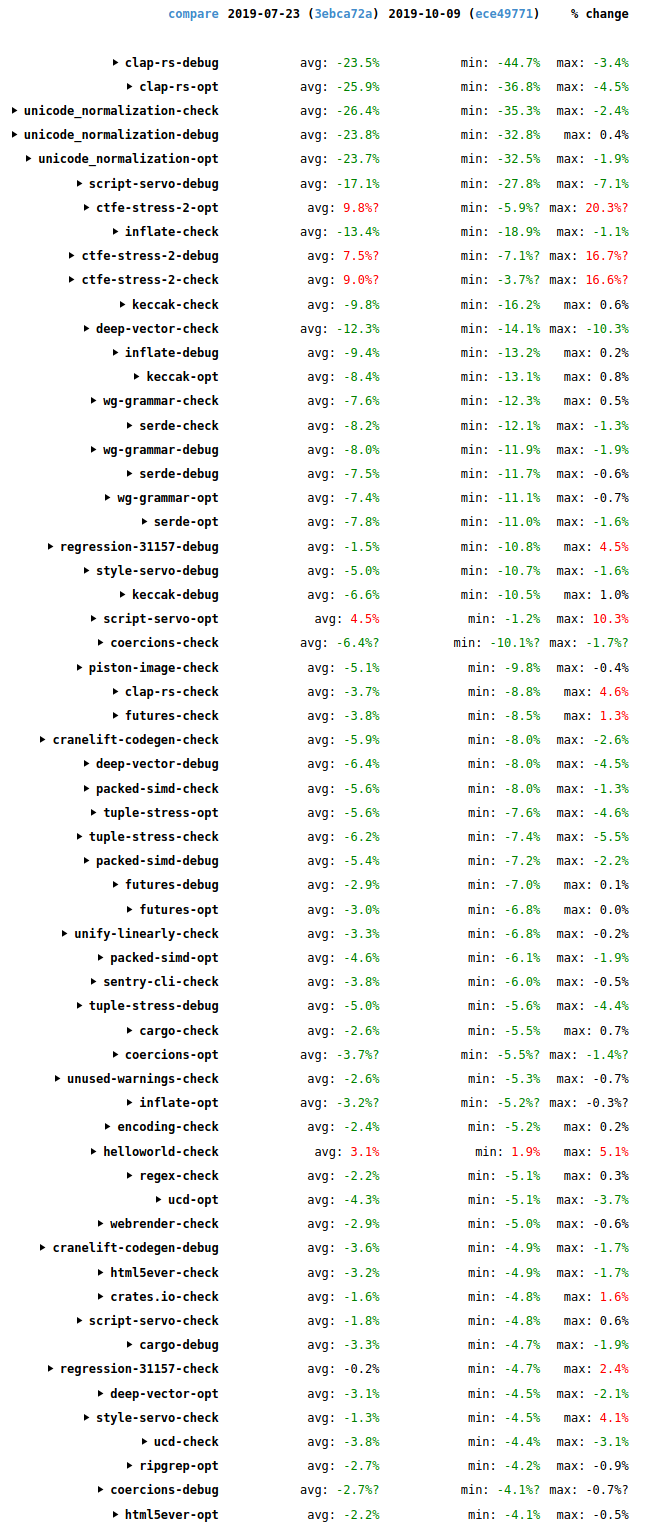
Since my last blog post, compile times have seen some more good improvements. The following screenshot shows wall-time changes on the benchmark suite since then (2019-12-08 to 2020-04-22).
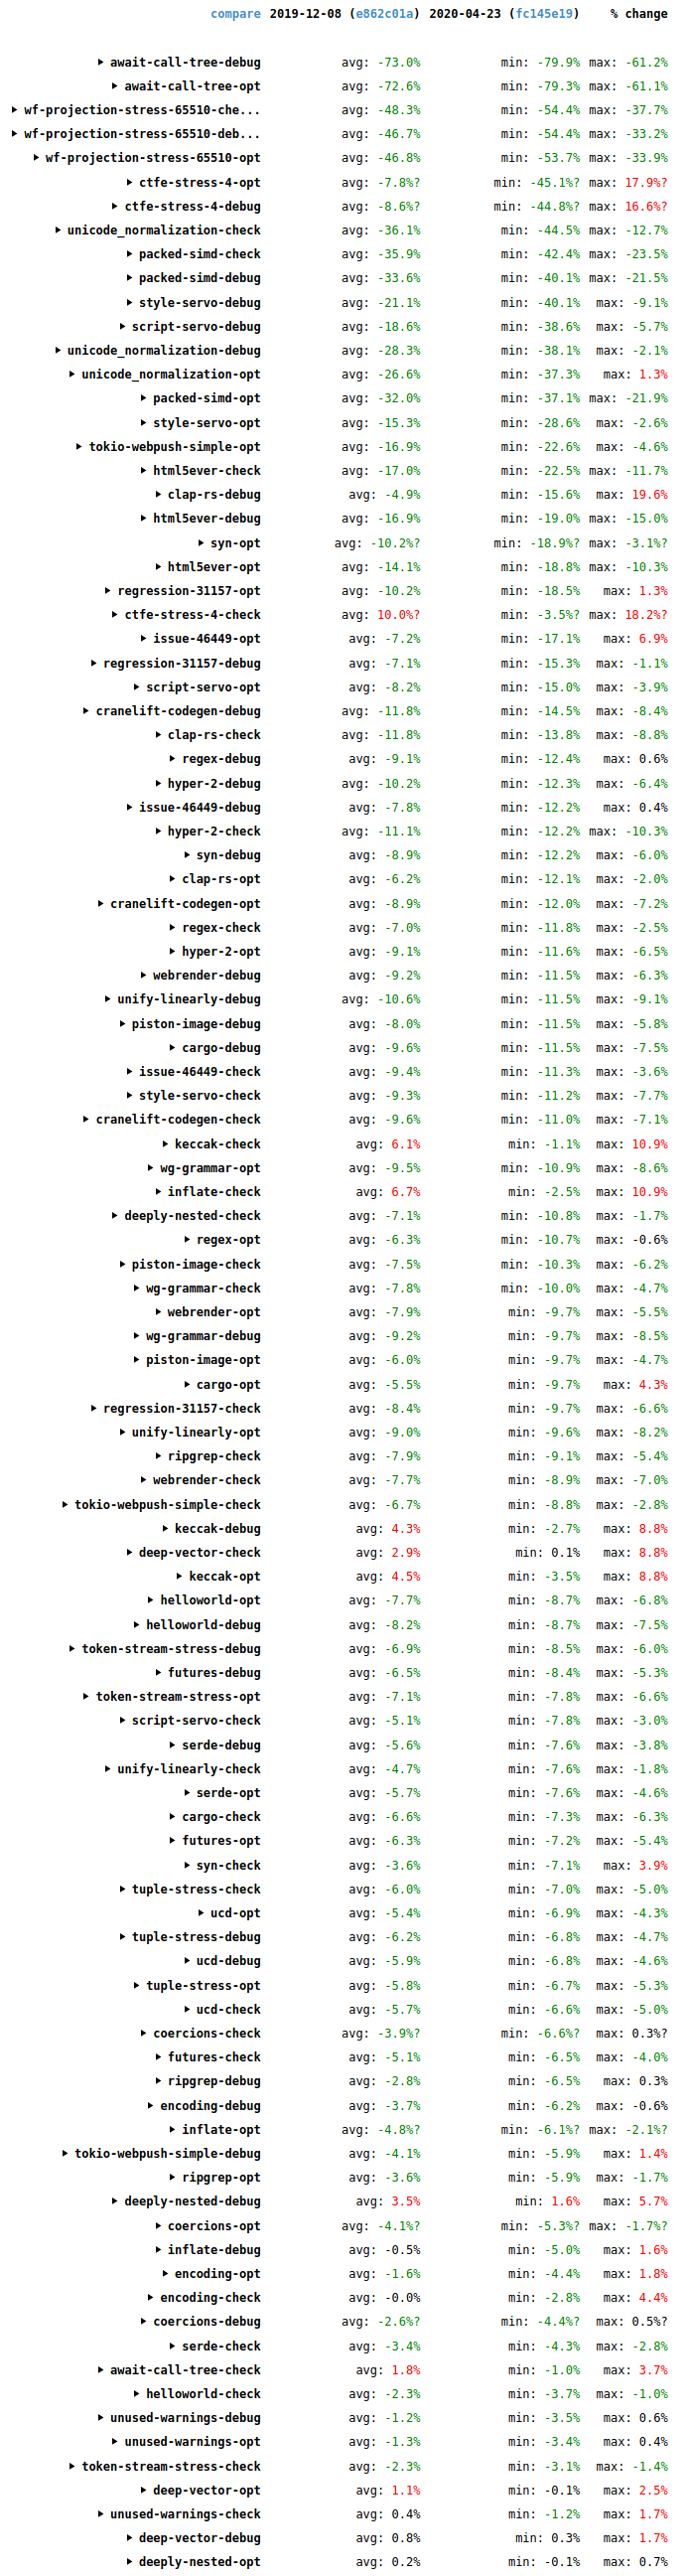
The biggest changes are in the synthetic stress tests await-call-tree-debug
, wf-projection-stress-65510
, and ctfe-stress-4
, which aren’t representative of typical code and aren’t that important.
Overall it’s good news, with many improvements (green), some in the double digits, and relatively few regressions (red). Many thanks to everybody who helped with all the performance improvements that landed during this period.
]]>Within the Firefox code base, a stack fixer is a program that post-processes (“fixes”) the stack frames produced by MozFormatCodeAddress()
, which often lack one or more of: function name, file name, or line number. It reads debug info from binaries (libraries and executables) to do so. It reads from standard input and writes to standard output. Lines matching the special stack frame format are modified appropriately. For example, a line like this in the input that names an executable or library:
#01: ???[tests/example +0x43a0]
is changed to a line in the output that names a function, source file, and line number:
#01: main (/home/njn/moz/fix-stacks/tests/example.c:24)
Lines that do not match the special stack frame format are passed through unchanged.
This process is sometimes called “symbolication”, though I will use “stack fixing” in this post because that’s the term used within the Firefox code base.
Stack fixing is used in two main ways for Firefox.
A developer needs high-quality stack fixing for the stack traces to be useful in either case.
The idea is simple, but the reality isn’t.
Before I started this work, we had three different Python scripts for stack fixing.
fix_linux_stack.py
: This script does native stack fixing on Linux. It farms out most of the work to addr2line
, readelf
, and objdump
.fix_macosx_stack.py
: This script does native stack fixing on Mac. It farms out most of the work to atos
, otool
, and c++filt
.fix_stack_using_bpsyms.py
: This script does stack fixing using Breakpad symbols. It does the work itself.Note that there is no fix_windows_stack.py
script. We did not have a native stack-fixing option for Windows.
This was an inelegant mishmash. More importantly, the speed of these scripts was poor and highly variable. Stack fixing could take anywhere from tens of seconds to tens of minutes, depending on the platform, build configuration, and number of stack frames that needed fixing. For example, on my fast 28-core Linux box I would often have to wait 20 minutes or more to post-process the files from a DMD run.
It would be nice to have a single program that could handle all the necessary formats. It would also be nice if it was much faster than the existing scripts.
Fortunately, the Symbolic Rust crate written by Sentry provided the perfect foundation for such a tool. It provides the multi-platform debug info functionality needed for stack fixing, and also has high performance. In November last year I started a project to implement a new stack fixer in Rust, called fix-stacks
.
First I got it working on Linux. I find Linux is often the easiest platform to get new code working on, at least partly because it’s the platform I’m most familiar with. In this case it was also helped by the fact that on Linux debug info is most commonly stored within the binary (library or executable) that it describes, which avoids the need to find a separate debug info file. The code was straightforward. The Symbolic crate did the hard part of reading the debug info, and my code just had to use the APIs provided to iterate over the parsed data and build up some data structures that could then be searched.
Then I got it working on Windows. I find Windows is often the hardest platform to get new code working on, but that wasn’t the case here. The only complication was that Windows debug info is stored in a PDB file that is separate from the binary, but Symbolic has a function for getting the name of that file from the binary, so it wasn’t hard to add code to look in that separate file.
Then I got it working on Mac. This was by far the hardest platform, for two reasons. First, the code had to handle fat binaries, which contain code for multiple architectures. Fortunately, Symbolic has direct support for fat binaries so that wasn’t too bad.
Second, the normal approach on Mac is to read debug info from the files produced by dsymutil
, in which the debug info is neatly packaged. Unfortunately, dsymutil
is very slow and we try to avoid running it in the Firefox build system if possible. So I took an alternative approach: read the binary’s symbol table and then read debug info from the object files and archive files it mentions. I knew that atos
used this approach, but unfortunately its source code isn’t available, so I couldn’t see exactly what it did. If I couldn’t get the approach working myself the whole project was at risk; a one-tool-to-rule-them-all strategy falls short it if doesn’t work on one platform.
I spent quite some time reading about the Mach-O file format and using the MachOView utility to inspect Mach-O binaries. Symbolic doesn’t provide an API for reading symbol tables, so I had to use the lower-level goblin
crate for that part. (Symbolic uses goblin
itself, which means that fix-stacks
is using goblin
both directly and indirectly.) First I got it working on some very small test files, then on some smaller libraries within Firefox, and finally (to great relief!) on libxul. At each step I had to deal with new complications in the file format that I hadn’t known about in advance. I also had to modify Symbolic itself to handle some edge cases in .o
files.
After that, I got fix-stacks
working on Breakpad symbols. This was more straightforward; the only tricky part was navigating the directory structure that Firefox uses for storing the Breakpad symbols files. (I found out the hard way that the directory structure is different on Windows.)
One final complication is that DMD’s output, which gets run through the stack fixer, is in JSON format. So fix-stacks
has a JSON mode (enabled with --json
) that does the appropriate things with JSON escape characters on both input and output. This took three attempts to get completely right.
The end result is a single program that can fix stacks on all four of the formats we need. The stack traces produced by fix-stacks
are sometimes different to those produced by the old stack fixing scripts. In my experience these differences are minor and you won’t notice them if you aren’t looking for them.
The source code for the first version of fix-stacks
, which only supported Linux, was 275 lines (excluding tests). The current version, with support for Windows, Mac, Breakpad symbols, and JSON handling, is 891 lines (excluding tests).
In comparison, the Symbolic crate is about 20,000 lines of Rust code in total (including tests), and the three sub-crates that fix-stacks
uses (debuginfo
, demangle
, and common
) are 11,400 lines of Rust code. goblin
is another 18,000 lines of code. (That’s what I call “leveraging the ecosystem”!)
Beyond Symbolic and goblin
, the only other external crates that fix-stacks
uses are fxhash
, regex
, and serde_json
.
Testing is important for a tool like this. It’s hard to write test inputs manually in formats like ELF/DWARF, PE/PDB, and Mach-O, so I used clang to generate inputs from some simple C programs. Both the C programs and the binary files generated from them are in the repository.
Some of the generated inputs needed additional changes after they were generated by clang. This is explained by the testing README file:
The stack frames produced by `MozFormatCodeAddress()` contain absolute paths and refer to build files, which means that `fix-stacks` can only be sensibly run on the same machine that produced the stack frames. However, the test inputs must work on any machine, not just the machine that produced those inputs. Furthermore, it is convenient when developing if all the tests works on all platforms, e.g. the tests involving ELF/DWARF files should work on Windows, and the tests involving PE/PDB files should work on Linux. To allow this requires the following. - All paths in inputs must be relative, rather than absolute. - All paths must use forward slashes rather than backslashes as directory separators. (This is because Windows allows both forward slashes and backslashes, but Linux and Mac only allow forward slashes.) This includes the paths in text inputs, and also some paths within executables (such as a PE file's reference to a PDB file).
To satisfy these constraints required some hex-editing of the generated input files. Quoting the README again:
`example-windows.exe` and `example-windows.pdb` were produced on a Windows 10 laptop by clang 9.0 with this command within `tests/`: ``` clang -g example.c -o example-windows.exe ``` `example-windows.exe` was then hex-edited to change the PDB reference from the absolute path `c:\Users\njn\moz\fix-stacks\tests\example-windows.pdb` to the relative path `tests/////////////////////////////example-windows.pdb`. (The use of many redundant forward slashes is a hack to keep the path the same length, which avoids the need for more complex changes to that file.)
A hack, to be sure, but an effective one.
The steps required to produce the Mac test inputs were even more complicated because they involve fat binaries. I was careful to make that README file clearly describe the steps I took to generate all the test inputs. The effort has paid off multiple times when modifying the tests.
Once I had the fix-stacks
working well, I thought that most of the work was done and integrating it into the Firefox build and test system would be straightforward. I was mistaken! The integration ended up being a similar amount of work.
First, I added three new jobs to Mozilla’s Taskcluster instance to build fix-stacks
and make it available for downloading on Windows, Mac, and Linux; this is called a “toolchain”. This required making changes to various Taskcluster configuration files, and writing a shell script containing the build instructions. All of this was new to me, and it isn’t documented, so I had to cargo-cult from similar existing toolchains while asking lots of questions of the relevant experts. You can’t test jobs like these on your own machine so it took me dozens of “try” pushes to Mozilla’s test machines to get it working, with each push taking roughly 10 minutes to complete.
Then I added a wrapper script (fix_stacks.py
) and changed the native stack fixing path in DMD to use it instead of fix_linux_stack.py
or fix_macosx_stack.py
. This took some care, with numerous try pushes to manually check that the stacks produced by fix_stacks.py
were as good as or better than the ones produced by the old scripts. To do this manual checking I first had to deliberately break the DMD test, because the stacks produced are not printed in the test log when the test passes. I also had to update mach bootstrap
so it would install a pre-built fix-stacks
executable in the user’s .mozbuild
directory, which was another unfamiliar part of the code for me. Plus I fixed a problem with the fix-stacks
toolchain for Mac: the fix-stacks
executable was being cross-compiled on a Linux machine, but some errors meant it was not actually cross-compiling, but simply building a Linux executable. Plus I fixed a problem with the fix-stacks
toolchain for Windows: it was building a 64-bit executable, but that wouldn’t work on our 32-bit test jobs; cross-compiling a 32-bit Windows executable on Linux turned out to be the easiest way to fix it. Again, these toolchain fixes took numerous trial-and-error try pushes to get things working. Once it was all working, native stack fixing on Windows was available for DMD for the first time.
Then I changed the native stack fixing path in tests to use fix_stacks.py
. This required some minor changes to fix_stacks.py
‘s output, to make it more closely match that of the old scripts, to satisfy some tests. I also had to modify the Taskcluster configuration to install the fix-stacks
executable in a few extra places; again this required some trial-and-error with try pushes. (Some of those modifications I added after my initial landing attempt was backed out due to causing failures in a tier 2 job that doesn’t run by default on try, *cough*.) At this point, native stack fixing on Windows was available for test output for the first time.
Then I re-enabled stack-fixing for local test runs on Mac. It had been disabled in December 2019 because fixing a single stack typically took at least 15 minutes. With fix_stacks.py
it takes about 30 seconds, and it also now prints out a “this may take a while” message to prepare the user for their 30 second wait.
Along the way, I noticed that one use point of the old stack fixing scripts, in automation.py.in
, was dead code. Geoff Brown kindly removed this dead code.
Then I changed the Breakpad symbols stack fixing path in DMD to use fix_stacks.py
, which was simple.
And then Henrik Skupin noticed that the fix-stacks
executable wasn’t installed when you ran mach bootstrap
for artifact builds, so I fixed that.
And then I was told that I had broken the AWSY-DMD test jobs on Windows. This wasn’t noticed for weeks because those jobs don’t run by default, and to run them on try you must opt into the “full” job list, which is unusual. The problem was some gnarly file locking caused by the way file descriptors are inherited when a child process is spawned on Windows in Python 2; working this out took some time. (It wouldn’t be a problem on Python 3, but unfortunately this code is Python 2 and that cannot be easily changed.) I thought I had a fix, but it caused other problems, and so I ended up disabling stack fixing on Windows for this job, which was a shame, but put us back where we started, with no stack fixing on Windows for that particular job.
And then I changed the Breakpad symbols stack fixing path in tests to use fix_stacks.py
, which seemed simple. But it turns out that tests on Android partly run using code from the current Firefox repository, and partly using code from the “host utils”, which is a snapshot of the Firefox repository from… the last time someone updated the snapshot. (This has something to do with part of the tests actually taking place on Linux machines; I don’t understand the details and have probably mis-described the setup.) The host utils in use at the time was several months old and lacked the fix_stacks.py
script. So Andrew Erickson kindly updated the host utils for me. And then I fixed a few more Taskcluster configuration issues, and then the “simple” fix could land. And then I fixed another configuration issues that showed up later, in a follow-up bug.
And then I removed the old stack fixing scripts because they weren’t being used any more.
And then I found a better solution to the Windows + Python 2 file descriptor issue, allowing me to re-enable stack fixing for the Windows AWSY-DMD job. (With another host utils update, to keep the Android tests working.)
And then I updated all the online documentation I could find that referred to the old scripts, all of it on MDN.
And then I closed the meta-bug that had been tracking all of this work. Hooray!
And then I was told of another obscure test output issue relating to web platform tests, which I have not yet landed a fix for. One lesson here is that changing code that potentially affects the output of every test suite is a fraught endeavour, with the possibility of a long tail of problems showing up intermittently.
I did some speed and peak memory measurements on the two common use cases: fixing many stack frames in a DMD file, and fixing a single stack trace from an assertion failure in a test. The machines I used are: a fast 28-core Linux desktop machine, a 2019 16-inch 8-core MacBook Pro, and an old Lenovo ThinkPad Windows laptop. The fix-stacks
executable is compiled with LTO, because I found it gives speed-ups of up to 30%.
First, the following measurements are for fixing a DMD output file produced by an optimized Firefox build, old vs. new.
(Each platform had a different input file, with some variations in the sizes, so cross-platform comparisons aren’t meaningful.)
On Linux we see a 13x speed-up, and I have seen up to 100x improvements on larger inputs. This is because the old script started quickly, but then each additional stack frame fixed was relatively slow. In comparison, the new script has a slightly higher overhead at start-up but then each additional stack frame fixed is very fast. Memory usage is halved, but still high, because libxul is so large.
On Mac the new script is 30x faster than the old script, but memory usage is more than doubled, interestingly. atos
must have a particularly compact representation of the data.
On Windows we couldn’t natively fix stacks before.
For Breakpad symbols we see a 2x speed-up and peak memory usage is less than one-third.
Second, the following measurements are for fixing a single stack trace produced by a debug Firefox build, old vs. new.
On Linux, both speed and peak memory usage are somewhat worse. Perhaps addr2line
is optimized for doing a small number of lookups.
On Mac the new script is again drastically faster, 33x this time, but memory usage is again more than doubled.
On Windows, again, we couldn’t natively fix stacks before.
For Breakpad symbols we again see a 2x speed-up and peak memory usage of less than one-third.
You might have noticed that the memory usage for the single stack trace was generally higher than for the DMD output. I think this is because the former is an optimized build, while the latter is a debug build.
In summary:
Much of my work using Rust has been on the Rust compiler itself, but that mostly involves making small edits to existing code. fix-stacks
is the third production-quality Rust project I have written from scratch, the others being Firefox’s new prefs parser (just under 1000 lines of code) and counts
(just under 100 lines of code).
My experience in all cases has been excellent.
fix-stacks
project wouldn’t have happened without the third-party Symbolic crate.Rust gives me a feeling of “no compromises” that other languages don’t.
Stack fixing is much better now, and it took more work than I expected!
Many thanks to Mike Hommey, Eric Rahm, and Gabriele Svelto for answering lots of questions and reviewing many patches along the way.
]]>#65750: Normal comments are stripped out during parsing and not represented in the AST. But doc comments have semantic meaning (`/// blah
` is equivalent to the attribute #[doc="blah"]
) and so must be represented explicitly in the AST. Furthermore:
///
or //!
comment markers every separate line is treated as a separate attribute;///
and //!
markers are very common, much more so than those using /** */
or /*! */
markers, particularly in the standard library where doc comment lines often outnumber code lines;As a result, doc comments had a surprisingly high cost. This PR introduced a special, cheaper representation for doc comments, giving wins on many benchmarks, some in excess of 10%.
#65455: This PR avoided some unnecessary conversions from TokenTree
type to the closely related TokenStream
type, avoiding allocations and giving wins on many benchmarks of up to 5%. It included one of the most satisfying commits I’ve made to rustc.
Up to 5% wins by changing only three lines. But what intricate lines they are! There is a lot going on, and they’re probably incomprehensible to anyone not deeply familiar with the relevant types. My eyes used to just bounce off those lines. As is typical for this kind of change, the commit message is substantially longer than the commit itself.
It’s satisfying partly because it shows my knowledge of Rust has improved, particularly Into
and iterators. (One thing I worked out along the way: collect
is just another name for FromIterator::from_iter
.) Having said that, now that a couple of months have passed, it still takes me effort to remember how those lines work.
But even more so, it’s satisfying because it wouldn’t have happened had I not repeatedly simplified the types involved over the past year. They used to look like this:
pub struct TokenStream { kind: TokenStreamKind }; pub enum TokenStreamKind { Empty, Tree(TokenTree), JointTree(TokenTree), Stream(RcVec<TokenStream>), }
(Note the recursion!)
After multiple simplifying PRs (#56737, #57004, #57486, #58476, #65261), they now look like this:
pub struct TokenStream(pub Lrc<Vec<TreeAndJoint>>); pub type TreeAndJoint = (TokenTree, IsJoint); pub enum IsJoint { Joint, NonJoint }
(Note the lack of recursion!)
I didn’t set out to simplify the type for speed, I just found it ugly and confusing. But now it’s simple enough that understanding and optimizing intricate uses is much easier. When those three lines appeared in a profile, I could finally understand them. Refactoring FTW!
(A third reason for satisfaction: I found the inefficiency using the improved DHAT I worked on earlier this year. Hooray for nice tools!)
#65641: This was a nice follow-on from the previous PR. TokenStream
had custom impls of the RustcEncodable
/RustcDecodable
traits. These were necessary when TokenStream
was more complicated, but now that it’s much simpler the derived impls suffice. As well as simplifying the code, the PR won up to 3% on some benchmarks because the custom impls created some now-unnecessary intermediate structures.
#65198: David Tolnay reported that basic concatenation of tokens, as done by many procedural macros, could be exceedingly slow, and that operating directly on strings could be 100x faster. This PR removed quadratic behaviour in two places, both of which duplicated a token vector when appending a new token. (Raise a glass to the excellent Rc::make_mut
function, which I used in both cases.) The PR gave some very small (< 1%) speed-ups on the standard benchmarks but sped up a microbenchmark that exhibited the problem by over 1000x, and made it practical for procedural benchmarks to use tokens. I also added David’s microbenchmark to rustc-perf to avoid future regressions.
#65260: This PR added a special-case check to skip an expensive function call in a hot function, giving a 7% win on the unicode_normalization
benchmark.
#65480: LexicalResolver::iterate_until_fixed_point()
was a hot function that iterated over some constraints, gradually removing them until none remain. The constraints were stored in a SmallVec
and retain
was used to remove the elements. This PR (a) changed the function so it stored the constraints in an immutable Vec
and then used a BitSet
to record which which constraints were still live, and (b) inlined the function at its only call site. These changes won another 7% on unicode_normalization
, but only after I had sped up BitSet
iteration with some micro-optimizations in #65425.
#66537: This PR moved an expensive function call after a test and early return that is almost always taken, giving a 2% win on unicode_normalization
.
#66408: The ObligationForest
type has a vector of obligations that it processes in a fixpoint manner. Each fixpoint iteration involves running an operation on every obligation, which can cause new obligations to be appended to the vector. Previously, newly-added obligations would not be considered until the next fixpoint iteration. This PR changed the code so it would consider those new obligations in the iteration in which they were added, reducing the number of iterations required to reach a fixpoint, and winning up to 8% on a few benchmarks.
#66013: The Rust compiler is designed around a demand-driven query system. Query execution is memoized: when a query is first invoked the compiler will perform the computation and store the result in a hash table, and on subsequent invocations the compiler will return the result from the hash table. For the parallel configuration of rustc this hash table experiences a lot of contention, and so it is sharded; each query lookup has two parts, one to get the shard, and one within the shard. This PR changed things so that the key was only hashed once and the hash value reused for both parts of the lookup, winning up to 3% on the single-threaded configuration of parallel compiler. (It had no benefit for the non-parallel compiler, which is what currently ships, because it does not use sharding.)
#66012: This PR removed the trivial_dropck_outlives
query from the query system because the underlying computation is so simple that it is faster to redo it whenever necessary than to look up the result in the query hash table. This won up to 1% on some benchmarks, and possibly more for the parallel compiler, due to the abovementioned contention over the query hash table.
#65463: The function expand_pattern()
caused many arena allocations where a 4 KiB arena chunk was allocated that only ever held a single small and short-lived allocation. This PR avoided these, reducing the number of bytes allocated by up to 2% for various benchmarks, though the effect on runtime was minimal.
#66540 – This PR changed a Vec
to a SmallVec
in Candidate::match_pairs
, reducing allocation rates for a tiny speed win.
The compiler has an interned string type called Symbol
that is widely used to represent identifiers and other strings. The compiler also had two variants of that type, confusingly called InternedString
and LocalInternedString
. In a series of PRs (#65426, #65545, #65657, #65776) I removed InternedString
and minimized the functionality and uses of LocalInternedString
(and also renamed it as SymbolStr
). This was made possible by Matthew Jasper’s work eliminating gensyms. The changes won up to 1% on various benchmarks, but the real benefit was code simplicity, as issue #60869 described. Like the TokenStream
type I mentioned above, these types had annoyed me for some time, so it was good to get them into a nicer state.
The storage of historical benchmark data changed recently, which (as far as I can tell) makes comparisons to versions earlier than early November difficult. Nonetheless, wall-time results for the past month (2019-11-07 to 2019-12-08) cover the second half of that period, and they are generally good, as the following screenshot shows.
Overall, lots of improvements (green), some in the double digits, and only a small number of regressions (red). It’s a good trend, and it’s not just due to the PRs mentioned above. For example, MIR constant propagation won 2-10% in a lot of cases. It duplicates an optimization that LLVM also does, but performs it earlier in the pipeline when there’s less code. This saves time because it makes LLVM’s job easier, and it also helps the code quality of debug builds where the LLVM constant propagation isn’t run.
All of the above improvements (and most of the ones in my previous posts) I found by profiling with Cachegrind, Callgrind, DHAT, and counts
, but there are plenty of other profilers out there. I encourage anyone who has interest and even slight familiarity with profiling (or a willingness to learn) to give it a try. The Rust compiler is an easy target, profiling-wise, because it’s a batch program that is mostly single-threaded and almost deterministic. (Compare it to Firefox, for example, which is interactive, multi-threaded, and highly non-deterministic.) Give it a go!
The following image shows changes in time taken to compile many of the standard benchmarks used on the Rust performance tracker. It compares a revision of the the compiler from 2019-07-23 with a revision of the compiler from 2019-10-09.
These are the wall-time results. There are three different build kinds measured for each one: a debug build, an optimized build, and a check build (which detects errors but doesn’t generate code). For each build kind there is a mix of incremental and non-incremental runs done. The numbers for the individual runs aren’t shown here but you can see them if you view the results directly on the site and click around. (Note that the site has had some reliability issues lately. Apologies if you have difficulty with that link.) The “avg” column shows the average change for those runs. The “min” and “max” columns show the minimum and maximum changes among those same runs.
There are a few regressions, mostly notably for the ctfe-stress-2
benchmark, which is an artificial stress test of compile-time function evaluation and so isn’t too much of a concern. But there are many more improvements, including double-digit improvements for clap-rs
, inflate
, unicode_normalization
, keccak, wg-grammar
, serde
, deep-vector
, script-servo
, and style-servo
. There have been many interesting things going on.
For a long time, profilers like Cachegrind and Callgrind have shown that 2-6% of the instructions executed by the Rust compiler occur in calls to memcpy
. This seems high! Curious about this, I modified DHAT to track calls to memcpy
, much in the way it normally tracks calls to malloc
.
The results showed that most of the memcpy
calls come from a relatively small number of code locations. Also, all the memcpy
calls involved values that exceed 128 bytes. It turns out that LLVM will use inline code for copies of values that are 128 bytes or smaller. (Inline code will generally be faster, but memcpy
calls will be more compact above a certain copy size.)
I was able to eliminate some of these memcpy
calls in the following PRs.
#64302: This PR shrank the ObligationCauseCode
type from 56 bytes to 32 bytes by boxing two of its variants, speeding up many benchmarks by up to 2.6%. The benefit mostly came because the PredicateObligation
type (which contains an ObligationCauseCode
) shrank from 136 bytes to 112 bytes, which dropped it below the 128 byte memcpy
threshold. I also tried reducing the size of ObligationCauseCode
to 24 bytes by boxing two additional variants, but this had worse performance because more allocations were required.
#64374: The compiler’s parser has this type:
pub type PResult<'a, T> = Result<T, DiagnosticBuilder<'a>
It’s used as the return type for a lot of parsing functions. The T
value is always small, but DiagnosticBuilder
was 176 bytes, so PResult
had a minimum size of 184 bytes. And DiagnosticBuilder
is only needed when there is a parsing error, so this was egregiously inefficient. This PR boxed DiagnosticBuilder
so that PResult
has a minimum size of 16 bytes, speeding up a number of benchmarks by up to 2.6%.
#64394: This PR reduced the size of the SubregionOrigin
type from 120 bytes to 32 bytes by boxing its largest variant, which sped up many benchmarks slightly (by less than 1%). If you are wondering why this type caused memcpy
calls despite being less than 128 bytes, it’s because it is used in a BTreeMap
and the tree nodes exceeded 128 bytes.
One of the biggest causes of memcpy
calls is within a data structure called ObligationForest
, which represents a bunch of constraints (relating to type checking and trait resolution, I think) that take the form of a collection of N-ary trees. ObligationForest
uses a single vector to store the tree nodes, and links between nodes are represented as numeric indices into that vector.
Nodes are regularly removed from this vector by a function called ObligationForest::compress
. This operation is challenging to implement efficiently because the vector can contain thousands of nodes and nodes are removed only a few at a time, and order must be preserved, so there is a lot of node shuffling that occurs. (The numeric indices of all remaining nodes must be updated appropriately afterwards, which further constrains things.) The shuffling requires lots of swap
calls, and each one of those does three memcpy
calls (let tmp = a; a = b; b = tmp
, more or less). And each node is 176 bytes! While trying to get rid of these memcpy
calls, I got very deep into ObligationForest
and made the following PRs that aren’t related to the copying.
#64420: This PR inlined a hot function, speeding up a few benchmarks by up to 2.8%. The function in question is indirectly recursive, and LLVM will normally refuse to inline such functions. But I was able to work around this by using a trick: creating two variants of the function, one marked with #[inline(always)]
(for the hot call sites) and one marked with #[inline(never)]
(for the cold call sites).
#64500: This PR did a bunch of code clean-ups, some of which helped performance to the tune of up to 1.7%. The improvements came from factoring out some repeated expressions, and using iterators and retain
instead of while loops in some places.
#64545: This PR did various things, improving performance by up to 13.8%. The performance wins came from: combining a split parent/descendants representation to avoid frequent chaining of iterators (chained iterators are inherently slower than non-chained iterators); adding a variant of the shallow_resolve
function specialized for the calling pattern at a hot call site; and using explicit iteration instead of Iterator::all
. (More about that last one below.)
#64627: This PR also did various things, improving performance by up to 18.4%. The biggest improvements came from: changing some code that dealt with a vector to special-case the 0-element and 1-element cases, which dominated; and inlining an extremely hot function (using a variant of the abovementioned #[inline(always)]
+ #[inline(never)]
trick).
These PRs account for most of the improvements to the following benchmarks: inflate
, keccak
, cranelift-codegen
, and serde
. Parts of the ObligationForest
code was so hot for these benchmarks (especially inflate
and keccak
) that it was worth micro-optimizing them to the nth degree. When I find hot code like this, there are always two approaches: (a) try to speed it up, or (b) try to avoid calling it. In this case I did (a), but I do wonder if the users of ObligationForest
could be more efficient in how they use it.
The above PRs are a nice success story, but I should also mention that I tried a ton of other micro-optimizations that didn’t work.
drain_filter
in compress
. It was slower.swap_and_remove
instead of swap
in compress
, This gave speed-ups, but changed the order that predicates are processed in, which changed the order and/or contents of error messages produced in lots of tests. I was unable to tell if these error message changes were legitimate — some were simple, but some were not — so I abandoned all approaches that altered predicate order.ObligationForest
nodes, to reduce the number of bytes copied in compress
. It reduced the amount of copying, but was a net slowdown because it increased the number of allocations performed.unsafe
code to remove the swap
calls, but the speed-up was only 1% in the best case and I wasn’t confident that my code was panic-safe, so I abandoned that effort.Amusingly enough, the memcpy
calls in compress
were what started all this, and despite the big wins, I didn’t manage to get rid of them!
I mentioned above that in #64545 I got an improvement by replacing a hot call to Iterator::all
with explicit iteration. The reason I tried this was that I looked at the implementation of Iterator::all
and saw that it was surprisingly complicated: it wrapped the given predicate in a closure that
returned a LoopState
, passed that closure to try_for_each
which
wrapped the first closure in a second closure, and passed that second closure
to try_fold
which did the actual iteration using the second
closure. Phew!
Just for kicks I tried replacing this complex implementation with the obvious, simple implementation, and got a small speed-up on keccak
, which I was using for most of my performance testing. So I did the same thing for three similar Iterator
methods (any
, find
and find_map
), submitted #64572, and did a CI perf run. The results were surprising and extraordinary: 1-5% reductions for many benchmarks, but double-digits for some, and 20-50% reductions for some clap-rs
runs. Uh, what? Investigation showed that the reduction came from LLVM doing less work during code generation. These functions are all marked with #[inline]
and so the simpler versions result in less code for LLVM to process. Sure enough, the big wins all came in debug
and opt
builds, with little effect on check
builds.
This surprised me greatly. There’s been a long-running theory that the LLVM IR produced by the Rust compiler’s front end is low quality, that LLVM takes a long time to optimize it, and more front-end optimization could speed up LLVM’s code generation. #64572 demonstrates a related, but much simpler prospect: we can speed up compilation by making commonly inlined library functions smaller. In hindsight, it makes sense that this would have an effect, but the size of the effect is nonetheless astounding to me.
But there’s a trade-off. Sometimes a simpler, smaller function is slower. For the iterator methods there are some cases where that is true, so the library experts were unwilling to land #64572 as is. Fortunately, it was possible to obtain much of the potential compile time improvements without compromising runtime.
try_fold
for slices that had an unrolled loop that called the given closure four times. This got about 60% of the improvements of #64572.Iterator
methods to call try_fold
directly, removing one closure layer. This got about another 15% of the improvements of #64572.I had a related idea, which was to use simpler versions for debug builds and complex versions for opt builds. I tried three different ways of doing this.
if cfg!(debug_assertions)
within the method bodies.#[cfg(debug_assertions)]
, the other marked with #[cfg(not(debug_assertions))]
.#[cfg_attr(debug_assertions, inline)]
so that the methods are inlined only in optimized builds.None of these worked; they either had little effect or made things worse. I’m hazy on the details of how library functions get incorporated; maybe there’s another way to make this idea work.
In a similar vein, Alex Crichton opened #64846, which changes hashbrown
(Rust’s hash table implementation) so it is less aggressive about inlining. This got some sizeable improvements on some benchmarks (up to 18% on opt
builds of cargo
) but also caused small regressions for a lot of other benchmarks. In this case, the balance between “slower hash tables” and “less code to compile” is delicate, and a final decision is yet to be made.
Overall, this is an exciting new area of investigation for improving Rust compile times. We definitely want new tooling to help identify which library functions are causing the most code bloat. Hopefully these functions can be tweaked so that compile times improve without hurting runtime performance much.
As well as all the above stuff, which all arose due to my investigations into memcpy
calls, I had a few miscellaneous improvements that arose from normal profiling.
#65089: In #64673, simulacrum got up to 30% wins on the unicode_normalization
benchmark by special-casing a type size computation that is extremely hot. (That benchmark is dominated by large match
expressions containing many integral patterns.) Inspired by this, in this PR I made a few changes that moved the special case to a slightly earlier point that avoided even more unnecessary operations, for wins of up to 11% on that same benchmark.
#64949: The following pattern occurs in a few places in the compiler.
let v = self.iter().map(|p| p.fold_with(folder)).collect::<SmallVec<[_; 8]>>()
I.e. we map some values into a SmallVec
. A few of these places are very hot, and in most cases the number of elements produced is 0, 1, or 2. This PR changed those hot locations to handle one or more of the 0/1/2 cases directly without using iteration and SmallVec::collect
, speeding up numerous benchmarks by up to 7.8%.
#64801: This PR avoided a chained iterator in a hot location, speeding up the wg-grammar
benchmark by up to 1.9%.
Finally, in #64112 I tried making pipelinined compilation more aggressive by moving crate metadata writing before type checking and borrow checking. Unfortunately, it wasn’t much of a win, and it would slightly delay error message emission when compiling code with errors, so I abandoned the effort.
]]>The tool extremely easy to use. First, update to the latest Nightly:
rustup update nightly
Then just add -Ztimings
to your build command, e.g.:
cargo +nightly build -Ztimings
At the end of the build it will print the name of an HTML file containing the data. Here’s part of the visualization for the Rust compiler itself:
Full data is available here. (I recommend moving the “Scale” slider to 7 or 8 so that horizontal scrolling isn’t necessary.)
Two things leap out from this visualization.
I also filed #65088 to add -Ztimings
support to the Rust compiler’s own build system. (Enabling the visualization isn’t as simple for the compiler as it is for most Rust projects. The compiler’s build system is complicated by the fact that it’s a bootstrapping compiler that has to be built multiple times.)
We have already heard from multiple people that they used it fix inefficiencies in their crate structure, speeding up their builds significantly. Anyone who works on a sizeable Rust project should try out this tool.
]]>Improving “core strength” by lowering raw compilation times and also generating better code (which in turn can help with compilation times)
The roadmap explainer post has a “polish” section that has the following as the first example.
Compile times and IDE support
I previously wrote about one period of improvement in Rust compiler speed. How are things going in 2019?
The following image shows changes in time taken to compile the standard benchmarks used on the Rust performance tracker. It compares the compiler from 2019-01-01 with the compiler from 2019-07-24 (the most recent data at the time of writing).
These are the wall-time results for 29 benchmarks. There are three different build kinds measured for each one: a debug build, an optimized build, and a check build (which detects errors but doesn’t generate code). For each build kind there is a mix of incremental and non-incremental runs done. The numbers for the individual runs aren’t shown here but you can see them if you view the results directly on the site and click around. The “avg” column shows the average change for those runs. The “min” and “max” columns show the minimum and maximum changes among those same runs.
The table has 261 numbers. The thing to take away is that 258 of them are negative, representing a decrease in compile time. Most of the “avg” values are in the range -20% to -40%. The “min” values (representing the best time reduction for each build kind) range from -12.4% to -51.3%. Even the “max” values (representing the worst time reduction for each build kind) are mostly better than -10%. These are pleasing results.
What happens if we look further back? The image below compares the compiler from 2017-11-12 (the earliest date for which I could get data from the site) against the compiler from 2019-07-24, a period of just over 20 months.
These are the wall-time results for only 18 benchmarks, because the benchmark suite was smaller in late 2017. Check builds were also not measured then. You can view the results directly on the site.
My initial thought from looking at the “avg” results was “the compiler is twice as fast” but closer inspection shows that’s not quite true; the average “avg” result is 42%. (I know that averaging averages is statistically dubious, I did it just to get a rough feel.) Overall, the results are significantly better than those for 2019: the “avg” values range from -19.9% to -61.3%, and the “min” values are mostly better than -60%.
(And don’t forget that time reduction percentages can be misleading when they get large. A 50% time reduction means the compiler is twice as fast; a 75% time reduction means the compiler is four times as fast; a 90% time reduction means the compiler is ten times as fast.)
All this is good news. The Rust compiler has long had a reputation for being slow. I still wouldn’t describe it as fast, but it is clearly a lot faster than it used to be. Many thanks to all those who made this happen, and I would be happy to hear from anyone who wants to help continue the trend!
Thanks to theZcuber for a Reddit post that was the starting point for this article.
]]>libsyntax
has three tables in a global data structure, called Globals
, storing information about spans (code locations), symbols, and hygiene data (which relates to macro expansion). Accessing these tables is moderately expensive, so I found various ways to improve things.
#59693: Every element in the AST has a span, which describes its position in the original source code. Each span consists of an offset, a length, and a third value that is related to macro expansion. The three fields are 12 bytes in total, which is a lot to attach to every AST element, and much of the time the three fields can fit in much less space. So the compiler used a 4 byte compressed form with a fallback to a hash table stored in Globals
for spans that didn’t fit in 4 bytes. This PR changed that to 8 bytes. This increased memory usage and traffic slightly, but reduced the fallback rate from roughly 10-20% to less than 1%, speeding up many workloads, the best by an amazing 14%.
#61253: There are numerous operations that accessed the hygiene data, and often these were called in pairs or trios, thus repeating the hygiene data lookup. This PR introduced compound operations that avoid the repeated lookups. This won 10% on packed-simd, up to 3% on numerous other workloads.
#61484: Similar to #61253, this won up to 2% on many benchmarks.
#60630: The compiler has an interned string type, called symbol. It used this inconsistently. As a result, lots of comparisons were made between symbols and ordinary strings, which required a lookup of the string in the symbols table and then a char-by-char comparison. A symbol-to-symbol comparison is much cheaper, requiring just an integer comparison. This PR removed the symbol-to-string comparison operations, forcing more widespread use of the symbol type. (Fortunately, most of the introduced symbol uses involved statically-known, pre-interned strings, so there weren’t additional interning costs.) This won up to 1% on various benchmarks, and made the use of symbols more consistent.
#60815: Similar to #60630, this also won up to 1% on various benchmarks.
#60467, #60910, #61035, #60973: These PRs avoiding some more unnecessary symbol interning, for sub-1% wins.
The following improvements didn’t have any common theme.
#57719: This PR inlined a very hot function, for a 4% win on one workload.
#58210: This PR changed a hot assertion to run only in debug builds, for a 20%(!) win on one workload.
#58207: I mentioned string interning earlier. The Rust compiler also uses interning for a variety of other types where duplicate values are common, including a type called LazyConst
. However, the intern_lazy_const
function was buggy and didn’t actually do any interning — it just allocated a new LazyConst
without first checking if it had been seen before! This PR fixed that problem, reducing peak memory usage and page faults by 59% on one benchmark.
#59507: The pretty-printer was calling write!
for every space of
indentation, and on some workloads the indentation level can exceed 100. This PR reduced it to a single write!
call in the vast majority of cases, for up to a
7% win on a few benchmarks.
#59626: This PR changed the preallocated size of one data structure to better match what was needed in practice, reducing peak memory usage by 20 MiB on some workloads.
#61612: This PR optimized a hot path within the parser, whereby constant tokens were uselessly subjected to repeated “is it a keyword?” tests, for up to a 7% win on programs with large constants.
The following changes involved improvements to our profiling tools.
#59899: I modified the output of -Zprint-type-sizes
so that enum variants are listed from largest to smallest. This makes it much easier to see outsized variants, especially for enums with many variants.
#62110: I improved the output of the -Ztime-passes
flag by removing some uninteresting entries that bloated the output and adding a measurement for the total compilation time.
Also, I improved the profiling support within the rustc-perf benchmark suite. First, I added support for profiling with OProfile. I admit I haven’t used it enough yet to gain any wins. It seg faults about half the time when I run it, which isn’t encouraging.
Second, I added support for profiling with the new version of DHAT. This blog post is about 2019, but it’s worth mentioning some improvements I made with the new DHAT’s help in Q4 of 2018, since I didn’t write a blog post about that period: #55167, #55346, #55383, #55384, #55501, #55525, #55556, #55574, #55604, #55777, #55558, #55745, #55778, #55905, #55906, #56268, #56090, #56269, #56336, #56369, #56737, and (ena crate) #14.
Finally, I wrote up brief descriptions for all the benchmarks in rustc-perf.
The improvements above (and all the improvements I’ve done before that) can be described as micro-optimizations, where I used profiling data to optimize a small piece of code.
But it’s also worth thinking about larger, systemic improvements to Rust compiler speed. In this vein, I worked in Q2 with Alex Crichton on pipelined compilation, a feature that increases the amount of parallelism available when building a multi-crate Rust project by overlapping the compilation of dependent crates. In diagram form, a compilation without pipelining looks like this:
metadata metadata [-libA----|--------][-libB----|--------][-binary-----------] 0s 5s 10s 15s 20s 30s
With pipelined compilation, it looks like this:
[-libA----|--------] [-libB----|--------] [-binary-----------] 0s 5s 10s 15s 25s
I did the work on the Rust compiler side, and Alex did the work on the Cargo side.
For more details on how it works, how to use it, and lots of measurements, see this thread. The effects are highly dependent on a project’s crate structure and the compiling machine’s configuration. We have seen speed-ups as high as 1.84x, while some projects see no speed-up at all. At worst, it should make things only negligibly slower, because it’s not causing any additional work, just changing the order in which certain things happen.
Pipelined compilation is currently a Nightly-only feature. There is a tracking issue for stabilizing the feature here.
I have a list of things I want to investigate in Q3.
memcpy
a lot; not directly, but the generated code uses it for value moves and possibly other reasons. In “check” builds that don’t do any code generation, typically 2-8% of all instructions executed occur within memcpy
. I want to understand why this is and see if it can be improved. One possibility is moves of excessively large types within the compiler; another possibility is poor code generation. The former would be easier to fix. The latter would be harder to fix, but would benefit many Rust programs.I also have various pieces of Firefox work that I need to do in Q3, so I might not get to all of these. If you are interested in working on these ideas, or anything else relating to Rust compiler speed, please get in touch.
]]>