As the Perf-Tools team, we are responsible for the Firefox Profiler. This newsletter gives an overview of the new features and improvements we’ve done in the first half of 2022.
You can find the previous newsletter here which was about the Q4 2021. This newsletter contains updates related to work done in the first half of 2022.
Here are some highlights.
Documentation
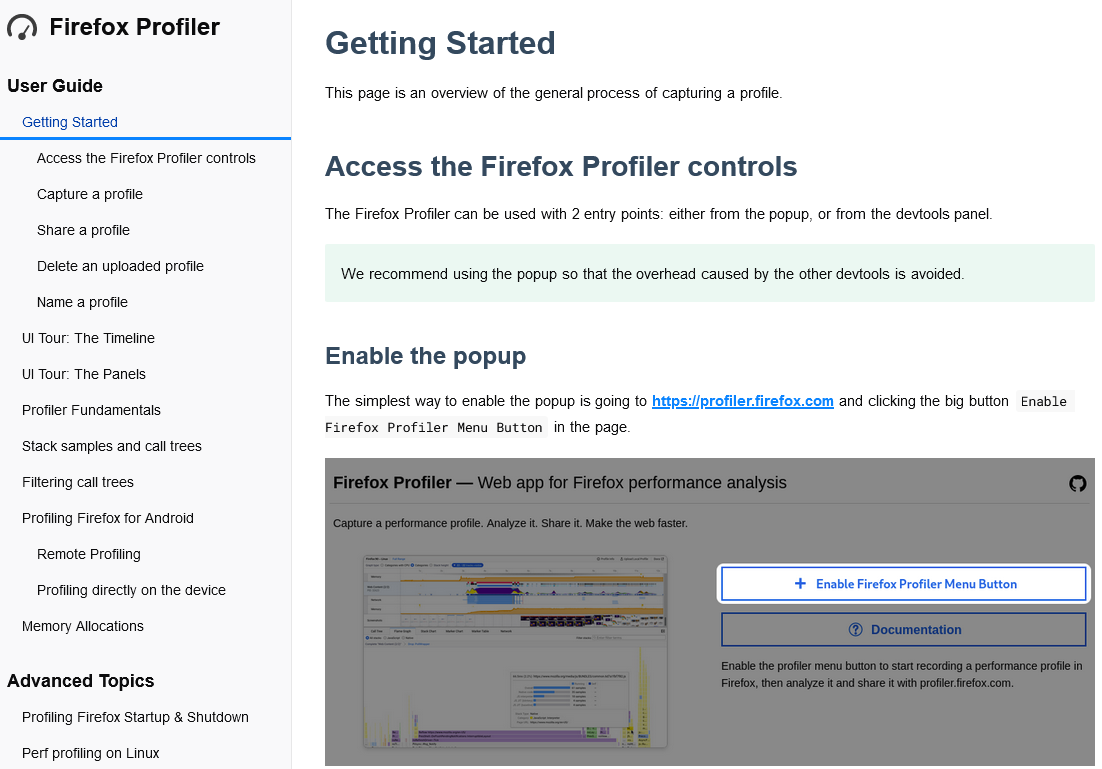
The main Profiler documentation was refreshed, to better match what has changed in recent years.
If you are new to the Profiler, or if you would like your friends, colleagues, or customers to learn about it, please visit: https://profiler.firefox.com/docs/#/./guide-getting-started.
(This link is also accessible from the landing page at https://profiler.firefox.com.)
As a reminder, other aspects of the Profiler are captured in separate locations:
For developers of the Firefox application, or if you are just interested in some technical details, see the internal documentation at https://firefox-source-docs.mozilla.org/tools/profiler/.
For web developers, one point of interest is that you can add “markers” to your own pages through the JavaScript User Timing API, which will then be visible in profiles. This can be useful to measure some specific actions in your web pages.
Finally, the GitHub repository for the front-end side of the Profiler (the website that actually displays profiles after they have been captured) contains some detailed documentation about profile file formats and inner workings of the website.
New DevTools performance panel
The new performance panel was released in Firefox 98. This panel makes it easier for web developers to record and share profiles, as it opens a new profiler.firefox.com tab after capturing the profile.
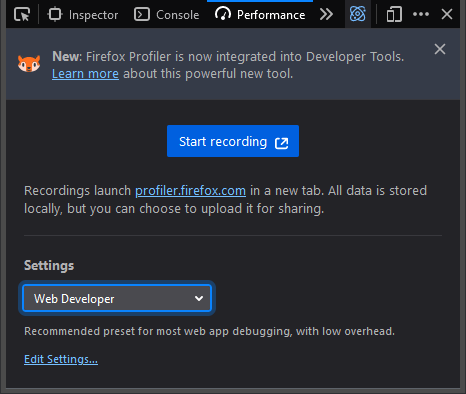
To access it, open the DevTools (main menu > More tools > Web Developer Tools), and select the “Performance” panel.
Note that having the DevTools open may use some processing power, so the resulting profile of any web page may be slightly skewed, with some of the profile data being related to DevTools. If these effects are noticeable in your profiles, just close the DevTools window while profiling. As an alternative, you may choose to control the profiler through the toolbar button (enabled when first visiting https://profiler.firefox.com), or the accompanying shortcuts: Ctrl+Shift+1 to start, and Ctrl+Shift+2 to stop.
Internationalization
The profiler.firefox.com interface is now available in languages other than English, and may be changed on the fly from the language picker at the bottom right corner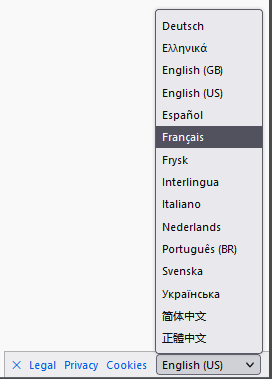 You may request new languages, and contribute, at https://pontoon.mozilla.org/projects/firefox-profiler/ after signing in with a Firefox Account.
Markers
A number of improvements happened around markers: how they’re collected, some new useful markers that were added around Firefox, and how they are better presented.
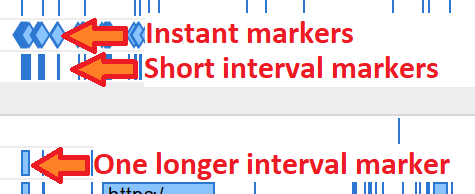
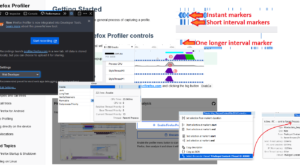
- Instant markers (those without duration) with the same name are now grouped in the top line, instead of being sprinkled semi-randomly among interval markers. And they are all displayed as diamond shapes, making it easier to notice multiple adjacent markers.
- Interval markers are now all displayed as rectangles with a visible darker outline, which better indicates if and where they start and stop. Very short markers that fit in 1 pixel look like dark vertical lines.
- Inter-Process Communication (IPC) markers are now captured from any thread, even those not currently being profiled, in order to give a more complete picture of interactions between Firefox processes. These messages have become more numerous and important since site isolation was improved by using separate Operating System processes for each web server address – so that web servers cannot spy on each other through a common web page.
IPC markers also have a new context menu option, to select the other thread on the other side of the IPC message channel.

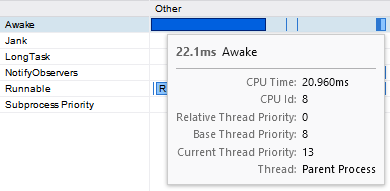
"Awake": In most threads, this shows the actual time spent running tasks (as opposed to waiting for these tasks). It also includes how much CPU is spent, and where available which CPU core ran it, and at which priority level. These markers are especially useful to see how often and when a thread woke up.
"DLLLoad": Time spent loading DLLs on Windows."Set/Sample/Clear Animation"markers on the compositor thread.- DOMEvent and CSS Animation/Transition markers now show the target of the event/animation
- Screenshot marker tooltips now show the actual screenshot.
- New context menu option “Copy page URL”.
Other improvements
- We now support profiling of private browsing windows. Previously we were disabling the profiler as soon as a private window was opened. Now we profile them but mark everything as coming from a private window, so that we can remove the data if the profile is shared (which is the default).
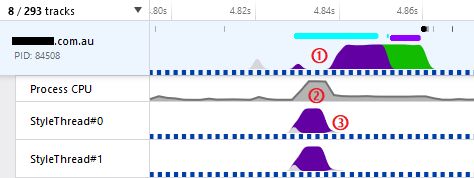
- Per-process CPU utilization. The feature is still marked as experimental but should be usable. Enable it in about:profiling, and when viewing the profile, open the JavaScript console and run experimental.enableProcessCPUTracks() to show the graphs.
In particular, it can highlight work done in the whole process, which may not happen in the currently-visible threads; If you notice some high values there, but cannot find the corresponding work in individual threads, consider selecting more threads to profile before re-running the profiler.
For example, in the following screenshot the zone marked ① looks idle in the main thread; but the “Process CPU” reveals that there was significant activity at ② in this process, and a bit of exploring hidden threads found that the “StyleThreads” at ③ were the ones working hard at that time.
- Ability to capture stack traces on all versions of Firefox for macos. It used to only work on some pre-release channels.
- Profiling data from early times during a process startup used to be split in their own tracks (annotated with “pre-xul”), they are now combined with the correct threads past this early startup phase.
- The memory track’s tooltip now shows the number of memory operations performed between two samples.
- Animations were removed from various places for users with prefer-reduced-motion.
- Profiles captured from Linux perf now distinguish kernel and user frames with different colors. (Thank you to contributor Dave Rigby.)
- Experimental support for capturing actual power usage (not just CPU utilization times) on some platforms (Windows 11 and Apple Silicon as of this writing). This work is still progressing, and will bring another set of measurements that are very important to improve the performance of Firefox and websites.
- Miscellaneous internal performance improvements of the Profiler itself, to better handle capturing and displaying more and more data.
Meet the team, and get help
If you profiled something and are puzzled with the profile you captured, we have the Joy of Profiling (#joy-of-profiling:mozilla.org) channel where people share their profiles and get help from the people who are more familiar with the Firefox Profiler. If you’re interested in the Profiler itself, our main channel is https://matrix.to/#/#profiler:mozilla.org.
We also have Joy of Profiling Open Sessions where people bring their profile and we try to analyze the profile together over Zoom. See the Performance Office Hours calendar.
And if you would just like to see some Firefox developers analyze profiles, watch Mike Conley and friends in the original Joy of Profiling, “unscripted, unplanned, uncensored, and true to life”.
Until next time, Happy Profiling!






No comments yet
Comments are closed, but trackbacks are open.