On Android, we have a couple of ways to periodically extract stack traces from a running Firefox: the built in profiler, and Valgrind. In principle oprofile could also produce stacks at intervals, although it doesn’t.
Looking at zillions of stacks, or text-only output derived from them, isn’t much fun. What I’d really like to do is take a large number of stacks sampled at equal cost intervals, and use Josef Weidendorfer’s excellent KCachegrind GUI to visualise the data. KCachegrind, if you haven’t tried it, makes it easy to examine the dynamic call graph and to see how costs flow between callers and callees.
To do this, the call stacks need to be merged into an approximate dynamic call graph, cycles found and collapsed, and costs propagated back up from leaf nodes. This produces the approximate inclusive and exclusive costs for each node (function) encountered.
So I wrote a program to do this. It takes Valgrind-style call stacks and produces KCachegrind output files. It could easily be generalised to other call stack generators — the call stack elements only need to be comparable for equality.
I ran Firefox on Android, used the STR in bug 728846 as a test workload, and obtained about 32000 16-entry stacks, sampled at approximately million-instruction intervals. Merging them and viewing the results in KCachegrind produces output which at least roughly tallies with the ad-hoc observations listed in the bug report.
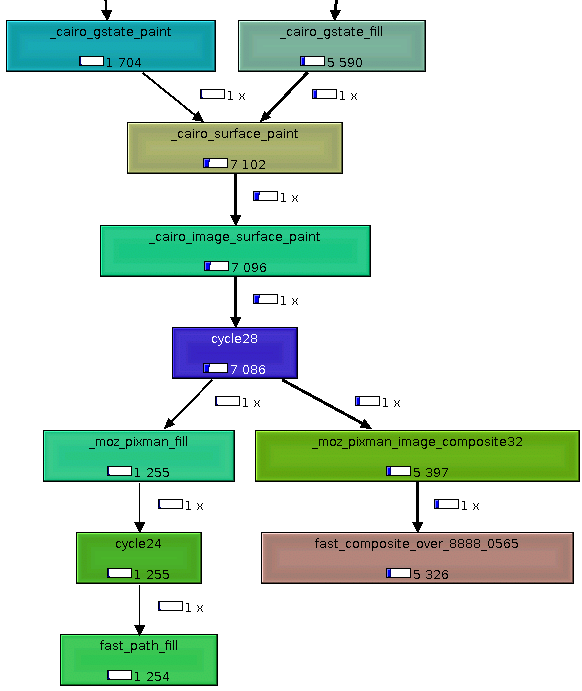
There’s clearly room for improvement, particularly in the handling of cycles, and the fact that it’s limited by how often the stack unwinder produces an incomplete trace. Nevertheless it’s an interesting bit of code to have around. Here’s a snapshot of a bit of the graph leading up to fast_composite_over_8888_0565, which features prominently in the report. 
And here’s a picture of KCachegrind showing the caller and callee relationships for moz_pixman_image_composite32.

Andrew Sutherland wrote on
: