Space profiling the browser

It’s been a good month or more since we started the current round of
chasing space problems in Firefox.  Considerable effort has gone into
identifying and fixing memory hogs.  Although the individual fixes are
often excellent, I’ve haven’t had the big picture on how we’re doing.
So today I did some 3 way profiling, comparing

  • mozilla-central of today, incorporating essentially all the
    space fixes to date
  • mozilla-central of 1 Nov last year, before this really got going
  • 1.9.2 of today, since that’s what we keep
    getting compared against

These are release builds on x86_64 linux, using jemalloc, as that’s
presumably the least fragmentful allocator we have.

Each run loads 20 cad-comic.com tabs.  I let the browser run through
60 billion machine instructions, then stopped it.  By
around 40 billion instructions it has loaded the tabs completely, and
the last 20 billion are essentially idling, intended to give an
identifiable steady-state plateau.  That plateau ought to indicate the
minimum achievable residency, after the cycle collector, JS garbage
collector, the method jit code thrower-awayer, the image discarder,
and any other such things, have done their thing.  I regard the
plateau as more indicative of the behaviour of the browser during a
long run, than I do the peak.

I profiled using Valgrind’s Massif profiler, using the –pages-as-heap
option.  This measures all mapped pages in the process, and so
includes C++ heap, other mmap’d space, code, data and bss segments —
everything.

Consequently a lot of the measured space is the constant overhead of
the text, data and bss segments of the many shared objects involved.
That cost is the same regardless of the browser’s workload.  To
quantify it, I did a fourth profile run, loading a single blank page.
This gives me a way to compute the incremental cost for each
cad-comic.com tab.

The summary results of all this are (all numbers are MBs)

  • Constant overhead: 526
  • Total costs: 1.9.2   907,  MC-Nov10  1149,  MC-now  1077
  • Hence incremental per-tab costs are:
    1.9.2  19.0,
    MC-Nov10  31.1 (63% above 1.9.2),
    MC-now 27.5 (45% above 1.9.2)

So we’re made considerable improvements since November.  But we’re
still worse than 1.9.2.  Nick Nethercote tells me that bug 623428 should
bring further improvements when it lands.

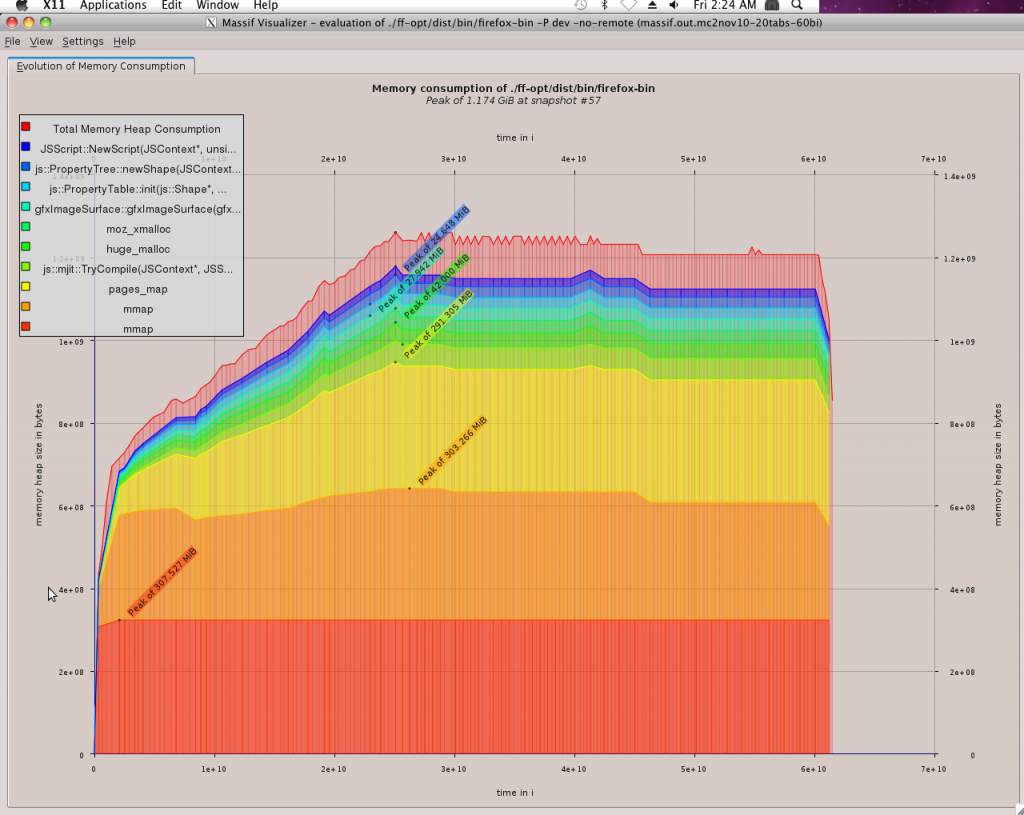
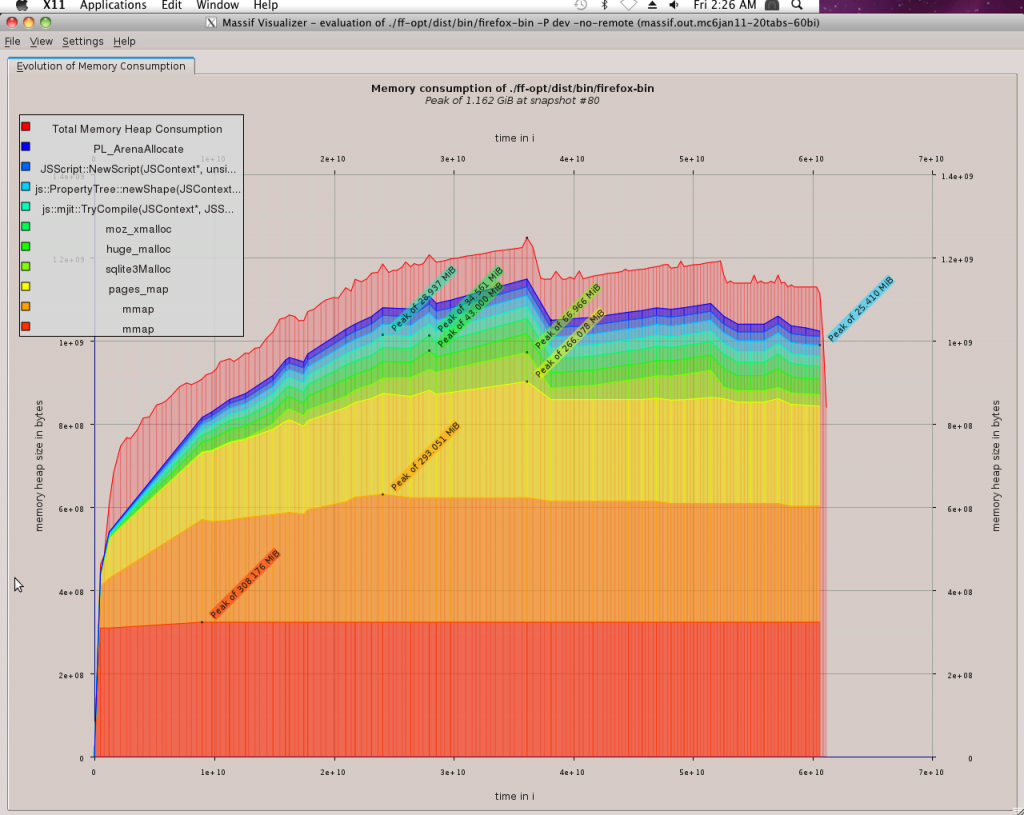
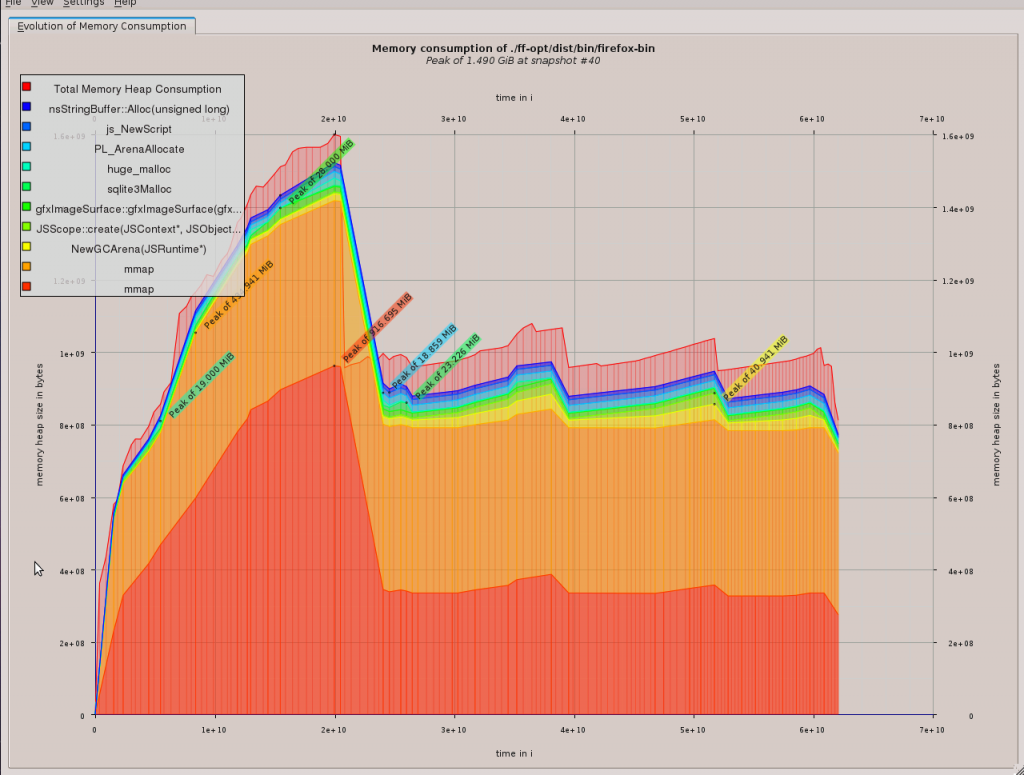
Here are the top-level visualisations for the three profiles.

Firstly, 1.9.2 (picture below).  What surprised me is the massive peak
of around 1.6GB during page load.  Once that’s done, it falls back to a
series of modest trough-peak variations.  I took the steady-state
measurement above at the lowest trough, around 54 billion instructions
on the horizontal axis.

Also interesting is that steady-state is reached before 25 billion
instructions.  The M-C runs below took longer to get there.

Profile for 1.9.2

The M-C Nov10 picture (below) is less dramatic.  It lacks the 1.6GB peak,
instead climbing to pretty much the final level of around 1.2GB and
staying there, with a slight decline into steady-state at around 44
billion insns.

Profile for M-C, 1 Nov 10

The M-C-of-now picture (below) is similar, although steady state
is less steady, and somewhat lower, reflecting the fixes of the past
few weeks. Observe how the orange band steps down slightly in
three stages after about 24 billion instructions.  I believe that’s Brian
Hackett’s code discard patch, bug 617656.  Also, note the gradual
slope up from around 38 billion to 53 billion insns.  That might be
the excessively-infrequent GC problem investigated in bug 619822.

So what’s with the 1.6GB peak for 1.9.2 ?  It gives the interesting
effect that, although M-C is worse in steady state than 1.9.2, M-C
has more modest peak requirements, at least for this test case.

On investigation, what 1.9.2 seems to be spiked by is thread stacks.
The implication is that it has more simultaneously live threads than
M-C.  Why this should be, I don’t know.  I did however notice that
1.9.2 seems to load all 20 tabs at the same time, whereas M-C appears
to pull them in in smaller groups.  Related?  I don’t know.
Profile for M-C, 6 Jan 11

Fun ‘n’ games with DHAT

Back in 2007 Nick Nethercote morphed his Massif heap profiler into
its present form.  Massif intercepts malloc/free et al, takes
periodic snapshots of the heap and shows results using stack trees.
It answers the questions “what’s in the heap?” and “who put it there?”

Since then, I’d been mulling over a heap profiler that could also tell
me something about block lifetimes and usages.  This year I finally
got around to hacking something up — DHAT.  Like Massif, DHAT
intercepts malloc/free, but it also inspects every (data) memory
reference, to see which block, if any, it is to.  By doing that we can
identify hot blocks and under-used ones.  For allocation points which
always allocate blocks of the same size, DHAT keeps count of how often
each block offset is accessed, thereby giving information on hot and
cold object fields, and showing up probable aligment holes.

DHAT also records block lifetime information.  Time is measured in
instructions executed, as does Massif.  DHAT notes the age at death of
each block and shows the average value for each allocation point.
Doing that makes it easy to find allocation points which chew through
lots of heap, but don’t hold on to it for long, or, conversely, points
that allocate heap and hold on to it for the entire process lifetime.

DHAT tracks two kinds of entities: blocks and allocation points (APs).  A block
is just a heap block.  An AP is a stack trace that has allocated one
or more blocks.  When a block is freed, its statistics are merged back
into its AP.  At the end of the run, DHAT shows statistics for the top
N APs, as sorted by one of three user-selectable metrics.  Most of the
art of using DHAT is in interpreting the mass of numbers it produces.

DHAT perhaps ought to be merged with Massif at some point.  For now,
the emphasis was to get something up and running quickly, to see if it
generates any useful information.

So does it show up anything interesting in Firefox?

Here’s a no-brainer, bug 609905:

-------------------- 32 of 5000 --------------------
max-live:    524,328 in 1 blocks
tot-alloc:   524,328 in 1 blocks (avg size 524328.00)
deaths:      1, at avg age 15,015,989,851 (99.60% of prog lifetime)
acc-ratios:  0.00 rd, 0.00 wr  (192 b-read, 825 b-written)
at 0x4C27ECA: operator new(unsigned long) (vg_replace_malloc.c:261)
by 0x661D01D: js::InitJIT(js::TraceMonitor*) (jstracer.cpp:7807)
by 0x651FBEB: JSThreadData::init() (jscntxt.cpp:497)
by 0x652049D: js_CurrentThread(JSRuntime*) (jscntxt.cpp:588)
by 0x652085C: js_InitContextThread(JSContext*) (jscntxt.cpp:659)

This is a half-megabyte block that’s allocated, held onto for the
entire browser run, but never accessed.  The key is to look at the
acc-ratios field, which shows the average number of times each byte
in the block got read and written — here, 0.00 for both.  Turns out
to be a leftover allocator from the regexp engine that predated YARR.

Here’s another, bug 611400, that’s more
interesting.  When profiling the browser I noticed quite a lot heap
occupied by allocations from Jaegermonkey’s method
js::mjit::Compiler::finishThisUp.  I wondered what it was but didn’t
think much more about it until I profiled the JS engine running
Kraken, and fell across this:

-------------------- 4 of 100 --------------------
max-live:    12,197,056 in 1 blocks
tot-alloc:   12,197,056 in 1 blocks (avg size 12197056.00)
deaths:      1, at avg age 1,432,667,675 (42.98% of prog lifetime)
acc-ratios:  0.00 rd, 0.00 wr  (59 b-read, 129 b-written)
at 0x47B44FF: calloc (vg_replace_malloc.c:467)
by 0x81FF24D: js::mjit::Compiler::finishThisUp(js::mjit::JITSc
by 0x8215E47: js::mjit::Compiler::performCompilation(js::mjit:
by 0xC2F402F: ???

Hmm, a 12.2 MB allocation which is never used!  That’s around 12% of
the maximum live heap in this run.  Turns out the method JIT creates
tables mapping JS bytecodes to the corresponding native code entry
points.  This Kraken test (imaging-darkroom) includes huge tables of
constants, for which there are no entry points, so the 12MB allocation
is a completely empty table.

This is an extreme case of a more general problem, though.
Instrumenting the method jit shows that about 98% of table entries are
unused when running more “normal” Javascript, when
surfing at fairly complex-looking web pages, with 5 open tabs.

I changed the table representation to only store useful entries.  That
saves the 12.2MB in Kraken.  For a browser with 5 tabs, it saves
somewhere in the region of 1%-2% of the entire C++ heap, which is a
nice outcome.

And there’s more:

  • we were allocating a 3MB file buffer when writing Zip files (610040) (although JOrendorff beat me to it by a few minutes)
  • Inefficient layout of CSS style rules (596140)

The above results were obtained by looking through allocation points
sorted by decreasing maximum-live-volume.  Sorting the output on other
metrics gives other perspectives:

  • sorting by decreasing max-blocks-live shows places where we allocate large numbers of small blocks (CSS handling, the HTML5 parser)
  • sorting by decreasing total-bytes-allocated tends to show up places that turn over a lot of heap, even if it isn’t held onto for long (on Linux, the X client libraries seem particularly bad)

DHAT is available in Valgrind-3.6.0 (–tool=exp-dhat).  It is stable
but can sometimes produce misleading numbers, and is unreasonably slow
for such a simple tool.  I have a fixed up and 2-3 x faster version,
which I’ll ship in 3.6.1.