A while ago I wrote about some ideas I had for improving about:memory. Bug 653633 has been tracking the first stage of this (and it now also has a feature page) and it only needs to pass super-review to be ready for landing.
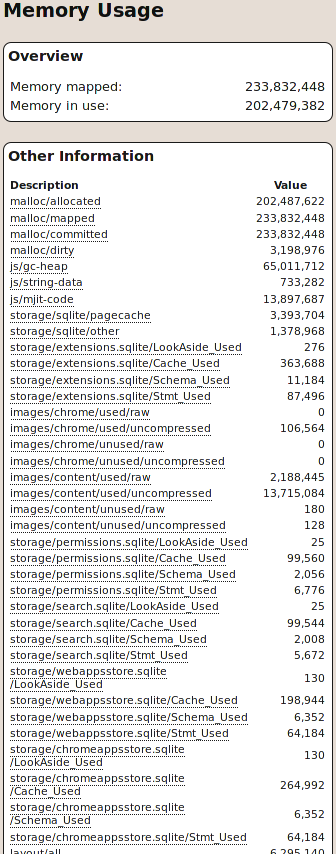
Here’s what the old about:memory looks like.
Some things to note:
- The “Memory mapped” and “Memory in use” numbers are for the heap, not the entire process.
- The “Memory mapped” and “malloc/mapped” numbers are the same, as are the “Memory in use” and “malloc/allocated” numbers (modulo tiny differences due to memory allocations that occur while generating the page).
- It’s a big list without much information how the different entries relate. If you hover over the names you get a tool-tip that explains a bit more, but it’s often not much of a help.
- Something not obvious from the above screenshot is that if you cut and paste the output into a text box it looks horrible. Eg. see this Bugzilla comment. This makes it hard to use in Bugzilla reports.
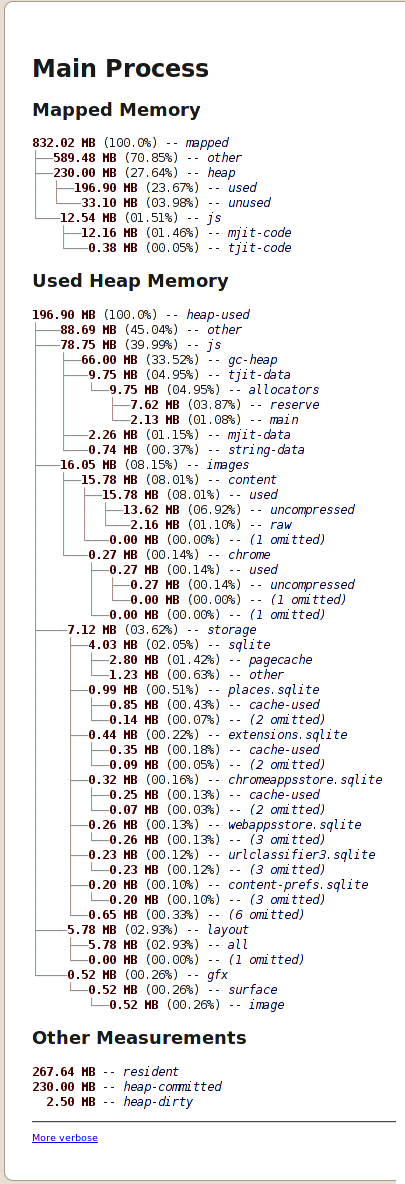
Here’s what the new about:memory looks like:
Things to note:
- Most of the output use a tree-based representation which shows the hierarchy of the memory breakdown. I.e. overall use is broken into multiple chunks, and each of those chunks are broken into sub-chunks, and so on. This makes it much easier to see where the bulk of the memory usage is occurring.
- The use of percentages helps with this too.
- Sizes are reported in MB, not bytes. (I wanted to use “MiB” instead of “MB”, but was discouraged by the prior holy war about this issue that bug 106618 documents!)
- The “Mapped Memory” tree gives the high-level overview. The root of that tree is the total memory used by the process (which the old about:memory did not list).
- The “Used Heap Memory” tree gives the breakdown for the used part of the heap (which corresponds to the “mapped/heap/used” figure in the “Mapped Memory” tree). I show the used heap separately because most of the time that’s the most interesting information. In contrast, the “Mapped Memory” tree is often dominated by code and data segments, which don’t correspond to explicit memory allocation requests from the process and so are less variable and harder to improve.
- “Other Measurements” holds measurements that overlap with the tree breakdown. The new “resident” figure tells you how much physical memory is being used by the process.
- Entries that cover a very small section of memory (less than 0.1% of the used heap, for the “Used Heap Memory” tree) are aggregated into entries that look like “(2 omitted)”. This means that more memory reporters can be added in the future without the output being cluttered up by tiny entries.
- If you click on the “More verbose” link at the bottom, the page redraws showing all the sizes as bytes instead of MB, and aggregated entries are shown in full.
- It handles multiple processes. If you view about:memory in Fennec you get output for each process separately. The plug-in container process isn’t represented at the moment, though; bug 648415 is open for adding that, though it’s of less interest since plug-ins like Flash are out of Mozilla’s control.
- You can’t see it in the picture, but the tool-tips describing each metric are clearer, more consistently expressed, and expressed as complete sentences.
- The formatting is much more similar to other “about:” pages such as about:cache and about:buildconfig.
- You can cut and paste the output into a text box and it reproduces beautifully. The lines used to represent the tree structure are Unicode box-drawing characters, and I stuck to the subset that are most commonly supported by terminals. The generated HTML has newlines in just the right places so that whitespace is inserted nicely. Here’s an example:
Main Process

Mapped Memory
634.89 MB (100.0%) -- mapped
├──526.33 MB (82.90%) -- other
├──106.00 MB (16.70%) -- heap
│  ├───53.34 MB (08.40%) -- used
│  └───52.66 MB (08.29%) -- unused
└────2.56 MB (00.40%) -- js
     ├──2.44 MB (00.38%) -- mjit-code
     └──0.13 MB (00.02%) -- tjit-code

Used Heap Memory
53.34 MB (100.0%) -- heap-used
├──22.22 MB (41.65%) -- js
│  ├──21.00 MB (39.37%) -- gc-heap
│  ├───0.75 MB (01.41%) -- tjit-data
│  │   └──0.75 MB (01.41%) -- allocators
│  │      ├──0.56 MB (01.06%) -- reserve
│  │      └──0.19 MB (00.35%) -- main
│  ├───0.35 MB (00.66%) -- mjit-data
│  └───0.11 MB (00.21%) -- string-data
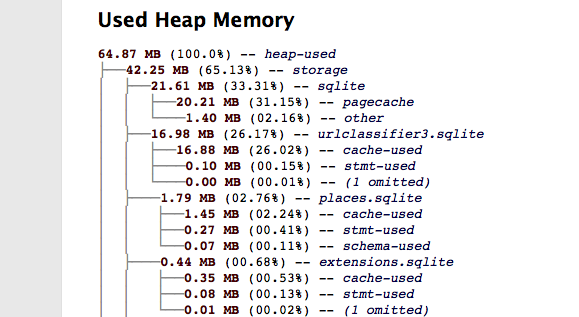
The screenshots above are from my Ubuntu Linux box. Funnily enough, on Mac the lines in the box-drawing characters don’t line up consistently so the output doesn’t look as nice, as this screenshot shows:
Not much that can be done about that, as far as I know; it’s certainly not a show-stopper.
My hope is that this revamped about:memory will be the first place both users and developers look when trying to understand any issue related to memory usage. For example, it should subsume OS memory reporters like ‘top’, ‘ps’ and the Windows task manager. This will make bug reports easier to understand; in particular it will help avoid the problem where someone says “Firefox is using 800MB of memory” and you don’t know which metric they are using.
There are some definite improvements to be made. Most notably, the “heap-used/other” entry is usually the largest one in the “Heap Memory Used” tree — large chunks of memory aren’t being covered by memory reporters, so new ones need to be added. Working out what these reporters are won’t be easy, but Massif should be a big help.
After that, it’d be great to have reporting at the level of individual tabs or something like that. Mike Shaver has a draft patch adding an about:compartments page which reports about JavaScript memory usage for individual compartments, which correspond to domains. This is a great start, though I’d like non-JavaScript memory usage to also be divided in this way. The details of how best to do this are not yet clear to me.
The new about:memory is on track to make it into Firefox 6. Hopefully it will help reduce Firefox’s memory consumption.


13 replies on “A better about:memory: stage 1”
Note that SQLite also has some memory mapped (when using the WAL journal mode). I’m not sure if that is exposed, however.
The two-tree structure gives too much importance to the implementation detail of which things are on the heap. Only one tree is needed, with top-level items like “other non-heap”, “other heap-used”, “heap-unused”, “js”, and “storage”. That way, all the JS stuff is together, all the “other” items are at the same level, and users don’t have to wonder what the relationship is between the two trees. The overall heap stats, if they’re useful at all, should be dumped into “other measurements”. I understand that there’s a weak correlation between “on the heap” and “under Firefox’s control”, but it looks like we have plenty of data to do better.
Hopefully we can split “code segments” and “data segments” (or “Firefox” and “system libraries”) out of “other non-heap”.
I’m confused about images. What’s the difference between “uncompressed” and “raw”? How does /gfx/surface/image/ differ from /images/? (Maybe I’d be less confused if I could see the tooltips; can you post a generated page in addition to the screenshots?)
The sqlite portion of the tree uses a lot of space to show, for each sqlite file, either that (1) there’s a breakdown, but it’s boring or (2) there’s a breakdown, but it’s not shown. Maybe the breakdown should be hidden for sqlite regardless of the normal heuristics.
I assume the “Unicode line art trees” are displayed using semantic nested lists and CSS generated content, and are thus fully accessible? 😉
The “Unicode line art trees” are likely to turn into a mess when pasted into a forum that uses non-fixed-width fonts. Simple indentation would work better for such forums.
I’d like to have buttons on the page for “GC”, “CC”, and “memory-pressure”. But maybe that’s just me.
Jesse: thanks for the detailed comments.
I disagree about having a single tree. I had that to begin with, I found it annoying because I almost always ended up looking at the heap/used part. A better two-tree structure would distinguish between memory that is explicitly requested by Firefox at runtime — ie. requested via malloc/new and mmap — and non-requested memory, ie. code and data segments. But that was difficult to do, and it would be easy to miss some mmap requests, and the heap was a reasonable approximation of the “explicitly requested at runtime” memory so I went with the current split.
Measuring code segments and data segments is tricky. It’s possible on Linux thanks to /proc/pid/maps, but I have no idea about other platforms. (As for posting a generated page — I don’t know how to do that.)
I don’t know much about the images reporters, they already existed before I started working on this. Vlad would know more.
There are a lot of sqlite reporters. Some of them overlap too, bug 653630 will fix this and remove some of them. I don’t think there’s a problem with the sqlite reporters specifically, but I can see there is an argument for increasing the threshold of significance so that fewer entries are shown.
If you paste the trees into a non-fixed width text box they still look pretty good; not as good as in a fixed-width text box, but still very readable.
Bug 654041 is open to add GC and CC buttons. What would a “memory pressure” button do?
The tree approach is much better however until resource usage information is available for extensions, this is limited for end users at best, useless at worst.
pd: thanks for your enthusiasm!
Looks great. Also, I think it should be Mio for mebioctets :/
I do notice though that Bug #106618 mentions using IEC units on the about:cache page, and it still does (though that may be my platform – Ubuntu)
Could we please use KiB/MiB here too.
John Drinkwater: yes, about:cache uses KiB/MiB, and I’d prefer to use them too. But there was enough history and opposition here that I took the coward’s route in order to get the changes in ASAP.
Playing around with this more, here are some suggestions:
1. make the tree edge color a very light gray
2. make the parens around the percentages a very light gray
3. make the all the leading 0’s on the integer part a very light gray
4. make the — a lighter color
5. make the (N omitted) a lighter color
6. make any line with 0 MB completely a very light gray
7. on mouse hover, the current node and all the ancestors of the node should be highlighted
asdf: Thanks for the suggestions. I added them to bug 654917, which is no guarantee they’ll happen but they’re less likely to be forgotten about there than in a blog comment 🙂
Three things I have noticed playing with the new ‘about:memory’ page:
1. The total amount of memory used for a blank started Nightly is toggles between 60 MB or 70 MB. One run it is 60MB, the next it is 70MB. What is causing this?
2. The total amount of memory is growing quickly when reloading the ‘about:memory’ page. It looks like that the ‘about:memory’ page itself is leaking memory?
3. The other category of Mapped Memory is a big chunk, and grows also. What is there?
Nicholas: don’t get me wrong, I think it’s great that you are working on this. I read your post about how much of a nightmare it is to work on C++ Mozilla code and I really appreciate that you are willing to put yourself through the pain of dealing with the Mozilla hierarchy to try and get this sort of thing happening.
I did say “for the end user” and I’d have to stick by that. No end user knows what heaps are. However your new GC GC + CC buttons are at least *something* that can empower end users a little.
If the overly technical, not-so-user-friendly, output you have produced so far is a necessary step towards a more friendly version in the long run, excellent!
pd, thanks for clarifying your comment.
about:memory isn’t really intended to be understood by non-technical users, but it is intended to let them provide better bug reports. We have way too many bug reports along the lines of “Firefox is using 500MB of memory after a few hours, WTF? Fix it you morons”. Reports like that are almost impossible to act on.
Along the same lines, the GC/CC buttons aren’t meant to empower users so much as improve the bug reports further — if the user invokes GC/CC before reporting, we can be confident that the problem is not just that GC/CC hasn’t run for a while. (But if those buttons do empower some users beyond that, then that’s a nice side-effect 🙂