Categories
about:memory AdBlock Plus add-ons compartments DMD Firefox Garbage Collection JägerMonkey Massif Memory allocation Memory consumption MemShrink Performance SQLite Talks Valgrind

Notes on Reducing Firefox’s Memory Consumption

I gave a talk yesterday at the linux.conf.au Browser MiniConf, held in Ballarat, Australia.  Its title was “Notes On Reducing Firefox’s Memory Consumption”.

Below are the slides and notes in a SlideShare embedding. If you find that embedding problematic (some people do) you may prefer to download the PDF version directly.

Categories
about:memory Firefox Massif Memory consumption

A better about:memory: stage 1

A while ago I wrote about some ideas I had for improving about:memoryBug 653633 has been tracking the first stage of this (and it now also has a feature page) and it only needs to pass super-review to be ready for landing.

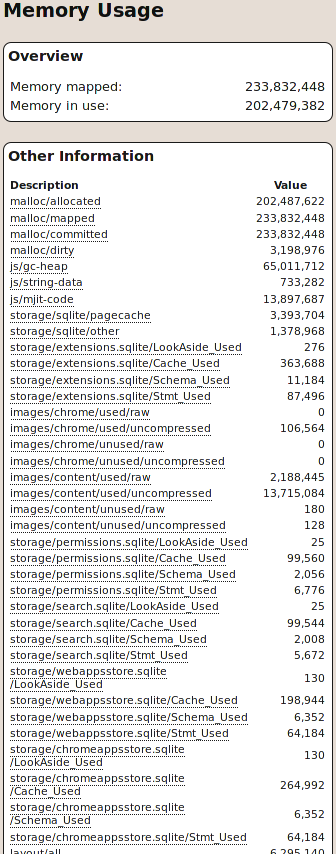
Here’s what the old about:memory looks like.

Old about:memory output

Some things to note:

  • The “Memory mapped” and “Memory in use” numbers are for the heap, not the entire process.
  • The “Memory mapped” and “malloc/mapped” numbers are the same, as are the “Memory in use” and “malloc/allocated” numbers (modulo tiny differences due to memory allocations that occur while generating the page).
  • It’s a big list without much information how the different entries relate.  If you hover over the names you get a tool-tip that explains a bit more, but it’s often not much of a help.
  • Something not obvious from the above screenshot is that if you cut and paste the output into a text box it looks horrible.  Eg. see this Bugzilla comment.  This makes it hard to use in Bugzilla reports.

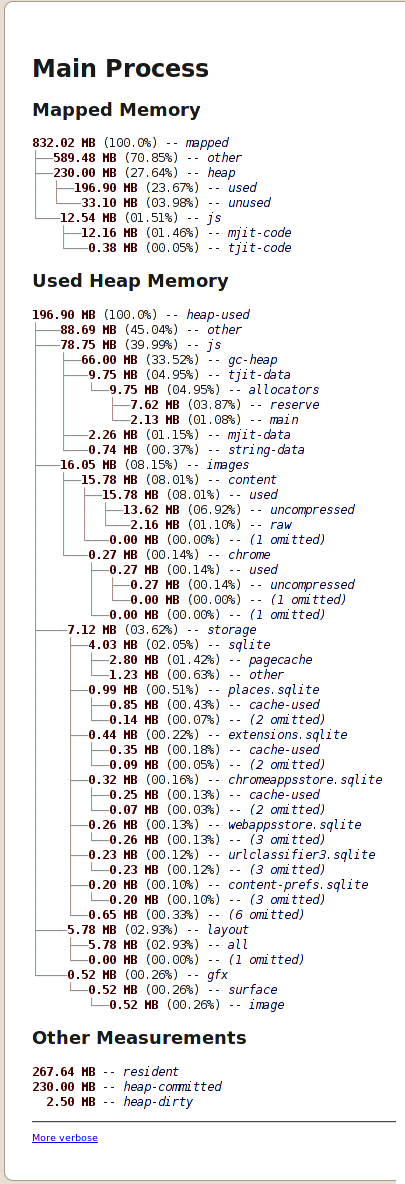
Here’s what the new about:memory looks like:

New about:memory output

Things to note:

  • Most of the output use a tree-based representation which shows the hierarchy of the memory breakdown.  I.e. overall use is broken into multiple chunks, and each of those chunks are broken into sub-chunks, and so on.  This makes it much easier to see where the bulk of the memory usage is occurring.
  • The use of percentages helps with this too.
  • Sizes are reported in MB, not bytes.  (I wanted to use “MiB” instead of “MB”, but was discouraged by the prior holy war about this issue that bug 106618 documents!)
  • The “Mapped Memory” tree gives the high-level overview.  The root of that tree is the total memory used by the process (which the old about:memory did not list).
  • The “Used Heap Memory” tree gives the breakdown for the used part of the heap (which corresponds to the “mapped/heap/used” figure in the “Mapped Memory” tree).  I show the used heap separately because most of the time that’s the most interesting information.  In contrast, the “Mapped Memory” tree is often dominated by code and data segments, which don’t correspond to explicit memory allocation requests from the process and so are less variable and harder to improve.
  • “Other Measurements” holds measurements that overlap with the tree breakdown.  The new “resident” figure tells you how much physical memory is being used by the process.
  • Entries that cover a very small section of memory (less than 0.1% of the used heap, for the “Used Heap Memory” tree) are aggregated into entries that look like “(2 omitted)”.  This means that more memory reporters can be added in the future without the output being cluttered up by tiny entries.
  • If you click on the “More verbose” link at the bottom, the page redraws showing all the sizes as bytes instead of MB, and aggregated entries are shown in full.
  • It handles multiple processes.  If you view about:memory in Fennec you get output for each process separately.  The plug-in container process isn’t represented at the moment, though;  bug 648415 is open for adding that, though it’s of less interest since plug-ins like Flash are out of Mozilla’s control.
  • You can’t see it in the picture, but the tool-tips describing each metric are clearer, more consistently expressed, and expressed as complete sentences.
  • The formatting is much more similar to other “about:” pages such as about:cache and about:buildconfig.
  • You can cut and paste the output into a text box and it reproduces beautifully.  The lines used to represent the tree structure are Unicode box-drawing characters, and I stuck to the subset that are most commonly supported by terminals.  The generated HTML has newlines in just the right places so that whitespace is inserted nicely.  Here’s an example:
Main Process

Mapped Memory
634.89 MB (100.0%) -- mapped
├──526.33 MB (82.90%) -- other
├──106.00 MB (16.70%) -- heap
│  ├───53.34 MB (08.40%) -- used
│  └───52.66 MB (08.29%) -- unused
└────2.56 MB (00.40%) -- js
     ├──2.44 MB (00.38%) -- mjit-code
     └──0.13 MB (00.02%) -- tjit-code

Used Heap Memory
53.34 MB (100.0%) -- heap-used
├──22.22 MB (41.65%) -- js
│  ├──21.00 MB (39.37%) -- gc-heap
│  ├───0.75 MB (01.41%) -- tjit-data
│  │   └──0.75 MB (01.41%) -- allocators
│  │      ├──0.56 MB (01.06%) -- reserve
│  │      └──0.19 MB (00.35%) -- main
│  ├───0.35 MB (00.66%) -- mjit-data
│  └───0.11 MB (00.21%) -- string-data

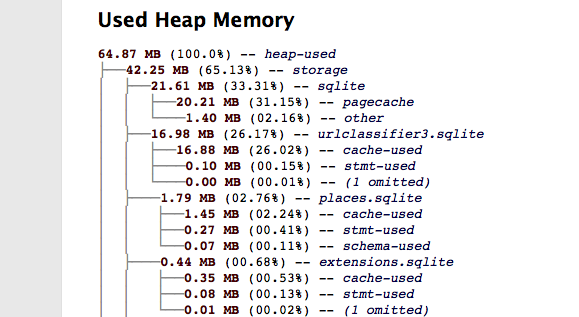
The screenshots above are from my Ubuntu Linux box.  Funnily enough, on Mac the lines in the box-drawing characters don’t line up consistently so the output doesn’t look as nice, as this screenshot shows:

New about:memory output on Mac, showing misaligned box characters

Not much that can be done about that, as far as I know;  it’s certainly not a show-stopper.

My hope is that this revamped about:memory will be the first place both users and developers look when trying to understand any issue related to memory usage.  For example, it should subsume OS memory reporters like ‘top’, ‘ps’ and the Windows task manager.  This will make bug reports easier to understand;  in particular it will help avoid the problem where someone says “Firefox is using 800MB of memory” and you don’t know which metric they are using.

There are some definite improvements to be made.  Most notably, the “heap-used/other” entry is usually the largest one in the “Heap Memory Used” tree — large chunks of memory aren’t being covered by memory reporters, so new ones need to be added.  Working out what these reporters are won’t be easy, but Massif should be a big help.

After that, it’d be great to have reporting at the level of individual tabs or something like that.  Mike Shaver has a draft patch adding an about:compartments page which reports about JavaScript memory usage for individual compartments, which correspond to domains.  This is a great start, though I’d like non-JavaScript memory usage to also be divided in this way.  The details of how best to do this are not yet clear to me.

The new about:memory is on track to make it into Firefox 6.  Hopefully it will help reduce Firefox’s memory consumption.

Categories
about:memory Firefox Massif Memory consumption

A vision for better memory profiling with about:memory

I’ve been doing lots of memory profiling of Firefox.  I’ve mostly used Massif and about:memory for this.  Both have their uses, but also big problems.  I have some ideas for combining their best features into a killer profiling tool.

Massif’s pros and cons

I’ve mostly used Massif.  It’s both invaluable and a total pain.  More specifically, it has the following advantages:

  • Time series.  It shows how memory consumption changes over time, both graphically (for total allocations) and with periodic detailed snapshots.
  • Level of detail.  Each detailed snapshot consists of an allocation tree that shows which parts of the code are responsible for every single byte allocated.

But it has lots of disadvantages.

  • Slow.  There’s somewhere between a 10x and 100x slowdown;  that’s a rough estimate, I haven’t actually measured it.
  • It’s implemented with Valgrind, so it doesn’t work on Windows.
  • It’s not easy to use.  The command-line needed to get good results with Firefox is huge.
  • There’s little control over when snapshots occur.  That could be improved relatively easily with client requests, though they require code modifications so they’re a bit painful.
  • The superblock allocation problem.  You can profile with Massif at the OS page level, or at the heap (malloc) level.  In both cases, the results can be misleading because an allocation request doesn’t always result in a visible allocation occurring.  For example, if profiling at the OS page level, most calls to malloc won’t result in pages being allocated with mmap, because when jemalloc needs pages from the OS it will usually request more than necessary for the current request, and then hand out pieces of those pages itself on subsequent calls to malloc.  If profiling at the heap level, this problem also occurs with custom allocators such as JSArenaPool that are layered on top of malloc.  As a result, many allocation requests don’t get recorded by Massif, and a small number of them are blamed for allocating much more memory than they actually did.  (The whole question of “what level do I measure at?” is one of the trickiest things about memory profiling.)

The result is that using Massif and understanding its output is difficult for anyone who isn’t an expert.

about:memory’s pros and cons

The other tool I sometimes use is about:memory.  It has the following advantages:

  • Lightweight, trivial to view.
  • Full control over when measurements occur.

And the disadvantages:

  • Minimal data, mostly just the heap.
  • The values are not as easy to understand as they seem.
  • No time series.

A better about:memory

I want the best of both worlds:  time series, detailed measurements, control when measurements occur, ease-of-use.  Plus a bit more: both OS page and heap level measurements, accurate numbers, global and per-compartment measurements, and good visualizations of both snapshots and time series data.  Basically, I want to re-implement a decent chunk of Massif within about:memory.  What follows is a 4am braindump, apologies for the density, hopefully it’s mostly understandable.

Merge about:memory and Shaver’s nascent about:compartments, because they’re really doing the same thing.

More global measurements:

  • Add current and peak total memory and RSS (resident set size), as measured by the system (eg. /proc/pid/status on Linux).
  • Keep malloc stats as they currently are (eg. malloc/allocated).
  • More individual counts.  Eg. for JS we currently have js/gc-heap, js/string-data, js/mjit-code.  I want to split js/mjit-code into several counts: JaegerMonkey code (inline, out-of-line, ICs) and JaegerMonkey data (JITScripts and IC data).  And also add counts for: TraceMonkey code and data, Shapes, JSFunctions, JSScripts, cx->tempAlloc (which holds JSParseNodes plus other things), JSFunctions, js::Vector, js::HashTable… basically anything that shows up reasonably high in Massif profiles.  We currently have 19 individual counts, I imagine having 50+.  Obviously there’ll be lots of non-JS counters added as well.
  • Allow individual counts to be shown in a standard order, or in order from biggest to smallest.
  • For a lot of these, both the number of bytes allocated and the number of allocations might be useful.

Per-compartment measurements: show all the individual counts, but on a per-compartment basis.

Clearer meanings of measurements:

  • Add links/tooltips/whatever to every measurement with a brief description so that it’s clear what it means.
  • For individual counts, clearly distinguish heap allocations from non-heap allocations (eg. executable code space allocated by the JITs).
  • Have “everything else” measurements for both the heap and the total, found by subtracting individual counts from the overall and heap totals.

Visualization of measurements.  E.g.:

  • Show the heap as proportion of total memory.
  • Show each individual global count as a proportion of the total.
  • Show each compartment’s individual count sum as a proportion of the global individual count sum.
  • All this via pie charts or similar.

Time series:

  • Allow about:memory snapshots to be dumped to file in some manner, probably as JSON.
  • Do it in a way that allows multiple snapshots to be processed easily by an external tool.
  • Basically, Sayre’s membuster on steroids.
  • Furthermore, make that data available to the browser itself as well.

Visualization of time series data:

  • Use the time series data to show a graph in about:memory.
  • Make the graph interactive, eg. allow drilling down to individual counts, going back to previous snapshots.
  • I have a hacky prototype canvas implementation of something like this that reads Massif’s output files.  SVG would probably be better, though.

Diffs of some kind between snapshots would be great.  It would allow you to answer questions like “how much memory is allocated when I open a new tab?”

If telemetry is ever implemented, sending this data back from users would be great, though that’s a lot harder.

Potential difficulties:

  • Not that many, as far as I can tell.  A lot of the infrastructure is already in place.
  • Keeping the counter code up-to-date may be tricky.  If it’s used frequently by many people, that’ll increase the likelihood that it’ll be kept up to date.  Better descriptions will help make it clearer if the counters are counting what they’re supposed to.
  • about:memory will itself use some memory.  It’s unclear how to avoid measuring that.  Maybe putting the more advanced features like the graphical stuff in a separate about:morememory page might mitigate this;  you could take a bunch of snapshots via about:memory and then open up about:morememory.
  • Performance… will more counters be noticeable?  Hopefully not since we already have a bunch of them anyway.
  • Unsophisticated users might file unhelpful “hey, Firefox is using too much memory”.  But sophisticated users might file helpful “hey, Firefox is using too much memory” bugs.

Basically, if this can be made as attractive and useful in reality as it currently is in my imagination, I figure no-one will ever need to use an external memory profiler for Firefox again.

Categories
Firefox JägerMonkey Massif Memory consumption Valgrind

Memory profiling Firefox with Massif, part 2

To follow up from this post: we’ve made some good progress on reducing JaegerMonkey’s memory consumption in Firefox 4, though there’s still a way to go.  Julian Seward will blog about this shortly.  In the meantime, I thought I’d share a particularly useful Massif invocation that Rob Sayre inspired me to concoct:

  valgrind \
  --smc-check=all --trace-children=yes \
  --tool=massif \
  --pages-as-heap=yes --detailed-freq=1000000 \
  --threshold=0.5 \
  --alloc-fn=mmap \
  --alloc-fn=syscall \
  --alloc-fn=pages_map \
  --alloc-fn=chunk_alloc \
  --alloc-fn=arena_run_alloc \
  --alloc-fn=arena_bin_malloc_hard \
  --alloc-fn=malloc \
  --alloc-fn=realloc \
  --alloc-fn='operator new(unsigned long)' \
  --alloc-fn=huge_malloc \
  --alloc-fn=posix_memalign \
  --alloc-fn=moz_xmalloc \
  --alloc-fn=JS_ArenaAllocate \
  --alloc-fn=PL_ArenaAllocate \
  --alloc-fn=NS_Alloc_P \
  --alloc-fn=NS_Realloc_P \
  --alloc-fn='XPConnectGCChunkAllocator::doAlloc()' \
  --alloc-fn='PickChunk(JSRuntime*)' \
  --alloc-fn='RefillFinalizableFreeList(JSContext*, unsigned int)' \
  --alloc-fn=sqlite3MemMalloc \
  --alloc-fn=mallocWithAlarm \
  --alloc-fn=sqlite3Malloc \
  <insert-firefox-command-here>

Good grief!  What a mess.  Don’t blame Massif for this, though;  it’s because Firefox has so many custom memory allocators.

With that invocation, the output of ms_print becomes something that is comprehensible to people other than Massif’s author 🙂  Here’s an extraction of the output which gives a high-level view of Firefox’s memory consumption on 64-bit Linux after loading 20 tabs, each with a random comic from http://www.cad-comic.com/cad/, which is a JavaScript-heavy site:

31.04% (366,878,720B) _dl_map_object_from_fd (dl-load.c:1195)
15.73% (185,998,724B) in 3693 places, all below massif's threshold (00.00%)
15.62% (184,639,488B) pthread_create@@GLIBC_2.2.5 (allocatestack.c:483)
05.68% (67,112,960B) pa_shm_create_rw (in /usr/lib/libpulsecommon-0.9.21.so)
04.35% (51,372,032B) JSC::ExecutablePool::systemAlloc(unsigned long) (ExecutableAllocatorPosix.cpp:43)
03.30% (38,993,920B) js::InitJIT(js::TraceMonitor*) (jstracer.cpp:7644)
03.11% (36,741,120B) js::InitJIT(js::TraceMonitor*) (jstracer.cpp:7643)
02.87% (33,935,360B) js::PropertyTree::newShape(JSContext*, bool) (jspropertytree.cpp:97)
02.84% (33,554,432B) js_NewFunction(JSContext*, JSObject*, int (*)(JSContext*, unsigned int, js::Value*), unsigned int, unsigned int, JSObject*, JSAtom*) (jsgcinlines.h:127)
02.79% (32,923,648B) js::InitJIT(js::TraceMonitor*) (jstracer.cpp:7642)
01.99% (23,555,684B) js::mjit::Compiler::finishThisUp(js::mjit::JITScript**) (jsutil.h:213)
01.69% (19,934,784B) JSScript::NewScript(JSContext*, unsigned int, unsigned int, unsigned int, unsigned int, unsigned int, unsigned int, unsigned int, unsigned int, unsigned int, unsigned short, unsigned short) (jsutil.h:209)
01.53% (18,067,456B) pcache1Alloc (sqlite3.c:33368)
01.48% (17,457,388B) nsStringBuffer::Alloc(unsigned long) (nsSubstring.cpp:206)
01.31% (15,478,784B) g_mapped_file_new (in /lib/libglib-2.0.so.0.2400.1)
00.89% (10,486,784B) JS_NewObject (jsgcinlines.h:127)
00.71% (8,388,608B) js::StackSpace::init() (jscntxt.cpp:164)
00.68% (8,093,696B) GCGraphBuilder::NoteScriptChild(unsigned int, void*) (mozalloc.h:229)
00.68% (8,024,064B) NewOrRecycledNode(JSTreeContext*) (jsparse.cpp:495)
00.67% (7,974,936B) js::Vector<unsigned short, 32ul, js::ContextAllocPolicy>::growStorageBy(unsigned long) (jsutil.h:217)
00.53% (6,291,456B) js_CloneRegExpObject(JSContext*, JSObject*, JSObject*) (jsgcinlines.h:127)
00.52% (6,190,836B) nsTArray_base<nsTArrayDefaultAllocator>::EnsureCapacity(unsigned int, unsigned int) (nsTArray.h:68)

The total is 1,182,094,880 bytes.

  • 31.04% is from _dl_map_object_from_fd.  This corresponds to code and data segments, mostly from libraries.
  • 15.73% is from allocation points small enough that they fell below the threshold (0.5%) that I used for this run.
  • 15.62% is from pthread_create, i.e. thread stacks.  Hopefully most of this space also won’t be mapped in.
  • 5.68% is from pa_shm_create_rwBug 617852 is open about this.  It won’t be fixed until after Firefox 4.0, but that’s not so bad because /proc/pid/smaps tells me that hardly any of it is mapped into physical memory.
  • That leaves 31.93% of big, heap-ish allocations.  It’s pretty obvious that for this workload, the JS engine is being greedy, accounting for 26.42% of that 31.83%.  One piece of good news is that the three js::InitJIT() entries, which together account for 9.2%, will be greatly improved by bug 623428;  I’m hoping to reduce them by a factor of 10 or more.

If anyone wants Massif’s full output, I’ll be happy to give it to them.  The full output contains full stack traces, which can be useful.

Some conclusions.

  • I’m still worred about our memory consumption, and I intend to keep pushing on it, both before Firefox 4.0 is released and afterwards.
  • Massif takes a bit of getting used to, particularly when you are profiling a huge, messy program like Firefox.  But it’s the only space profiler I know of that gives information that is detailed enough to be really useful in reducing memory consumption.  Without it, we wouldn’t have made much progress on reducing Firefox 4.0’s space consumption.  I’d love for other people to run it, it works on Linux and Mac (not Windows, unfortunately).  I’m happy to help anyone who wants to try it via IRC or email.  For all the improvements done lately, I’ve only looked at a single workload on a single machine!  There’s much more analysis to be done.
  • If anyone knows of other decent memory profilers that can handle programs as complex as Firefox, I’d love to hear about it.  In particular, note that if you only measure the heap (malloc et al) you’re only getting part of the story;  this is again because we have multiple allocators which bypass malloc and use mmap/VirtualAlloc directly.
  • I wonder if we need better memory benchmarks.  I’d like to have some that are as easy to run as, say, SunSpider.  Better telemetry would also be great.