Categories
Firefox Garbage Collection Memory consumption MemShrink

More compacting GC

Jon Coppeard recently extended SpiderMonkey’s compacting GC abilities. Previously, the GC could only compact GC arena containing JavaScript objects. Now it can also compact arenas containing shapes (a data structure used within SpiderMonkey which isn’t visible to user code) and strings, which are two of the largest users of memory in the GC heap after objects.

These improvements should result in savings of multiple MiBs in most workloads, and they are on track to ship in Firefox 48, which will be released in early August. Great work, Jon!

Categories
Firefox Garbage Collection Memory consumption MemShrink

Compacting GC

Go read Jon Coppeard’s description of the compacting GC algorithm now used by SpiderMonkey!

Categories
B2G Fennec Firefox Garbage Collection Memory consumption MemShrink pdf.js

MemShrink’s 3rd birthday

June 14, 2014 was the third anniversary of the first MemShrink meeting. MemShrink is a mature effort at this point, and many of the problems that motivated its creation have been fixed. Nonetheless, there are still some areas for improvement. So, as I did at this time last year, I’ll take the opportunity to update the “big ticket items” list.

The Old Big Ticket Items List

#5: pdf.js

pdf.js is the PDF viewer that now ships by default in Firefox. I greatly reduced its memory usage in two rounds, first in February, and again in June. The first round of improvements were released in Firefox 29, and the second round is due to be released in Firefox 33, which should be out in mid-October.

pdf.js will still use more memory than native PDF viewers, but the situation has improved enough that it can be removed from this list.

#4: Dev tools

See below.

#3: B2G Nuwa

Cervantes Yu, Thinker Li, and others succeeded in landing Nuwa, an impressive technical achievement that increased the amount of memory sharing between different processes on Firefox OS. This allows many more apps to run at once. I think this is present in Firefox OS 1.3 and later.

#2: Compacting Generational GC

See below.

#1: Better Foreground Tab Image Handling

Timothy Nikkel completely fixed the massive spikes in decoded image data that we used to get on image-heavy pages. This was a fantastic improvement that shipped in Firefox 26.

The New Big Ticket Items List

In a break from tradition, I will present the items in alphabetical order, rather than ranking them. This reflects the fact that I don’t have a clear opinion on the relevant importance of these different items. (I view this as a good thing, because it means that I feel there aren’t any hair-on-fire problems.)

Better regression detection

areweslimyet.com (a.k.a. AWSY) is our best tool for detecting memory usage regressions. It currently tracks Firefox and Firefox for Android, and there are plans to integrate Firefox OS.

Unfortunately, although AWSY has been successful at detecting large regressions, leading to them being fixed, its measurements are noisy enough that detecting smaller regressions is difficult. As a result, the general trend of the graphs has been upward. I do not think this is as bad as it looks at first glance, because Firefox’s behaviour in the worst cases — which matter more than the average case — is much better than it used to be. Nonetheless, improved sensitivity here would be an excellent thing, and Eric Rahm is actively working on this.

Developer tools

Developer-oriented memory profiling tools are under active development by Nick Fitzgerald, Jim Blandy, and others. A lot of the necessary profiling infrastructure is in place, and this seems to be progressing well, though I don’t know when it’s expected to be finished.

By the way, if you haven’t tried Firefox’s dev tools recently, you should! They have improved an incredible amount in the past year or so.

GC Arena Fragmentation

Generational GC landed a few months ago. I had been hoping that this would help reduce GC fragmentation, but the effect was small. It looks like compacting GC is what’s needed to make a big difference here, though some smaller tweaks may help things a little.

Tarako

Tarako is the codename for the “$25 phone” running Firefox OS that will ship in India and other countries later this year. It has a paltry 128 MiB of RAM, so memory usage is critical. Since the hardware first became available to Mozilla employees at the start of the year, Tarako has improved from “almost unusable” to “not bad”. But apps still close due to OOMs fairly frequently, especially when a user does something that involves two apps working together in some way.

There is no single change that will decisively fix this problem for Tarako;  further improvements will require an ongoing grind of work from many engineers. Improvements made for Tarako are also likely to benefit higher-end Firefox OS devices as well.

Windows OOM crashes

The number of out-of-memory (OOM) crashes that occur on Windows is relatively high. A sizeable fraction of these appear to be 32-bit virtual OOM crashes, caused by running out of address space.

Things that will mitigate this include modifications to jemalloc and the JS allocator, as well as Electrolysis. And some additional data and analysis may help us understand the problem better.

The ultimate solution, for users on 64-bit versions of Windows, is 64-bit Firefox builds for Windows, though it’ll be a while before those builds are in good enough shape to ship to regular users.

Summary

Three items from the old list (pdf.js, Nuwa, image handling) have been ticked off.  Two items remain (devtools, GC fragmentation), the latter in altered form, and both are a lot closer to completion than they were. Three new items (regression detection, Tarako, and Windows OOMs) have been added.

Let me know if I’ve omitted anything important!

Categories
Firefox Garbage Collection Memory consumption MemShrink

Generational GC has landed

Big news: late last week, generational garbage collection landed. It was backed out at first due to some test failures, but then re-landed and appears to have stuck.

This helps with performance. There are certain workloads where generational GC makes the code run much faster, and Firefox hasn’t been able to keep up with Chrome on these. For example, it has made Firefox slightly faster on the Octane benchmark, and there is apparently quite a bit of headroom for additional improvements.

Interestingly, its effect on memory usage has been small. I was hoping that the early filtering of many short-lived objects would make the tenured heap grow more slowly and thus reduce memory usage, but the addition of other structures (such as the nursery and store buffers) appears to have balanced that out.

The changes to the graphs at AWSY have been all within the noise, with the exception of the “Fresh start” and “Fresh start [+30s]” measurements in the “explicit” graph, both of which ticked up slightly. This isn’t cause for concern, however, because the corresponding “resident” graph hasn’t increased accordingly, and “resident” is the real metric of interest.

“Compacting Generational GC” is the #1 item on the current MemShrink “Big Ticket Items” list. Hopefully the “compacting” part of that, which still remains to be done, will produce some sizeable memory wins.

Categories
Garbage Collection MemShrink

A big step towards generational and compacting GC

People frequently ask me for status updates on generational GC, and I usually say I’ll tell them when something notable happens. Well, something notable just happened: exact rooting landed.

What is exact rooting? In order to support generational and/or compacting GC, you need to be able to move GC-allocated things such as objects around. This means you can’t have raw C++ pointers to any objects that might move; instead, you need some kind of indirect pointer that can be updated when necessary.

Unfortunately, both the JS engine and Gecko have a lot of pointers to GC-allocated things. The process of checking and converting them has been the main part of a task called “exact rooting”, and that’s what just finished. This has required an enormous amount of what is essentially very tedious work. Jim Blandy summarized it nicely, as follows.

I’ve never heard of a major project escaping from conservative GC once it had entered that state of sin; nor have I heard of anyone implementing a moving collector after starting with a non-moving collector. So, doing *both* is impressive. I hope it pays off big!

Major kudos to Terrence Cole, Steve Fink, Jon Coppeard, Brian Hackett, and the small army of other helpers who did this. Now that they’ve finished eating this gigantic serving of vegetables, they can move onto dessert, i.e. making the GC generational and compacting.

Categories
DMD Firefox Garbage Collection Memory consumption MemShrink

MemShrink progress, week 85–86

Lots of news today.

Fixed Regressions

I wrote last time about a couple of bad regressions that AWSY identified.

The ongoing DOM bindings work will hopefully fully fix the second regression before the end of this development cycle (February 18).

AWSY

John Schoenick made three big improvements to AWSY.

  • It now measures every push to mozilla-inbound.  Previously it measured mozilla-central once per day.  This will make it easier and faster to identify patches responsible for regressions.
  • It’s now possible to trigger an AWSY run for any try build.  Unfortunately John hasn’t yet written instructions on how to do this;  I hope he will soon…
  • AWSY now measures Fennec as well.  Kartikaya Gupta created the benchmark that is used for this.  He also fixed a 4 MB regression that it identified.

Leaks Fixed

Benoit Jacob fixed a CC leak that he found with his refgraph tool.

Johnny Stenback fixed a leak involving SVG that he found with DMD.  This was a very slow leak that Johnny had seen repeatedly, which manifested as slowly increasing “heap-unclassified” values in about:memory over days or even weeks.  It’s a really nice case because it shows that DMD can be used on long-running sessions with minimal performance impact.

Justin Lebar fixed a B2G leak relating to forms.js.

Randall Jesup fixed a leak relating to WebRTC.

Andrew McCreight fixed a leak relating to HTMLButtonElement.

Erik Vold fixed a leak in the Restartless Restart add-on.

Miscellaneous

Brian Hackett optimized the representation of JS objects that feature both array (indexed) elements and named properties.  Previously, if an object had both elements and named properties, it would use a sparse representation that was very memory-inefficient if many array elements were present.  This performance fault had been known for a long time, and it caused bad memory blow-ups every once in a while, so it’s great to have it fixed.

As a follow-up, Brian also made it possible for objects that use the sparse representation to change back to the dense array representation if enough array elements are subsequently added.  This should also avoid some occasional blow-ups that occur when arrays get filled in in complex ways.

Gregory Szorc reduced the memory consumption of the new Firefox Health Report feature, from ~3 MB to ~1–1.5 MB: here and here and here and here. On a related note, Bill McCloskey is making good progress with reducing compartment overhead, which should be a sizeable win once it lands.

Gregory also reduced the memory consumption of Firefox Sync:  https: here and here.

Jonathan Kew reduced the amount of memory used by textruns when Facebook Messenger is enabled.

The Add-on SDK is now present in mozilla-central, which is a big step towards getting all add-ons that use it to always use the latest version.  This is nice because it will mean that when memory leaks in the SDK are fixed (and there have been many) all add-ons that use it will automatically get the benefit, without having to be repacked.

Generational GC

Generational garbage collection is an ongoing JS engine project that should reap big wins once it’s completed.  I don’t normally write about things that haven’t been finished, but this is a big project and I’ve had various people asking about it recently, so here’s an update.

Generational GC is one the JS teams two major goals for the near-term.  (The other is benchmark and/or game performance, I can’t remember which.)  You can see from the plan that there are eight people working on it (though not all of them are working on it all the time).

Brian Hackett implemented a static analysis that can determine which functions in the JS engine can trigger garbage collection.  On top of that, he then implemented a static analysis that can identify rooting hazards and unnecessary roots.  This may sound esoteric, but it has massively reduced the amount of work required to complete exact rooting, which is the key prerequisite for generational GC.  To give you an idea:  Terrence Cole estimated that it reduced the number of distinct code locations that need to be looked at and possibly modified from ~10,000 to ~200!  Great stuff.

Another good step was taken when I removed support for E4X from the JS engine.  E4X is an old JavaScript language extension that never gained wide support and was only implemented in Firefox.  The code implementing it was complicated, and an ongoing source of many bugs and security flaws.  The removal cut almost 13,000 lines of code and over 16,000 lines of tests.  It’s been destined for the chopping block for a long time, and its presence has been blocking generational GC, so all the JS team members are glad to see it go.

Bug Counts

Here are the current bug counts.

  • P1: 16 (-5/+0)
  • P2: 119 (-6/+0)
  • P3: 104 (-0/+0)
  • Unprioritized: 22 (-0/+18)

Three of the P1 “fixes” weren’t actual fixes, but cases where a bug was WONTFIXed, or downgraded.  The unprioritized number is high because we skipped this week’s MemShrink meeting due to the DOM work week in London, which occupied three of our regular contributors.

Categories
Firefox Garbage Collection Memory consumption MemShrink

MemShrink progress, week 65–66

Gecko

Tim Taubert set the style of a not-yet-restored tab’s <browser> element to display:none, eliminating the need for any layout data to be stored in memory for such a tab.  This was a MemShrink:P1 bug and is a nice improvement for users who typically have many (e.g. 100+) tabs open, because it saves 0.17MB per not-yet-restored tab on 64-bit platforms, and slightly less on 32-bit platforms.

Bobby Holley fixed a defect that was causing some add-ons (NoScript, Roboform, and Google PageSpeed) to create ghost windows.   This fix has been also been ported to the Aurora and Beta channels and so will be present in Firefox 16.

Add-on SDK

Version 1.10 of the Add-on SDK was released.  It has two fixes that prevent various leaks.  Furthermore, Alexandre Poirot fixed two other leaks in the Add-on SDK;  these changes will presumably make it into version 1.11.

The Add-on SDK has had a lot of leaks fixed over the past few months.  Hopefully we’re getting near the end of them!

Generational GC

I have started helping with the ongoing project to convert the JavaScript engine’s mark-and-sweep garbage collector to a compacting, generational collector.  This is the #2 item on the current MemShrink “Big Ticket Items” list because it should significantly reduce JS memory consumption, and it should also help performance in other ways.

It’s a big task because it makes a very fundamental change to the JS engine: garbage-collected things such as JS objects, strings and functions can move.  This is a big deal because these things are represented within the JS engine as C++ objects of various kinds, and it’s not normal for C++ objects to move!  Think about it — if you have a pointer to a C++ object, and the object moves, the pointer is no longer valid.

I won’t go into detail about how we handle this but the important thing to know is that pretty much every place in the JS engine where we have a raw C++ pointer to a GC thing object needs to be manually changed to use a new representation.  This is literally tens of thousands of changes that must be completed before the garbage collector can be made either compacting or generational (the two properties are orthogonal, with both providing benefits).

If you are interested in following the progress of this conversion, take a look at bug 753203.

A reminder

In these MemShrink reports I usually write about Firefox changes just after they first land on mozilla-central.  Such changes will show up in Nightly builds within a day, but won’t reach an official Firefox release for 12–18 weeks, as per Firefox’s release schedule.  If you remember that you’ll avoid any confusion about which changes are in which release.

For example:  except where noted otherwise, the changes I’ve mentioned above will be in Firefox 18 — assuming they don’t cause problems that cause them to be backed out — which is due for final release in early January, 2013. (The current scheduled release date is January 1st, but that will probably be delayed slightly because New Year’s Day is not a good day for a release!)

Bug Counts

Here are the current bug counts.

  • P1: 21 (-1/+0)
  • P2: 89 (-5/+4)
  • P3: 100 (-3/+7)
  • Unprioritized: 3 (-2/+3)
Categories
add-ons Firefox Garbage Collection Memory consumption MemShrink

MemShrink progress, week 57–60

I’ve been on vacation for two weeks, so this report covers the past four weeks.  I still have a mountain of unread emails, bug reports and blog posts to get through, but hopefully I haven’t missed much.

Hueyfix

I wrote about Firefox 15 and how it contains the “Hueyfix” that prevents most memory leaks caused by add-ons.  It got lots of attention.

Relatedly, a regression caused by the Hueyfix was discovered:  it caused some Greasemonkey scripts to leak badly, such as “YousableTubeFix” and “Textarea backup with expiry”.  A change was made to Firefox to allow this to be prevented (which has been backported to Firefox 15 Beta), and Greasemonkey 0.9.22 should fix the problem, although that hasn’t yet been confirmed.  If you have had problems with Firefox 15 and you are using Greasemonkey, this is a likely cause.  I’m not aware of any other regressions caused by the Hueyfix.

Also relatedly, Gabor Krizsanits made a change inspired by the Hueyfix that cuts references to sandboxes once they should no longer be used.  This prevents a whole class of possible leaks in add-ons using the Add-on SDK.

Miscellaneous

Gregor Wagner tweaked the JS engine’s garbage collection heuristics to greatly reduce the peak memory consumption in certain cases.  Gregor previously tweaked the GC heuristics in Firefox 7 with great success.

Tim Taubert fixed a leak caused by opening and closing the bookmarks sidebar.  This was a precursor to a more important change from Tim, which adds automated checking of the cycle collection logs to check for leaks during testing.  This should allow a whole class of memory leaks to be detected automatically, thus preventing regressions.

Benoit Jacob made a change that prevents the number of WebGL contexts growing excessively.  This can greatly improve memory consumption on certain sites that use WebGL.

Nick Cameron fixed a problem that caused huge memory consumption (multiple GB) on pages using canvas in conjunction with certain Intel graphics cards and/or drivers.  I don’t understand the details, but it sounds like some cards and/or drivers might still have problems.

Bug Counts

Here are the current bug counts.

  • P1: 23 (-0/+3)
  • P2: 89 (-9/+8)
  • P3: 105 (-2/+5)
  • Unprioritized: 1 (-2/+1)

Nothing spectacular there.

Categories
about:memory add-ons Firefox Garbage Collection Memory consumption MemShrink

MemShrink progress, week 55-56

Memory Reporting

I changed things so that JavaScript memory consumption for web content is reported on a per-tab basis, as the following example shows.

│  ├────4,472,568 B (00.50%) -- top(http://www.mozilla.org/en-US/firefox/fx/, id=236)/active
│  │    ├──4,192,640 B (00.47%) -- window(http://www.mozilla.org/en-US/firefox/fx/)
│  │    │  ├──1,979,112 B (00.22%) ++ js/compartment(http://www.mozilla.org/en-US/firefox/fx/)
│  │    │  ├──1,607,216 B (00.18%) ++ layout
│  │    │  ├────352,520 B (00.04%) ── style-sheets
│  │    │  ├────253,312 B (00.03%) ++ dom
│  │    │  └────────480 B (00.00%) ── property-tables

All the major components of each tab’s memory consumption — JS, layout, style sheets, and DOM — are now reported on a per-tab basis.  This is great, because it’s something that people have been requesting for  years.  However, the presentation is still intimidating.  Consider the following excerpt from about:memory.

├───18,288,696 B (16.43%) -- window-objects
│   ├───6,263,208 B (05.62%) ++ top(about:memory?verbose, id=6)/active
│   ├───5,090,352 B (04.57%) ++ top(chrome://browser/content/browser.xul, id=1)/active
│   ├───3,422,280 B (03.07%) ++ top(http://www.mozilla.org/en-US/firefox/fx/, id=17)/active/window(http://www.mozilla.org/en-US/firefox/fx/)
│   ├───3,178,432 B (02.85%) ++ top(chrome://global/content/console.xul, id=21)/active
│   └─────334,424 B (00.30%) ++ top(resource://gre-resources/hiddenWindow.html, id=3)/active/window(resource://gre-resources/hiddenWindow.html)

Among those top(...) entries are two browser tabs (one for www.mozilla.org, one for about:memory), two browser chrome windows (browser.xul is the main browser window, and console.xul is the error console window), and the hidden window which is always present.  Firefox developers can easily understand this, and technically-inclined users may be able to guess what’s going on, but the average user will struggle.

From a user’s point of view, the visible things they have control over (i.e. windows and tabs) should be better distinguished from everything else, and be shown with nicer names than “browser.xul”.  But the architecture of Firefox’s internals doesn’t make this easy.  I’ve made one not-very-successful attempt to improve this, and I’d love to hear suggestions from other Firefox devs on how to present this information better.

(The step after that one is to present some kind of “tab manager” — a massively stripped-down variant of about:memory that ordinary users can understand.  This would also require localization for all the languages that Firefox supports.  One step at a time!)

Finally, another memory reporting improvement happened:  Andrew McCreight and I added measurement of orphan DOM nodes.  These are DOM nodes that have been discarded by a page but are still accessible from JavaScript objects.   They were the biggest single remaining contributor to “heap-unclassified”.  For example, when I hit the “update” button on about:memory I get 5MB of them (don’t worry, they go away when the garbage collector runs).  Also, badly coded sites can create large numbers of them.  So it’s a good thing to be able to measure, for both users and web developers.

Miscellaneous

Mihai Sucan fixed a bad leak involving pages that use window.console.  Multiple people reported that this caused Firefox’s memory consumption to balloon to multiple GB.  This leak was introduced during the Firefox 15 development cycle, and the fix has been backported to the Aurora channel, which is where Firefox 15 currently resides.  One notable thing about this fix is that the problem was quite easy to diagnose because about:memory clearly indicated that the ConsoleAPI.js compartment was responsible for most of the memory consumption.  Without the fine-grained memory reporting that was enabled by compartment-per-global, that memory would have been reported in a generic “System Principal” compartment which would have made diagnosis much harder.

Wladimir Palant fixed an issue in AdBlock Plus that causes its memory consumption to slowly grow when viewing sites that repeatedly reset the src property of images, such as Mibbit.  (The fine-grained memory reporting enabled by compartment-per-global also made this diagnosis much easier.)  This fix is in Adblock Plus 2.1.

Alexandre Poirot fixed a minor leak in the Add-on SDK.

I wrote about the difficulties of cross-browser memory comparisons.

Bug Counts

Here are the current bug counts.

  • P1: 20 (-3/+0)
  • P2: 90 (-3/+6)
  • P3: 102 (-6/+2)
  • Unprioritized: 2 (-0/+0)

A net reduction of seven bugs!

Update on The big ticket Items

In January, I described six “big ticket items” that needed tackling to improve Firefox’s memory consumption.  Let’s look at how they’ve progressed since then.

#6: Better Script Handling

This had two parts.  The first part was to only generate bytecode for a function once it is run.  I’ve made a good chunk of progress towards and have it working on very simple examples.  This has required a great deal of refactoring of the SpiderMonkey front-end.  (The front-end is a hairy piece of code, so this is virtuous in and of itself.)  There are still a couple of other bugs blocking it from further progress.  I intend to return to continue on this once they are done.

The second part was to share immutable parts of scripts between web pages.  No progress has been made on this.

So, overall, this item is about 25% done, and progress is still ticking along slowly.

#5: Better Memory Reporting

This one also had two parts.  The first part was to reduce about:memory’s “heap-unclassified” number (a.k.a “dark matter”) to typically 10%.  People such as Nathan Froyd and I have made good progress on this.  It’s now occasionally below 10% (my current session shows 7.5%) but often is around 15%.  That’s much better than the 20–25% we typically were getting at the start of the year, and it’s low enough that people rarely complain about it now.  And we’re very much into the long tail now, so it’ll be hard to improve things much further.  For the most part I don’t think we need to.

The second part was to report memory in a per-tab fashion.  As mentioned above, I just completed this, although the presentation is not as user-friendly as it could be.

The per-tab reporting was enabled by compartment-per-global.  Compartment-per-global also gives us much more insight into the memory consumption of Firefox’s own JavaScript code, and even some idea about add-on memory consumption, which was (to me) an unexpected bonus.  Indeed, its usefulness was demonstrated by the two leak fixes mentioned above.

So, overall, this item is about 80% done.  Although there is still some work to be done, it has progressed enough that I will remove it from the “big ticket items” list.

#4: Better Memory Consumption Tracking

We can cross this item off the list, thanks to areweslimyet.com.  In January I also mentioned the idea of using telemetry for this, but we’ve found that telemetry results are so noisy that little (with rare exceptions) can be gleaned from it, so there’s not really anything to be done on that front.

#3: Compacting Generational GC

This is one of the two key SpiderMonkey performance features under development (the other being IonMonkey), and so people such as Terrence Cole, Steve Fink, Brian Hackett, and Bill McCloskey and actively working on it.  Unfortunately, it’s a huge undertaking that requires rewriting many of SpiderMonkey’s internal and external APIs.  If I had to guess I’d say it’s 25% complete, but that really is just a wild guess.  I’ll be pleased if it is finished before the end of the year.

#2: Better Foreground Tab Image Handling

This is the big ticket item for which the least progress has been made. There’s a single bug that is blocking all the follow-on work.  Both Timothy Nikkel and Jet Villegas have spent time working on it, but it has been a difficult nut to crack.  Justin Lebar had a recent suggestion for narrowing its scope slightly.  I hope it’s a good suggestion, because I’m out of ideas on this one.

#1: Better Detection and Notification of Leaky Add-ons

This is the most satisfying item of the lot.  I expected to make only grudging, piecemeal progress, but Kyle Huey’s fix to prevent zombie compartments prevents the vast majority of add-on leaks, enough to declare victory and cross this item off the list.  I’ll be writing more about this next week.

Summary

Three items (#1, #4, #5) have progressed enough that they can be removed from the list.  Only one of these directly improved Firefox’s memory consumption;  the other two were about better measuring and monitoring of memory consumption.

The remaining items are about reducing memory consumption.  Two of them (#3, #6) have a long way to go, but progress has been made and is ongoing.  One item (#2) has made little progress and has stalled.

The New big ticket Items

Here’s my updated list of the most important things.

#5: Better Script Handling

As mentioned above, this has two parts: lazy bytecode generation, and the  sharing of immutable parts of scripts.  I intend to continue working on the first part.  Once that’s done, it may turn out that the second part isn’t necessary;  we’ll see.

#4: Regain compartment-per-global losses

The measurements on areweslimyet.com have been creeping up for the past two months.  The major cause is compartment-per-global, which has lots of benefits (as mentioned above) but also increases memory consumption by a small-to-moderate amount across the board.  This is because there are many more compartments than there used to be, and there’s a certain amount of overhead and waste in each compartment.

Generational GC will help, but there are some other things that can be done more quickly that will help.  See the tracking bug for one example.

#3: Boot2Gecko

Boot2Gecko (now officially known as “Firefox OS”) is going to be running on low-end phones without much physical memory, so that’ll require care.  The first step is to get about:memory working on B2G.  The next step is to find a way to copy the data from about:memory somewhere else, because B2G doesn’t have cut and paste!  Beyond that, it’s unclear;  but once about:memory is working it’s very likely it will identify some sub-optimal B2G-specific behaviour.

#2: Compacting Generational GC

Let me quote myself to explain the memory consumption benefits of compacting, generational GC.

Virtual memory consumption drops in two ways.  First, the compaction minimizes waste due to fragmentation.  Second, the heap grows more slowly.  Physical memory consumption drops for the same two reasons.

The performance benefits are also significant.

Performance improves for three reasons.  First, paging is reduced because of the generational behaviour:  much of the JS engine activity occurs in the nursery, which is small;  in other words, the memory activity is concentrated within a smaller part of the working set.  Second, paging is further reduced because of the compaction: this reduces fragmentation within pages in the tenured heap, reducing the total working set size.  Third, the tenured heap grows more slowly because of the generational behaviour… which means that structure traversals done by the garbage collector (during full-heap collections) and cycle collector are faster.

Important stuff.

#1: Better Foreground Tab Image Handling

On image-heavy pages, Firefox uses much more memory than other browsers.  This includes things like Facebook image slideshows.  One commenter said the following.

On behalf of Facebook Inc, let me just say that we are prepared to give over one thousand free “pokes” to anyone who fixes this bug or alternatively https://bugzilla.mozilla.org/show_bug.cgi?id=683290. I will also gladly show you Mark Zuckerberg’s desk and give you free dinner and cookies as part of a complementary tour of Facebook HQ in Menlo Park.

I have no idea if this person is really from Facebook, but it’s certainly suggestive.  Also, I’ve heard from B2G people that they are having to work around this problem in their Gallery app.

To repeat myself from week 32:  there are three MemShrink:P1 bugs relating to this:  one about not decoding all images immediately, one about discarding non-visible decoded images after some time, and one about some infrastructure work that is required for the first two.  (See this discussion on the dev-platform mailing list for more details about this topic.)

Summary

There are three repeat items, and two new items, but there are fewer items than last time;  this reflects the fact that we are in a better position than we were in January.  If you think I’ve overestimated or underestimated the importance of any of these, or omitted anything, I’d be interested to hear.

One final thing:  last time, several people suggested “better reporting of add-on memory consumption”.  If I knew of any ideas on how to do this better than about:memory currently does, I’d gladly put it on the list.  But I don’t, and there doesn’t seem to be much point to put an item on the list that we don’t know how to implement.

Vacation

I’m taking the next two weeks as vacation, so there won’t be a MemShrink report on July 24.  I’ll be back with the next MemShrink round-up on August 8th.  See you then.
Categories
Firefox Garbage Collection Google Chrome Memory consumption MemShrink Opera Performance

How to Compare the Memory Efficiency of Web Browsers

TL;DR: Cross-browser comparisons of memory consumption should be avoided.  If you want to evaluate how efficiently browsers use memory, you should do cross-browser comparisons of performance across several machines featuring a range of memory configurations.

Cross-browser Memory Comparisons are Bad

Various tech sites periodically compare the performance of browsers.  These often involve some cross-browser comparisons of memory efficiency.  A typical one would be this:  open a bunch of pages in tabs, measure memory consumption, then close all of them except one and wait two minutes, and then measure memory consumption again.  Users sometimes do similar testing.

I think comparisons of memory consumption like these are (a) very difficult to make correctly, and (b) very difficult to interpret meaningfully.  I have suggestions below for alternative ways to measure memory efficiency of browsers, but first I’ll explain why I think these comparisons are a bad idea.

Cross-browser Memory Comparisons are Difficult to Make

Getting apples-to-apples comparisons are really difficult.

  1. Browser memory measurements aren’t easy.  In particular, all browsers use multiple processes, and accounting for shared memory is difficult.
  2. Browsers are non-deterministic programs, and this can cause wide variation in memory consumption results.  In particular, whether or not the JavaScript garbage collector runs can greatly reduce memory consumption.  If you get unlucky and the garbage collector runs just after you measure, you’ll get an unfairly high number.
  3. Browsers can exhibit adaptive memory behaviour.  If running on a machine with lots of free RAM, a browser may choose to take advantage of it;  if running on a machine with little free RAM, a browser may choose to discard regenerable data more aggressively.

If you are comparing two versions of the same browser, problems (1) and (3) are avoided, and so if you are careful with problem (2) you can get reasonable results.  But comparing different browsers hits all three problems.

Indeed, Tom’s Hardware de-emphasized memory consumption measurements in their latest Web Browser Grand Prix due to problem (3).  Kudos to them!

Cross-browser Memory Comparisons are Difficult to Interpret

Even if you could get the measurements right, memory consumption is still not a good thing to compare.  Before I can explain why, I’ll introduce a couple of terms.

  • A primary metric is one a user can directly perceive.  Metrics that measure performance and crash rate are good examples.
  • A secondary metric is one that a user can only indirectly perceive via some kind of tool.  Memory consumption is one example.  The L2 cache miss rate is another example.

(I made up these terms, I don’t know if there are existing terms for these concepts.)

Primary metrics are obviously important, precisely because user can detect them.  They measure things that users notice:  “this browser is fast/slow”, “this browser crashes all the time”, etc.

Secondary metrics are important because they can affect primary metrics:  memory consumption can affect performance and crash rate;  the L2 cache miss rate can affect performance.

Secondary metrics are also difficult to interpret.  They can certainly be suggestive, but there are lots of secondary metrics that affect each primary metric of interest, so focusing too strongly on any single secondary metric is not a good idea.  For example, if browser A has a higher L2 cache miss rate than browser B, that’s suggestive, but you’d be unwise to draw any strong conclusions from it.

Furthermore, memory consumption is harder to interpret than many other secondary metrics.  If all else is equal, a higher L2 cache miss rate is worse than a lower one.  But that’s not true for memory consumption.  There are all sorts of time/space trade-offs that can be made, and there are many cases where using more memory can make browsers faster;  JavaScript JITs are a great example.

And I haven’t even discussed which memory consumption metric you should use.  Physical memory consumption is an obvious choice, but I’ll discuss this more below.

A Better Methodology

So, I’ve explained why I think you shouldn’t do cross-browser memory comparisons.  That doesn’t mean that efficient usage of memory isn’t important! However, instead of directly measuring memory consumption — a secondary metric — it’s far better to measure the effect of memory consumption on primary metrics such as performance.

In particular, I think people often use memory consumption measurements as a proxy for performance on machines that don’t have much RAM.  If you care about performance on machines that don’t have much RAM, you should measure performance on a machine that doesn’t have much RAM instead of trying to infer it from another measurement.

Experimental Setup

I did exactly this by doing something I call memory sensitivity testing, which involves measuring browser performance across a range of memory configurations.  My test machine had the following characteristics.

  • CPU: Intel i7-2600 3.4GHz (quad core with hyperthreading)
  • RAM: 16GB DDR3
  • OS: Ubuntu 11.10, Linux kernel version 3.0.0.

I used a Linux machine because Linux has a feature called cgroups that allows you to restrict the machine resources available to one or more processes.  I followed Justin Lebar’s instructions to create the following configurations that limited the amount of physical memory available: 1024MiB, 768MiB, 512MiB, 448MiB, 384MiB, 320MiB, 256MiB, 192MiB, 160MiB, 128MiB, 96MiB, 64MiB, 48MiB, 32MiB.

(The more obvious way to do this is to use ulimit, but as far as I can tell it doesn’t work on recent versions of Linux or on Mac.  And I don’t know of any way to do this on Windows.  So my experiments had to be on Linux.)

I used the following browsers.

  • Firefox 12 Nightly, from 2012-01-10 (64-bit)
  • Firefox 9.0.1 (64-bit)
  • Chrome 16.0.912.75 (64-bit)
  • Opera 11.60 (64-bit)

IE and Safari aren’t represented because they don’t run on Linux.  Firefox is over-represented because that’s the browser I work on and care about the most 🙂  The versions are a bit old because I did this testing about six months ago.

I used the following benchmark suites:  Sunspider v0.9.1, V8 v6, Kraken v1.1.  These are all JavaScript benchmarks and are all awful for gauging a browser’s memory efficiency;  but they have the key advantage that they run quite quickly.  I thought about using Dromaeo and Peacekeeper to benchmark other aspects of browser performance, but they take several minutes each to run and I didn’t have the patience to run them a large number of times.  This isn’t ideal, but I did this exercise to test-drive a benchmarking methodology, not make a definitive statement about each browser’s memory efficiency, so please forgive me.

Experimental Results

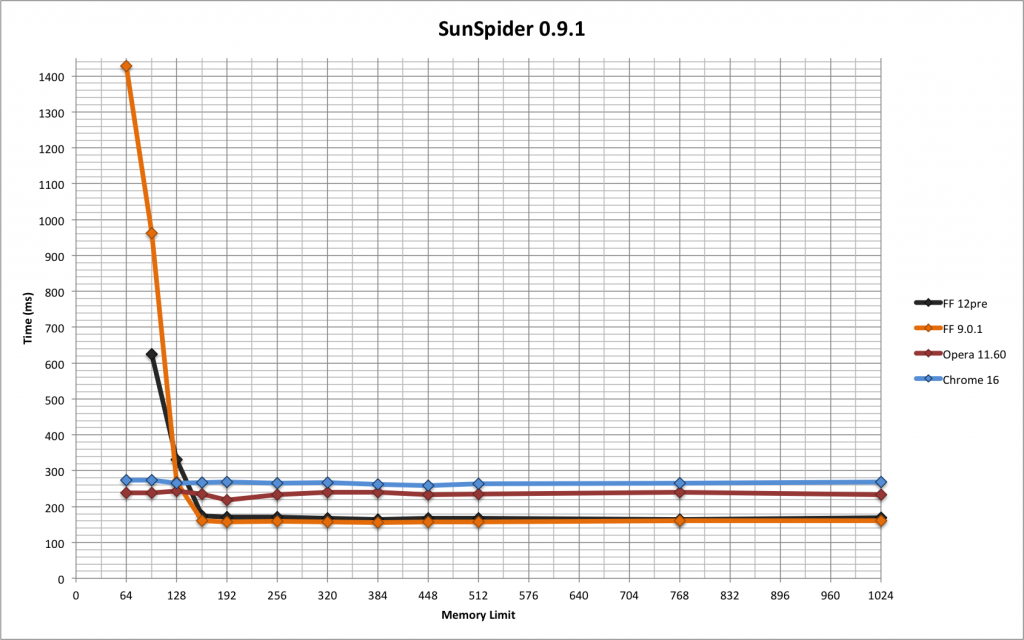
The following graph shows the Sunspider results.  (Click on it to get a larger version.)

sunspider results graph

As the lines move from right to left, the amount of physical memory available drops.  Firefox was clearly the fastest in most configurations, with only minor differences between Firefox 9 and Firefox 12pre, but it slowed down drastically below 160MiB;  this is exactly the kind of curve I was expecting.  Opera was next fastest in most configurations, and then Chrome, and both of them didn’t show any noticeable degradation at any memory size, which was surprising and impressive.

All the browsers crashed/aborted if memory was reduced enough.  The point at which the graphs stop on the left-hand side indicate the lowest size that each browser successfully handled.  None of the browsers ran Sunspider with 48MiB available, and FF12pre failed to run it with 64MiB available.

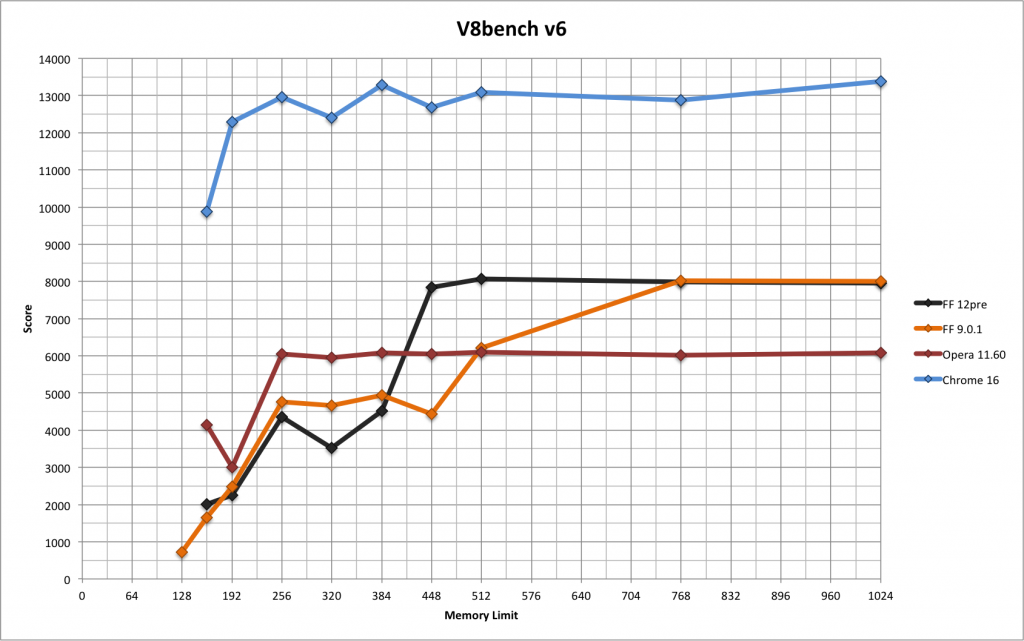
The next graph shows the V8 results.

v8 results graph

The curves go the opposite way because V8 produces a score rather than a time, and bigger is better.  Chrome easily got the best scores.  Both Firefox versions degraded significantly.  Chrome and Opera degraded somewhat, and only at lower sizes.  Oddly enough, FF9 was the only browser that managed to run V8 with 128MiB available;  the other three only ran it with 160MiB or more available.

I don’t particularly like V8 as a benchmark.  I’ve always found that it doesn’t give consistent results if you run it multiple times, and these results concur with that observation.  Furthermore, I don’t like that it gives a score rather than a time or inverse-time (such as runs per second), because it’s unclear how different scores relate.

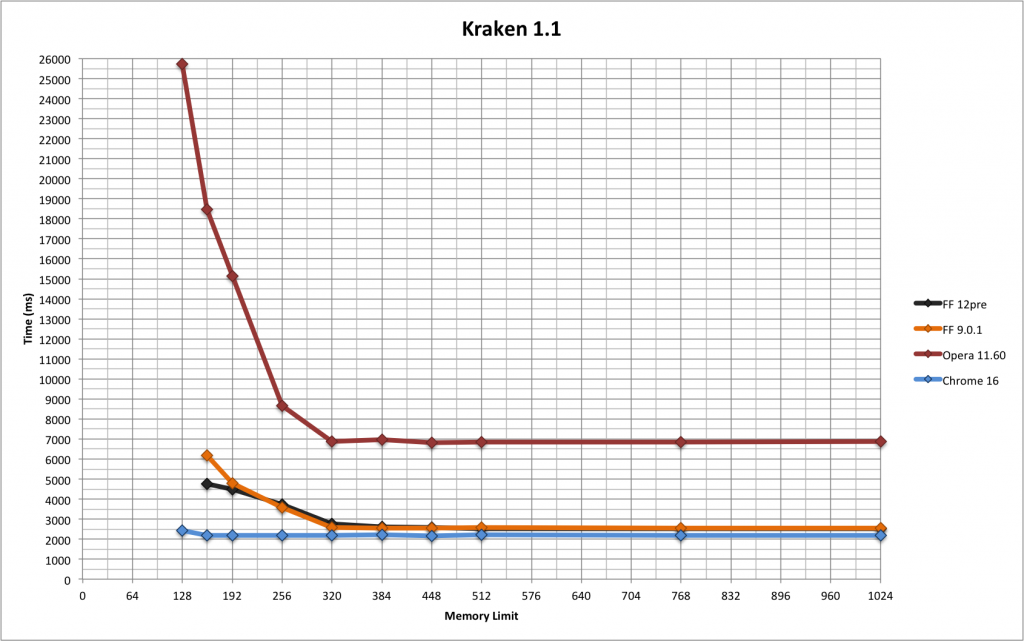
The final graph shows the Kraken results.

kraken results graph

As with Sunspider, Chrome barely degraded and both Firefoxes degraded significantly.  Opera was easily the slowest to begin with and degraded massively;  nonetheless, it managed to run with 128MiB available (as did Chrome), which neither Firefox managed.

Experimental Conclusions

Overall, Chrome did well, and Opera and the two Firefoxes had mixed results. But I did this experiment to test a methodology, not to crown a winner.  (And don’t forget that these experiments were done with browser versions that are now over six months old.)  My main conclusion is that Sunspider, V8 and Kraken are not good benchmarks when it comes to gauging how efficiently browsers use memory.  For example, none of the browsers slowed down on Sunspider until memory was restricted to 128MiB, which is a ridiculously small amount of memory for a desktop or laptop machine;  it’s small even for a smartphone.  V8 is clearly stresses memory consumption more, but it’s still not great.

What would a better benchmark look like?  I’m not completely sure, but it would certainly involve opening multiple tabs and simulate real-world browsing. Something like Membench (see here and here) might be a reasonable starting point.  To test the impact of memory consumption on performance, a clear performance measure would be required, because Membench lacks one currently.  To test the impact of memory consumption on crash rate, Membench could be modified to just keep opening pages until the browser crashes.  (The trouble with that is that you’d lose your count when the browser crashed!  You’d need to log the current count to a file or something like that.)

BTW, if you are thinking “you’ve just measured the working set size“, you’re exactly right! I think working set size is probably the best metric to use when evaluating memory consumption of a browser.  Unfortunately it’s hard to measure (as we’ve seen) and it is best measured via a  curve rather than a single number.

 A Simpler Methodology

I think memory sensitivity testing is an excellent way to gauge the memory efficiency of different browsers.  (In fact, the same methodology can be used for any kind of program, not just browsers.)

But the above experiment wasn’t easy:  it required a Linux machine, some non-trivial configuration of that machine that took me a while to get working, and at least 13 runs of each benchmark suite for each browser.  I understand that tech sites would be reluctant to do this kind of testing, especially when longer-running benchmark suites such as Dromaeo and Peacekeeper are involved.

A simpler alternative that would still be quite good would be to perform all the performance tests on several machines with different memory configurations.  For example, a good experimental setup might involve the following machines.

  • A fast desktop with 8GB or 16GB of RAM.
  • A mid-range laptop with 4GB of RAM.
  • A low-end netbook with 1GB or even 512MB of RAM.

This wouldn’t require nearly as many runs as full-scale memory sensitivity testing would.  It would avoid all the problems of cross-browser memory consumption comparisons:  difficult measurements, non-determinism, and adaptive behaviour.  It would avoid secondary metrics in favour of primary metrics.  And it would give results that are easy for anyone to understand.

(In some ways it’s even better than memory sensitivity testing because it involves real machines — a machine with a 3.4GHz i7-2600 CPU and only 128MiB of RAM isn’t a realistic configuration!)

I’d love it if tech sites started doing this.