Lots of important MemShrink stuff has happened in the last 27 days: 22 bugs were fixed, and some of them were very important indeed.
Images
Timothy Nikkel fixed bug 847223, which greatly reduces peak memory consumption when loading image-heavy pages. The combination of this fix and the fix from bug 689623 — which Timothy finished earlier this year and which shipped in Firefox 24 — have completely solved our longstanding memory consumption problems with image-heavy pages! This was the #1 item on the MemShrink big ticket items list.
To give you an idea of the effect of these two fixes, I did some rough measurements on a page containing thousands of images, which are summarized in the graph below.
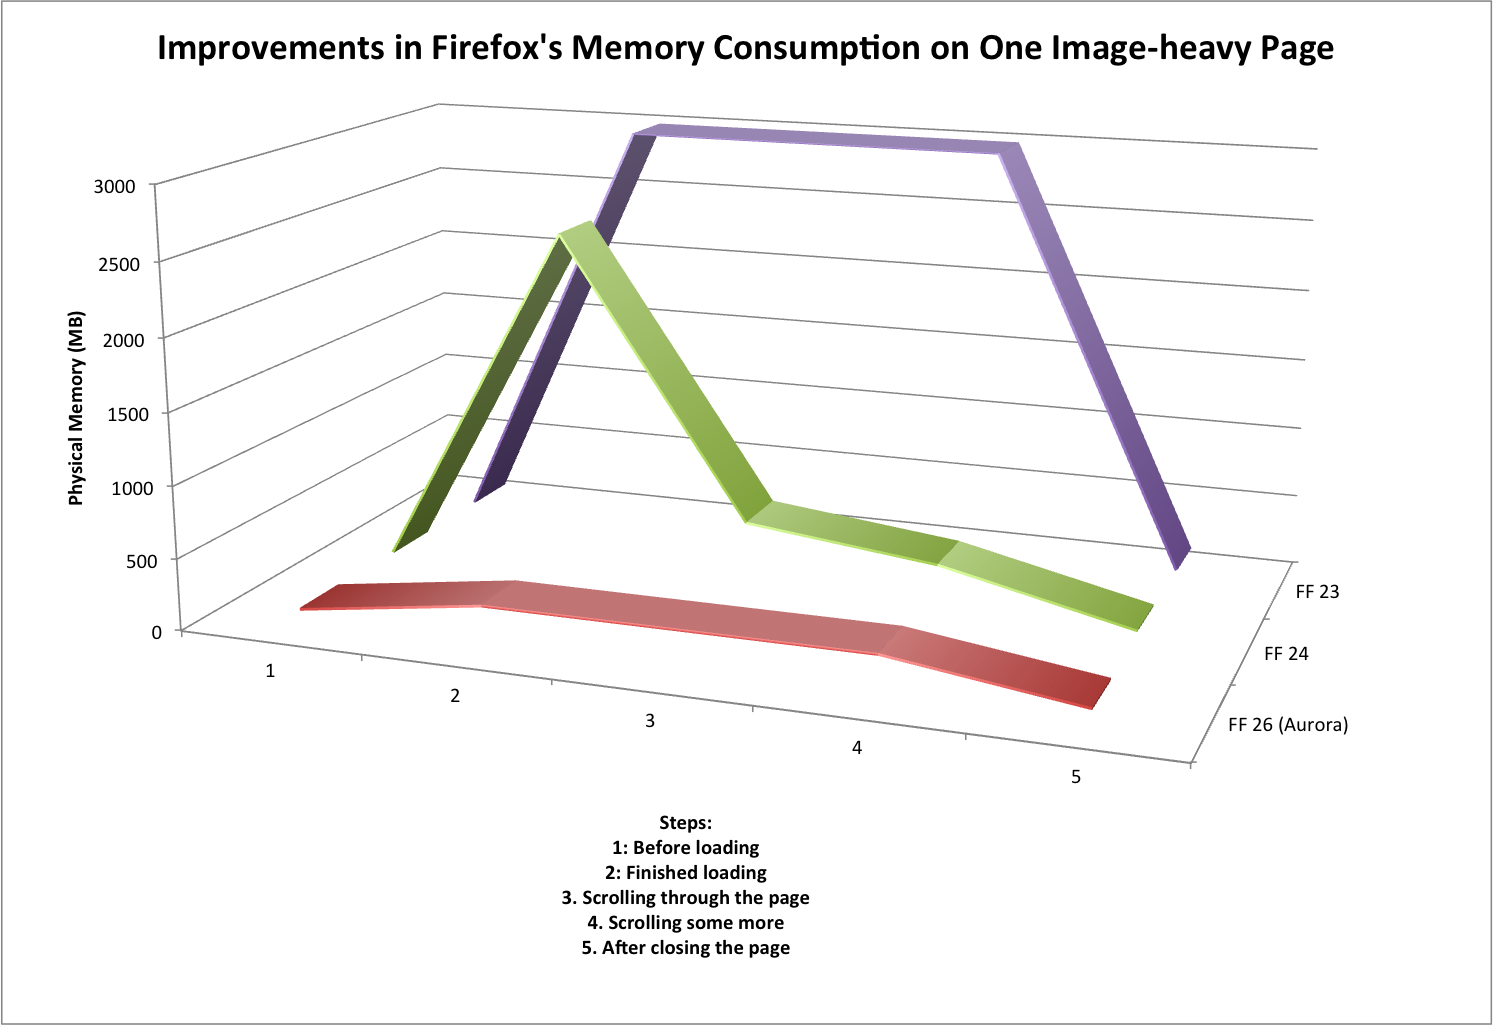
First consider Firefox 23, which had neither fix, and which is represented by the purple line in the graph. When loading the page, physical memory consumption would jump to about 3 GB, because every image in the page was decoded (a.k.a. decompressed). That decoded data was retained so long as the page was in the foreground.
Next, consider Firefox 24 (and 25), which had the first fix, and which is represented by the green line on the graph. When loading the page, physical memory consumption would still jump to almost 3 GB, because the images are still decoded. But it would soon drop down to a few hundred MB, as the decoded data for non-visible images was discarded, and stay there (with some minor variations) while scrolling around the page. So the scrolling behaviour was much improved, but the memory consumption spike still occurred, which could still cause paging, out-of-memory problems, and the like.
Finally consider Firefox 26 (currently in the Aurora channel), which has both fixes, and which is represented by the red line on the graph. When loading the page, physical memory jumps to a few hundred MB and stays there. Furthermore, the loading time for the page dropped from ~5 seconds to ~1 second, because the unnecessary decoding of most of the images is skipped.
These measurements were quite rough, and there was quite a bit of variation, but the magnitude of the improvement is obvious. And all these memory consumption improvements have occurred without hurting scrolling performance. This is fantastic work by Timothy, and great news for all Firefox users who visit image-heavy pages.
[Update: Timothy emailed me this: “Only minor thing is that we still need to turn it on for b2g. We flipped the pref for fennec on central (it’s not on aurora though). I’ve been delayed in testing b2g though, hopefully we can flip the pref on b2g soon. That’s the last major thing before declaring it totally solved.”]
[Update 2: This has hit Hacker News.]
NuWa
Cervantes Yu landed Nuwa, which is a low-level optimization of B2G. Quoting from the big ticket items list (where this was item #3):
Nuwa… aims to give B2G a pre-initialized template process from which every subsequent process will be forked… it greatly increases the ability for B2G processes to share unchanging data. In one test run, this increased the number of apps that could be run simultaneously from five to nine
Nuwa is currently disabled by default, so that Cervantes can fine-tune it, but I believe it’s intended to ship with B2G version 1.3. Fingers crossed it makes it!
Memory Reporting
I made some major simplifications to our memory reporting infrastructure, paving the way for future improvements.
First, we used to have two kinds of memory reporters: uni-reporters (which report a single measurement) and multi-reporters (which report multiple measurements). Multi-reporters, unsurprisingly, subsume uni-reporters, and so I got rid of uni-reporters, which simplified quite a bit of code.
Second, I removed about:compartments and folded its functionality into about:memory. I originally created about:compartments at the height of our zombie compartment problem. But ever since Kyle Huey made it more or less impossible for add-ons to cause zombie compartments, about:compartments has hardly been used. I was able to fold about:compartments’ data into about:memory, so there’s no functionality loss, and this change simplified quite a bit more code. If you visit about:compartments now you’ll get a message telling you to visit about:memory.
Third, I removed the smaps (size/rss/pss/swap) memory reporters. These were only present on Linux, they were of questionable utility, and they complicated about:memory significantly.
Finally, I fixed a leak in about:memory. Yeah, it was my fault. Sorry!
Summit
The Mozilla summit is coming up! In fact, I’m writing this report a day earlier than normal because I will be travelling to Toronto tomorrow. Please forgive any delayed responses to comments, because I will be travelling for almost 24 hours to get there.
29 replies on “MemShrink progress, week 117–120”
This is nothing short of utterly outstanding. Just when I was starting to lose a bit of faith in the ‘fox, this sort of superb news comes through. Congratulations to Timothy and yourself Nicholas. Both of you and all MemShrink contributors should be very proud.
How is memory use reported in versions of Firefox packaged and shipped by Linux Distros? Does your team currently analyze data from distros like Ubuntu?
We have the same telemetry data that we have on all platforms. It’s not very detailed, though, and we don’t consult it much.
Wow, looks great. I’ve been working on a web based photo-database loading a lot of images, which regularly crashed FF. Will test it on Aurora this weekend to see the effect!
I’d love to hear how it goes!
Great, but your browser is still a hungry, sluggish piece of garbage compared to the WebKit-based browsers. Where’s the overall fix for that?
Robin, do please feel free to post actual benchmark results supporting that claim. I don’t think it’s been defensible to say that Firefox is hungry and sluggish compared to the WebKit-based browsers for quite some time — thanks in no small measure to the work Nicholas and his colleagues have been doing.
FF has been pretty slim on memory use for some time now.
Please file specific bugs where FF is slower than Webkit based browsers.
I’m pretty sure people complaining about sluggishness refers to the UI responsiveness. That’s what the user see and that what’s they’ll complain about. Firefox is still mostly single threaded compare to IE or Chrome so heavy tab will still affect other function response such as tab switching etc.
Until the electrolysis lands, then yea, Firefox is still pretty sluggish compare to other browsers.
At the beginning of the year Brendan Eich did a blog post discussing a bunch of changes to display code that moved large chunks of it off the main thread that were done on mobile and which were expected to land in desktop builds in late spring/early summer. Does anyone know if these’ve made it as scheduled?
So is NuWa Applicable to Firefox Desktop?
No.
Can you please repost the graph as a 2D line plot?
I’ll second this request! 3D plots distort and do injustice to the data!
The progress is amazing. But the graph is an abomination! Pleeeeease avoid the use of unnecessary 3D effects. It adds nothing and makes it horrible to read and decipher.
+1. Was going to say the same thing and point to tufte.
Two items off the 2013 big ticket list already; and while it’s apparently still not tied into the UI GGC is working in the core JS engine, and as reported on AWFY now matches the old JS engine in all the benchmark aggregates. Hopefully this means it will be released soon for a 3rd item finished. I wonder what will be replacing them in the 2014 list.
I’m sorry, but FireFox 23.0.1 takes for me about 673MB of RAM with only 3 Tabs opend: Yahoo mail, Facebook and dict leo.
http://i40.tinypic.com/icnw9j.jpg
In the 90th we hat computers with only 128MB RAM and were able to run the system and browse the web. Today we need about 700MB of RAM just to open the google startpage. I’m sorry, but something seems to go terribly wrong in the programming scene!
Seems no one is able to code efficiency today, because each programmer has a Core i7 with >8GB RAM and several SSDs and only cares about the function, not the efficiency.
I remember those days. You seem to have a rosy view of the past. Yesterday’s web used to be simple HTML markup and images, very little to no javascript or CSS and barely any graphical capability.
These days webpages can be HTML/CSS/JS/IMAGES/PLUGIN and do a ton of tasks dynamically and graphically. The Google frontpage for example is deceptively simple looking but holds a ton of JavaScript to execute. That goes double for Yahoo Mail and Facebook anything.
Updated firefox to 24. Went to the test page. 1.3 gig of ram used. Closed this tab and hacker news. Still 1.3 gig used. Scrolled down. Garbage collect or something triggered. 600 megs used. Scrolled more. ~350 megs used. Scrolled to the top. Still around 350 megs. Pressed F5. Mem usage goes to 1.5, then 2.2 then 2.8 gigs. This brought my 4 gig machine to a screeching halt. Had to kill with taskmanager.
Doesn’t work for me
Only one of the fixes outlined in the article was included in FF 24.
Your results match the expected results for FF24 exactly — just like the green line in the graph you get a big peak on loading and then it drops off shortly afterwards. You’ll need to update to the Aurora channel (aurora.mozilla.org) to see the full improvements.
Just tested it under Nightly, unbelievable! Nicholas, you deserve a medal! 🙂
Have you considered hardware accelerated jpeg decoding? Also, there are efficient techniques to resize big jpg images before decoding the jpeg data.
How does this affect preloaders, and animation speed? Many pages preload the images they want to use so they are ready for good animation speed.
So, not decoding images that aren’t visible saves on memory but makes scrolling the webpage a lot more annoying (because you have to wait for the images to decode). Maybe it would be better to only use this specific optimizations when there is not much memory, so that on my desktop machine I don’t have to have a sucky scrolling experience.
I kindly disagree. It’s all about personally perceived sluggishness and what you find intolerable. That’s the only explanation I have for why everyone picks a pet browser as “not sluggish” and complains about the others, while I find sluggishness in every nook and cranny of every browser I try.
It’s also the case that certain OS and hardware configurations are simply better-optimized by certain browsers in some cases – I’ve seen machines that can’t run Chrome well at all where Firefox runs like a champ, and vice versa.
I’ve also slowly become convinced that a lot of people who claim that Firefox is still generally sluggish haven’t even tried it since 2008. I’ll certainly give them the benefit of the doubt, of course, but I’ve challenged several people to try Firefox (or Chrome) when it was clear they were just talking out of their rears, only to see them realize the two aren’t all that different anymore.
Will emphatically be looking at Memshrink’s Firefox improvements. I’m having huge memory leakage problems. Description:
I’m running FF 24.0 and still have the huge memory leak problem. FF memory use consistently climbs to over 1 GB.
I posted on the Mozillazine forum and was told that 500 MB memory use was route and to be expected. That is just crazy. A few releases ago, FF seldom went over 250 MB – which is a lot of memory.
Am considering switching to a “tiny browser” application instead of FF. While FF is wonderful (the plugins!), I work in my browser many hours some days for WordPress site building and maintenance. Big-time browser slow-downs interfere waaaay too much with my work.
Is Mozilla taking this seriously? With memory leaks like this, Firefox is taking itself completely out of the browser-speed competition with Chrome, IE, and Opera.
Have you tried doing a Reset? (google: Firefox Reset)
Sometimes older profiles can develop issues that can lead to poor memory usage.
Sometimes addons can be the problem. Even not-new addons can become problematic if their code has not been properly updated to interact with changes in Firefox.
But remember, the more tabs you have open and addons installed the more memory will consumed.
But FF is still very slow loading pictures from cache! If one reloads that page: http://www.patrickmueller.li/epaper_ml1110_2/Blaettern_V11_39.html with Chrome it takes less then 2 seconds, FF takes over 10 seconds!
But else keep on with your great work!