Categories
about:compartments about:memory Firefox Memory consumption MemShrink

MemShrink progress, week 117–120

Lots of important MemShrink stuff has happened in the last 27 days:  22 bugs were fixed, and some of them were very important indeed.

Images

Timothy Nikkel fixed bug 847223, which greatly reduces peak memory consumption when loading image-heavy pages.  The combination of this fix and the fix from bug 689623 — which Timothy finished earlier this year and which shipped in Firefox 24 — have completely solved our longstanding memory consumption problems with image-heavy pages!  This was the #1 item on the MemShrink big ticket items list.

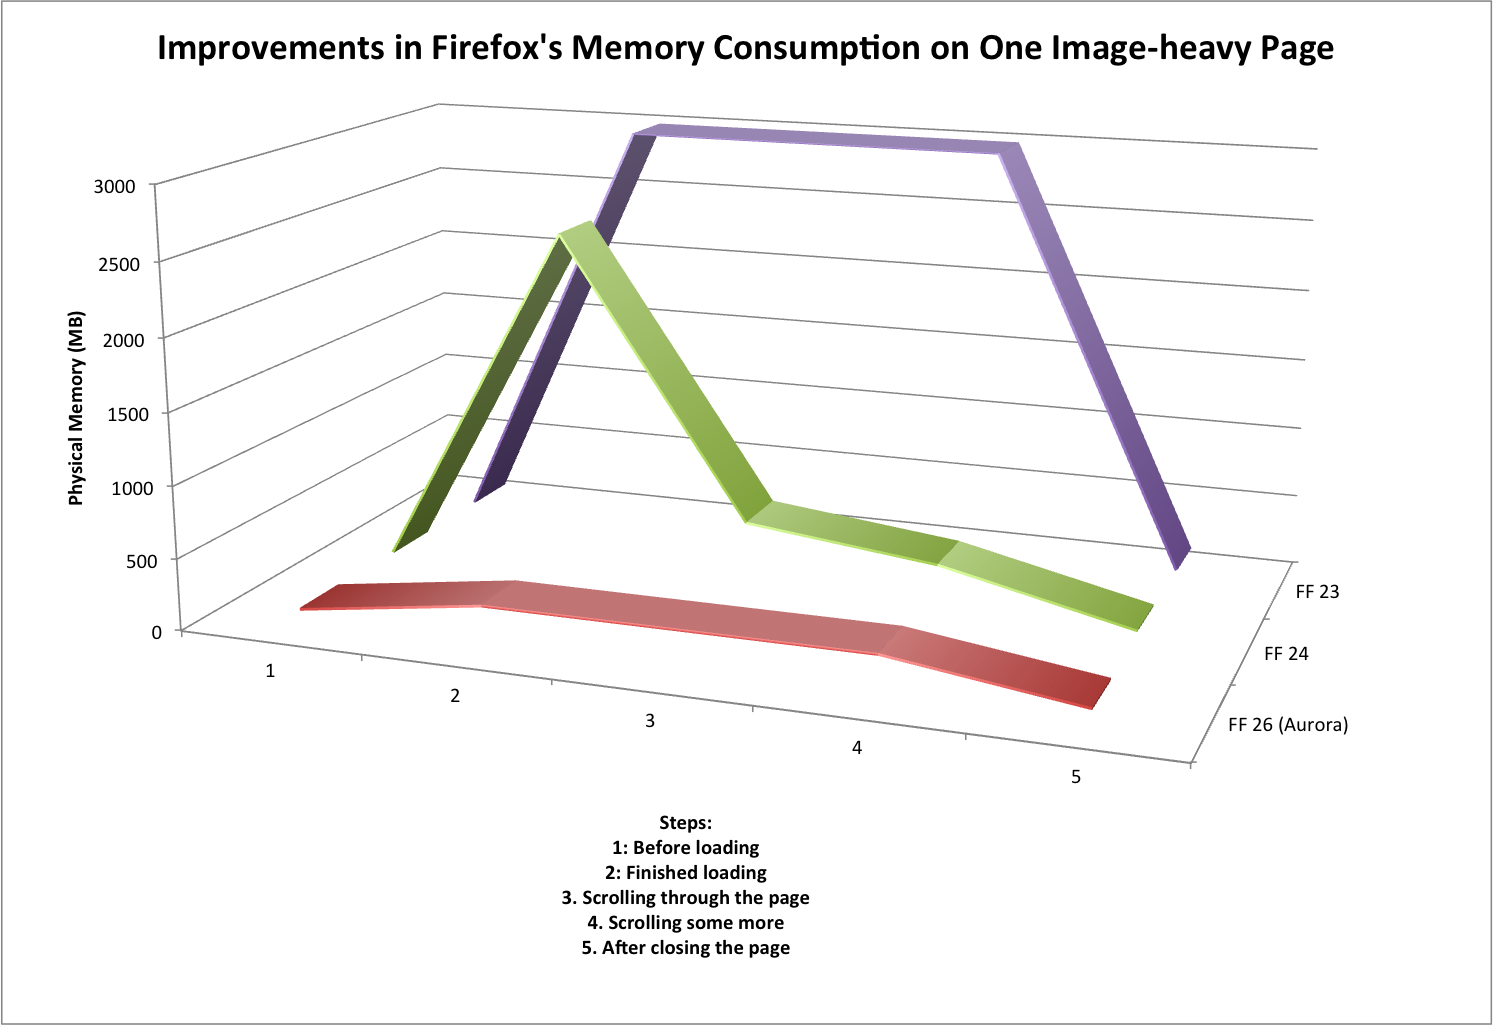
To give you an idea of the effect of these two fixes, I did some rough measurements on a page containing thousands of images, which are summarized in the graph below.

Improvements in Firefox's Memory Consumption on One Image-heavy Page

First consider Firefox 23, which had neither fix, and which is represented by the purple line in the graph.  When loading the page, physical memory consumption would jump to about 3 GB, because every image in the page was decoded (a.k.a. decompressed).  That decoded data was retained so long as the page was in the foreground.

Next, consider Firefox 24 (and 25), which had the first fix, and which is represented by the green line on the graph.  When loading the page, physical memory consumption would still jump to almost 3 GB, because the images are still decoded.  But it would soon drop down to a few hundred MB, as the decoded data for non-visible images was discarded, and stay there (with some minor variations) while scrolling around the page. So the scrolling behaviour was much improved, but the memory consumption spike still occurred, which could still cause paging, out-of-memory problems, and the like.

Finally consider Firefox 26 (currently in the Aurora channel), which has both fixes, and which is represented by the red line on the graph.  When loading the page, physical memory jumps to a few hundred MB and stays there.  Furthermore, the loading time for the page dropped from ~5 seconds to ~1 second, because the unnecessary decoding of most of the images is skipped.

These measurements were quite rough, and there was quite a bit of variation, but the magnitude of the improvement is obvious.  And all these memory consumption improvements have occurred without hurting scrolling performance.  This is fantastic work by Timothy, and great news for all Firefox users who visit image-heavy pages.

[Update: Timothy emailed me this:  “Only minor thing is that we still need to turn it on for b2g. We flipped the pref for fennec on central (it’s not on aurora though). I’ve been delayed in testing b2g though, hopefully we can flip the pref on b2g soon. That’s the last major thing before declaring it totally solved.”]

[Update 2: This has hit Hacker News.]

NuWa

Cervantes Yu landed Nuwa, which is a low-level optimization of B2G.  Quoting from the big ticket items list (where this was item #3):

Nuwa… aims to give B2G a pre-initialized template process from which every subsequent process will be forked… it greatly increases the ability for B2G processes to share unchanging data.  In one test run, this increased the number of apps that could be run simultaneously from five to nine

Nuwa is currently disabled by default, so that Cervantes can fine-tune it, but I believe it’s intended to ship with B2G version 1.3.  Fingers crossed it makes it!

Memory Reporting

I made some major simplifications to our memory reporting infrastructure, paving the way for future improvements.

First, we used to have two kinds of memory reporters:  uni-reporters (which report a single measurement) and multi-reporters (which report multiple measurements).  Multi-reporters, unsurprisingly, subsume uni-reporters, and so I got rid of uni-reporters, which simplified quite a bit of code.

Second, I removed about:compartments and folded its functionality into about:memory.  I originally created about:compartments at the height of our zombie compartment problem.  But ever since Kyle Huey made it more or less impossible for add-ons to cause zombie compartments, about:compartments has hardly been used.   I was able to fold about:compartments’ data into about:memory, so there’s no functionality loss, and this change simplified quite a bit more code.  If you visit about:compartments now you’ll get a message telling you to visit about:memory.

Third, I removed the smaps (size/rss/pss/swap) memory reporters.  These were only present on Linux, they were of questionable utility, and they complicated about:memory significantly.

Finally, I fixed a leak in about:memory.  Yeah, it was my fault.  Sorry!

Summit

The Mozilla summit is coming up!  In fact, I’m writing this report a day earlier than normal because I will be travelling to Toronto tomorrow.  Please forgive any delayed responses to comments, because I will be travelling for almost 24 hours to get there.
Categories
about:compartments about:memory add-ons Firefox Garbage Collection Memory consumption MemShrink Performance

MemShrink progress, week 51-52

Memory Reporting

Nathan Froyd added much more detail to the DOM and layout memory reporters, as the following example shows.

├──3,268,944 B (03.76%) -- window(http://www.reddit.com/)
│  ├──1,419,280 B (01.63%) -- layout
│  │  ├────403,904 B (00.46%) ── style-sets
│  │  ├────285,856 B (00.33%) -- frames
│  │  │    ├───90,000 B (00.10%) ── nsInlineFrame
│  │  │    ├───72,656 B (00.08%) ── nsBlockFrame
│  │  │    ├───62,496 B (00.07%) ── nsTextFrame
│  │  │    ├───42,672 B (00.05%) ── nsHTMLScrollFrame
│  │  │    └───18,032 B (00.02%) ── sundries
│  │  ├────259,392 B (00.30%) ── pres-shell
│  │  ├────168,480 B (00.19%) ── style-contexts
│  │  ├────160,176 B (00.18%) ── pres-contexts
│  │  ├─────55,424 B (00.06%) ── text-runs
│  │  ├─────45,792 B (00.05%) ── rule-nodes
│  │  └─────40,256 B (00.05%) ── line-boxes
│  ├────986,240 B (01.13%) -- dom
│  │    ├──780,056 B (00.90%) ── element-nodes
│  │    ├──156,184 B (00.18%) ── text-nodes
│  │    ├───39,936 B (00.05%) ── other [2]
│  │    └───10,064 B (00.01%) ── comment-nodes
│  └────863,424 B (00.99%) ── style-sheets

Although these changes slightly improved the coverage of the reporters (i.e. they reduce “heap-unclassified” a bit), the more important effect is that they give greater insight into DOM and layout memory consumption.  [Update:  Nathan blogged about these changes.]

I modified the memory reporter infrastructure and about:memory to allow trees of measurements to be shown in the “Other Measurements” section of about:memory.  The following excerpt shows two sets of measurements that were previously shown in a flat list.

108 (100.0%) -- js-compartments
├──102 (94.44%) ── system
└────6 (05.56%) ── user

3,900,832 B (100.0%) -- window-objects
├──2,047,712 B (52.49%) -- layout
│  ├──1,436,464 B (36.82%) ── style-sets
│  ├────402,056 B (10.31%) ── pres-shell
│  ├────100,440 B (02.57%) ── rule-nodes
│  ├─────62,400 B (01.60%) ── style-contexts
│  ├─────30,464 B (00.78%) ── pres-contexts
│  ├─────10,400 B (00.27%) ── frames
│  ├──────2,816 B (00.07%) ── line-boxes
│  └──────2,672 B (00.07%) ── text-runs
├──1,399,904 B (35.89%) ── style-sheets
└────453,216 B (11.62%) -- dom
     ├──319,648 B (08.19%) ── element-nodes
     ├──123,088 B (03.16%) ── other
     ├────8,880 B (00.23%) ── text-nodes
     ├────1,600 B (00.04%) ── comment-nodes
     └────────0 B (00.00%) ── cdata-nodes

This change improves the presentation of measurements that cross-cut those in the “explicit” tree.  I intend to modify a number of the JS engine memory reports to take advantage of this change.

One interesting bug was this one, where various people were seeing multiple compartments for the same site in about:compartments, as the following excerpt shows.

https://bugzilla.mozilla.org/
https://bugzilla.mozilla.org/, about:blank

It turns out this is not a bug.  The sites in question contain an empty iframe that doesn’t specify a URL, and so the memory reporters are doing exactly the right thing.  Still, a useful case to know about when reading about:compartments.

Add-ons

Justin Lebar fixed the FUEL API, which is used by numerous add-ons including Test Pilot and PDF.js, so that it doesn’t leak most of the objects it creates.  This leak caused 10+ minute shut-down times(!) for one user, so it’s a good one to have fixed.

Kyle Huey briefly broke his own Hueyfix, and then fixed it.  You had us worried for a bit there, Kyle!

asgerklasker fixed a leak in the HttpFox add-on that caused zombie compartments.

Miscellaneous

I restricted the amount of context that is shown in JavaScript error messages.  This fixed a longstanding bug where if you had enabled the javascript.options.strict option in about:config, and you had the error console open or Firebug installed, memory consumption would spike dramatically when viewing pages that contain JavaScript code that triggered many strict warnings.  This bug manifested rarely, but would bring Firefox to its knees when it did.

Asaf Romano fixed a leak that caused a zombie compartment if you used the “Highlight All” checkbox when doing a text search in a page.

Mike Hommey finished importing the new version of jemalloc into the Mozilla codebase, and then wrote about it.  The new version is currently disabled, but we hope to turn it on soon.  Preliminary experiments indicate that the new version is unlikely to affect performance or memory consumption much.  However, it will be good to be on a version that is in sync with the upstream version, instead of having a highly hacked Mozilla-specific version.

Justin Lebar wrote a nice blog post explaining what “ghost windows” are, and how we’ve used them to gauge some recent leak fixes.

Till Schneidereit fixed a garbage collection defect that could cause memory usage to spike in certain cases involving Firefox Sync.

LifeHacker published a new browser performance comparison which looked at Firefox 13, Chrome 19, IE9, and Opera 11.64.  Firefox did the best overall and also won both the memory consumption tests.  I personally take these kinds of comparisons with a huge bucket of salt.  Indeed, quoting from the article:

Our tests aren’t the most scientific on the planet, but they do reflect a relatively accurate view of the kind of experience you’d get from each browser, speed-wise.

If you ask me, the text before the “but” contradicts the rest of the sentence.  What I found more interesting was the distinct lack of “lolwut everyone knows Chrome is faster than Firefox” comments, which I’m used to seeing when Firefox does well in these kinds of articles.

Bug Counts

Here are the current bug counts.

  • P1: 25 (-1/+3)
  • P2: 88 (-3/+6)
  • P3: 106 (-0/+4)
  • Unprioritized: 2 (-2/+2)

Nothing too exciting there.

Categories
about:compartments about:memory AdBlock Plus add-ons compartments Firefox Memory consumption MemShrink

MemShrink progress, week 49-50

System Compartment Reporting

With the recent landing of compartment-per-global, Firefox now regularly has 200+ system compartments at start-up.  However, most of these compartments didn’t have names, which meant that they were merged into a single “[System Principal]” entry in about:memory and about:compartments.

Until last week, that is, when Nils Maier added identifying information to the vast majority of these.  Here’s a small selection of interesting ones from about:compartments on my own machine.

about:blank
about:compartments
about:memory?verbose

chrome://adblockplus-modules/content/FilterClasses.jsm

chrome://browser/content/bookmarks/bookmarksPanel.xul
chrome://browser/content/browser.xul
chrome://browser/content/places/menu.xml
chrome://browser/content/search/search.xml

chrome://chatzilla/content/browserOverlay.xul

chrome://global/content/bindings/button.xml
chrome://global/content/globalOverlay.xul

chrome://treestyletab/content/treestyletab.xul

file:///home/njn/moz/mi0/o64/dist/bin/components/TelemetryPing.js

jar:file:///home/njn/moz/mi0/o64/dist/bin/extensions/uriloader@pdf.js.xpi!/bootstrap.js
jar:file:///home/njn/moz/mi0/o64/dist/bin/extensions/uriloader@pdf.js.xpi!/components/PdfStreamConverter.js

resource:///modules/TelemetryTimestamps.jsm
resource:///modules/sessionstore/DocumentUtils.jsm

resource://gre-resources/hiddenWindow.html

resource://gre/modules/AddonManager.jsm

resource://services-common/preferences.js
resource://services-crypto/WeaveCrypto.js
resource://services-sync/constants.js
resource://services-sync/engines/bookmarks.js

resource://treestyletab-modules/browser.js
resource://treestyletab-modules/lib/animationManager.js

Just from this, it’s obvious that I had about:compartments and about:memory?verbose open at the time.  It’s also obvious that I had the following add-ons installed:  AdBlock Plus, Chatzilla, Tree Style Tab, and pdf.js.  And about:memory now gives at least a partial measurement of how much memory these add-ons are using.  This will help identify add-ons that are using excessive amounts of memory.  (Having said that, I identified the add-on compartments simply by their names.  It’d be great if there was a way to systematically identify them within the code, but I don’t know if that’s possible.)

I also hope people will scrutinize Firefox’s own compartment use closely, and start to file bug reports saying things like “hey, that .jsm module shouldn’t be present, there must be a leak”.  If you want to see what the full list of 200+ looks like, try out a recent Nightly build!

In related news, I also added some new compartment-specific reports, including ones for cross-compartment wrappers.

One consequence of all these change is that the number of entries in about:memory jumped tremendously.  As a result, I aggregated the small entries within each compartment, which reduces the number of entries by a factor of roughly four while still reporting full information for large compartments.  Nils and I also made about:memory more efficient, so the amount of memory required to generate each line dropped by about 20%.  about:memory still takes up memory itself, but it does so at a level that I’m fairly happy with.

Add-ons

For a change, the biggest MemShrink-related news in this report wasn’t related to add-ons!  But there was still some interesting movement there.

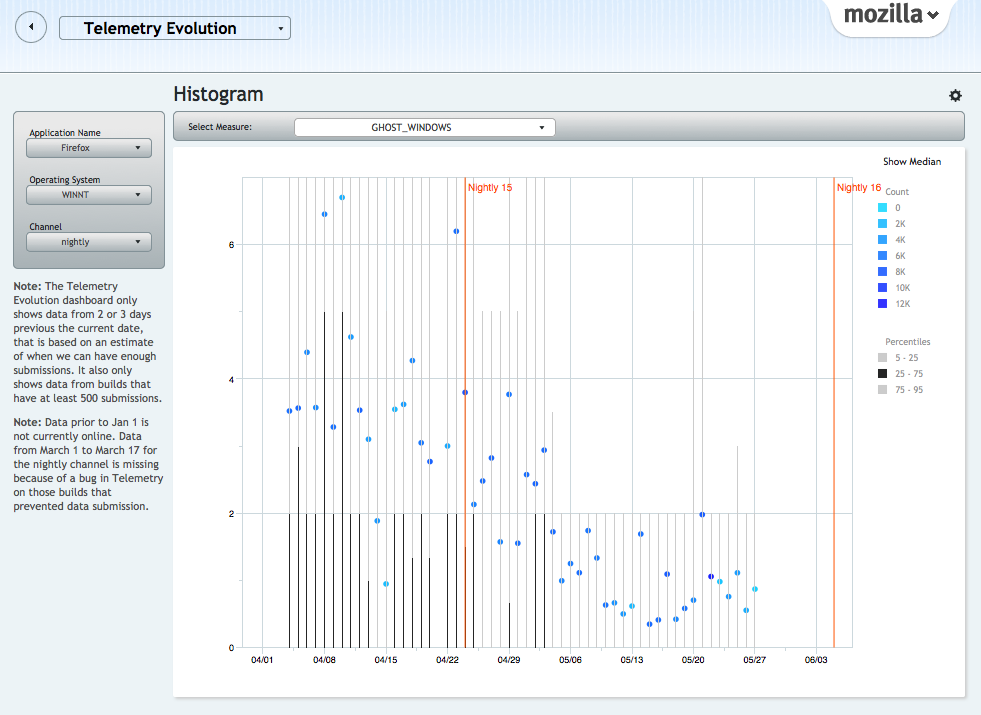
Justin Lebar uncovered some evidence that the Hueyfix is having a real, positive effect among users.  Telemetry data from Nightly users shows that the number of ghost windows — a concept for which we don’t have good documentation, but they correlate with zombie compartments — has dropped dramatically, as the following graph shows.

ghost windows telemetry data graph

Telemetry data tends to be extremely noisy, so it’s nice to see a clear signal — Kyle’s change made it into Nightly builds on May 5th [Update: that’s incorrect, see below] and immediately caused the mean number of ghost windows to drop from roughly three to roughly one.  The variance also dropped dramatically.

Update: Justin just wrote a blog post that explains very nicely what ghost windows are.  That post also explains better the circumstances behind the drop in ghost window numbers;  my explanation above was too simple and got the timing wrong.  Thanks, Justin!

In other add-on news, the following add-ons had leaks fixed: Readability, ProxTube, Youtube MP3 Podcaster.

Firefox vs The New York Times

Robert O’Callahan fixed a leak relating to mouse events that triggered when he visited nytimes.com.  He wrote a great blog post explaining the heroic debugging — searching through full memory dumps! — that was required.  It’s great that Robert found and fixed this, though it’s a shame it took such expertise.

Bug Counts

Here are the current bug counts.

  • P1: 23 (-1/+2)
  • P2: 85 (-2/+4)
  • P3: 102 (-5/+2)
  • Unprioritized: 2 (-3/+2)

Not a great deal of movement.  We only had to triage twelve bugs in today’s MemShrink meeting, which is the fewest we’ve had since we switched to fortnightly meetings.

Categories
about:compartments about:memory add-ons compartments Firefox Memory consumption MemShrink

MemShrink progress, week 42

 Are we slim yet?

John’s Schoenick’s areweslimyet.com (AWSY) has had its password removed and is now open to the public!

areweslimyet.com screenshot

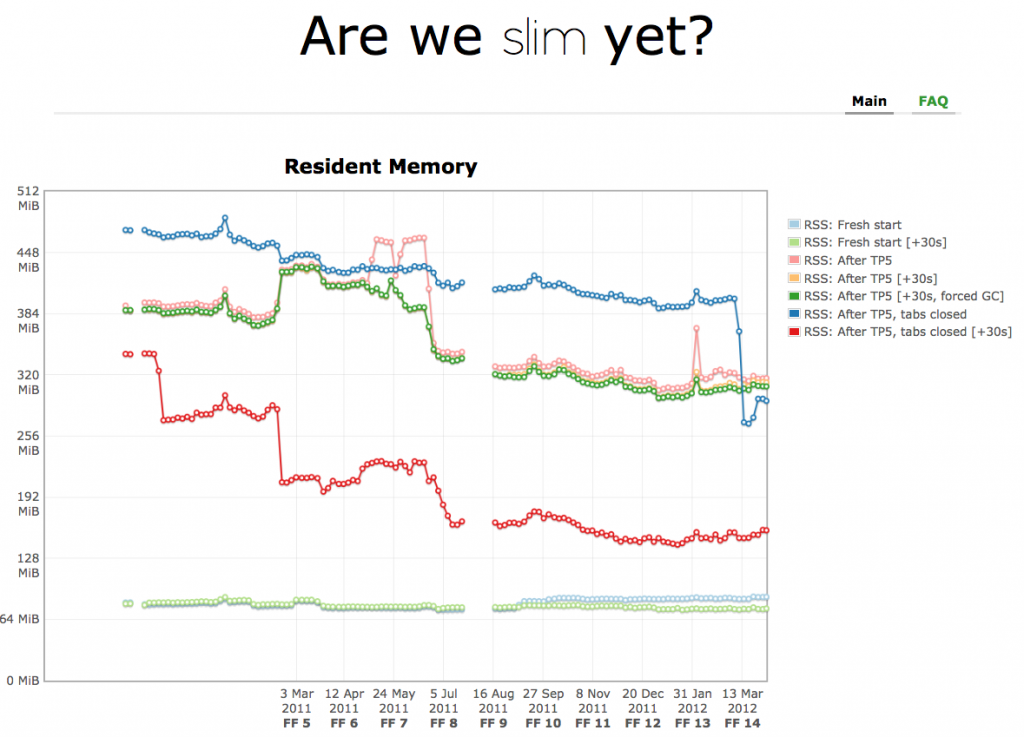
This is a major milestone for the MemShrink project.  It shows the progress we have made (MemShrink started in earnest in June 2011) and will let us identify regressions more easily.

John’s done a wonderful job implementing the site.  It has lots of functionality:  there are multiple graphs, you can zoom in on parts of graphs to see more detail, and you can see revisions, dates and about:memory snapshots for individual runs.

John has also put in a great deal of work refining the methodology to the point where we believe it provides a reasonable facsimile of real-world browsing;  please read the FAQ to understand exactly what is being measured.  Many thanks also to Dave Hunt and the QA team for their work on the Mozmill Endurance Tests, which are at the core of AWSY’s testing.

Update: Hacker News has reported on this.

Ghost windows

Frequent readers of this blog will be familiar with zombie compartments, which are JavaScript compartments that have leaked, due to defects in Firefox or add-ons.  Windows (i.e. window objects) can also be leaked, and often defects that cause compartments leaks will cause window leaks as well.

Justin Lebar has introduced the notion of “ghost windows”.  A ghost window is one that meets the following criteria.

  1. Shows up in about:memory under “window-objects/top(none)”.
  2. Does not share a domain name with any window under “window-objects/active.
  3. Has met criteria (1) and (2) for a moderate amount of time (e.g. two minutes).

The basic idea is that a ghost window has a high chance of representing a genuine leak, and this automated identification of suspicious windows will make leak detection simpler.  Justin has added ghost window tracking to about:memory, about:compartments, and telemetry.  (These three bugs were all marked as MemShrink:P1.)  Ghost window tracking is mostly untested right now, but hopefully it will become another powerful tool for finding memory leaks.

Add-ons

We’ve been tracking leaky add-ons in Bugzilla for a while now, but we’ve never had a good product/component to put them in.  David Lawrence, Byron Jones, Stormy Peters and I have together created a new “Add-ons” component under the “Tech Evangelism” product.  The rationale for putting it under “Tech Evangelism” is that it nicely matches the existing meaning of that phrase — it’s a case where a non-Mozilla entity is writing defective code that interacts with Firefox and hurts users’ experiences with and perceptions of Firefox, and Mozilla can only inform, educate and encourage fixes in that defective code.  This component is only intended for certain classes of common defects (such as leaks) that Mozilla contributors are tracking.  It is not intended for vanilla add-on bugs;  as now, they should be reported through whatever bug-reporting mechanism each add-on uses.  I’ve updated the existing open bugs that track leaky add-ons to use this new component.

Leaks in the following add-ons were fixed:  Video DownloadHelper (the 2nd most popular add-on on AMO!), Scrapbook Plus, Amazon Price Tracker.

Bug counts

This week’s bug counts:

  • P1: 21 (-5/+0)
  • P2: 137 (-1/+7)
  • P3: 90 (-1/+3)
  • Unprioritized: 1 (-1/+1)

Good progress on the P1 bugs!

A new reporting schedule

Many of the weekly MemShrink reports lately have been brief.  From now on I plan to write a report every two weeks.  This will make things easier for me and will also ensure each report is packed full of interesting things.  See you again in two weeks!

Categories
about:compartments about:memory add-ons compartments Firefox Memory consumption MemShrink

MemShrink progress, week 36

Lots of activity this week.

Leaky add-ons

I created a new devmo wiki page documenting common causes of memory leaks in add-ons.  I based this on a lovely selection of examples provided by Nils Maier.  Unfortunately, I know almost nothing about writing add-ons and so I’m not happy with the current state of the documentation.  I’ve taken it as far as I can, but it very likely has errors, leaves out important cases, conflates distinct concepts, and generally is not as good as it should be.  This documentation is really important — we have good tools for identifying when add-on leaks occur but we don’t yet have good tools for identifying their causes.  Until we have those tools, documentation is the only way we can help add-on authors fix leaks.  If someone who knows more about add-ons is willing to help please contact me!

Alexandre Poirot fixed a leak in the Add-on SDK that was causing zombie compartments when certain add-ons were disabled.  This also fixed bug 725603 and probably fixes some zombie compartments reported in some other add-ons (e.g. MemChaser).

Jan fixed several leaks in the Galaxytoolbar add-on.  The new version is 2.6.12.

A small number of add-ons have been found that disable Firefox’s XUL cache.  This is a recipe for disastrous performance, and so Matt Basta updated the AMO add-on validator to detect this.

Tools

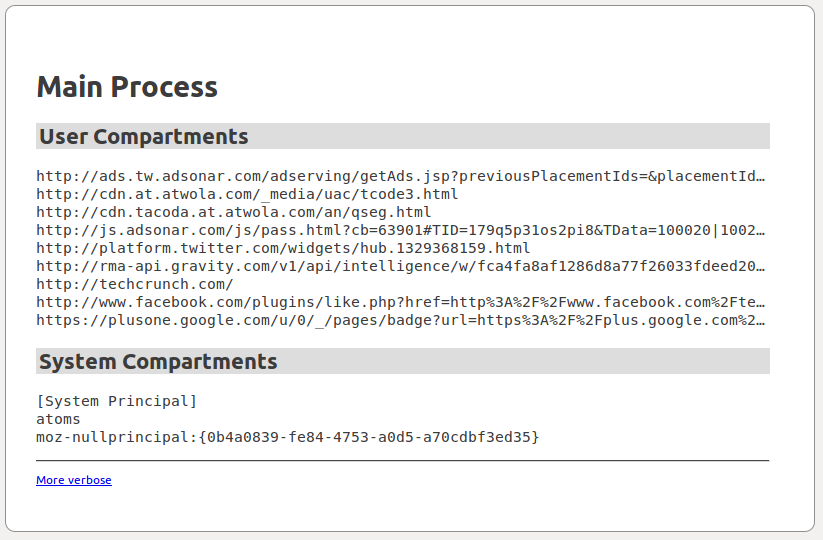
I landed support for a new page called about:compartments. The exposure of zombie compartments in about:memory has become an extremely powerful leak detection tool.  But using about:memory to find zombies is non-trivial — there are multiple steps and ways to get it wrong.  The motivation for about:compartments is to make the detection of zombie compartments as simple as possible.  Here’s a screenshot:

about:compartments screenshot

Some things to note:

  • It only shows compartments, and all of them.
  • User compartments from web content (usually the interesting ones) are listed separately from system compartments.
  • The garbage and cycle collectors are automatically run when the page is loaded, ensuring that dead compartments aren’t listed.
  • The “More verbose” link at the bottom just causes the truncated URLs to be shown in full.
  • about:compartments shares a lot of code with about:memory.
  • I updated the documentation on zombie compartments accordingly.

Olli Pettay created about:cc, an add-on that can detect various kinds of document leaks relating to cycle collection.  Olli has already found several leaks with this tool.  Jan Honza Odvarko has written about:ccdump, a similar but prettier add-on.  I’m not certain but I think Olli and Jan are now co-ordinating their efforts.

I mentioned Mozilla QA’s MemChaser add-on a few weeks ago.  It lets you track memory usage and GC/CC activity easily via the add-on bar, and also allows logging of memory-related activities.  It’s now available on AMO, which guarantees you’ll receive updates as they’re released.

Jesse Ruderman tweaked his DOM fuzzer and found several new small leaks relating to nsITimers.  Jesse also modified about:memory so that it produces assertions that his fuzzer will catch.  This means that his fuzzer will detect if any memory reporters produce bogus values.

Miscellaneous

Kyle Huey fixed a zombie compartment that occurred when searching within pages with onclick handlers, which is a pretty common operation.

Jeff Muizelaar fixed a huge Mac-only leak relating to text rendering.  This was a recent regression that isn’t present in any released version of Firefox.

Josh Aas fixed a bug in cookie clearing — prior to Josh’s fix, if you cleared all cookies, Firefox would launch an instance of the plugin-container process for every plug-in installed, which could cause freezes and memory spikes.

Andrew Quartey updated the WebGL memory reporters to the new style.

Bug counts

This week’s bug counts:

  • P1: 28 (-1/+3)
  • P2: 134 (-6/+9)
  • P3: 79 (-8/+11)
  • Unprioritized: 2 (-1/+2)

Lots of movement there:  plenty of bugs fixed, but even more new ones.  Roughly 20 of the new ones fell into the following three categories.

  • Zombie compartments found in AMO add-ons by Kris Maglione and Andreas Wagner.
  • Leaks found by Olli Pettay’s new about:cc tool, mentioned above.
  • Leaks found by Jesse Ruderman’s tweaked DOM fuzzer, mentioned above.

This is a good thing!  It shows that new policies and tools are exposing existing problems.  I expect this higher level of new bug filing will continue for a couple of weeks.