A year ago today, the first meeting of the MemShrink project took place. The project had been announced almost three months earlier, but until that first meeting it was basically just me working on it and there wasn’t much momentum. So I now think of those three months as something of a gestation period, and the first meeting as the true birth of the project.
So, happy birthday, MemShrink! I’ll take this opportunity to go over some of the accomplishments we’ve made in the past year.
Big Win #1: Better Javascript Heap Management
There have been two huge MemShrink improvements that stand out in my mind. The first one happened very early on, and it consisted of two related changes, both implemented by Gregor Wagner.
In Firefox 4, the implementation of the JavaScript heap was totally overhauled. In particular, it was segregated into compartments, each of which held (roughly speaking) the memory for a single domain. System compartments, i.e. those for JavaScript code that implements parts of Firefox (such as the UI), tend to be long-lived. In contrast, user compartments, i.e. those for JavaScript code in web pages, tend to be short-lived. But memory from both system and user compartments was being co-located in 1MB chunks. What tended to happen is that if you browsed for a long time and then closed many tabs, you’d end up with lots of 1MB chunks that were kept alive by a small amount of memory from system compartments. This is a form of fragmentation, and it prevented Firefox from releasing lots of memory back to the operating system that it should have been able to.
Fortunately, Gregor came up with a simple fix: don’t allow system and user compartments to share the same 1MB chunks. To see just how effective this was, consider this visualization of the JavaScript heap after closing many tabs, without Gregor’s change.
Each horizontal line is a 1MB chunk, and each square is a 4KB arena. White squares are unused arenas, and coloured squares are in use. Arenas belong to a particular compartment all have the same colour; there are three compartments alive, all of which are system compartments. You can see that many 1MB chunks are kept alive by a small number of arenas.
After Gregor’s change, in this scenario the heap ended up looking like this.
Much better.
Gregor’s second change related to garbage collection scheduling. In Firefox 4 the garbage collection heuristics were poorly tuned, and the garbage collector simply didn’t run frequently enough. Many people who left Firefox open for a while came back to find that JavaScript memory consumption had ballooned, and the machine was unusable due to paging, for seconds or minutes, until the garbage collector kicked in and paging finished. The fix was simple: run the garbage collector occasionally, using a timer.
These two fixes of Gregor were the main reason why the first item in the Firefox 7 release notes was “drastically improved memory handling for certain use cases”. More specifically, Firefox 7 used less memory than Firefox 6 (and 5 and 4): often 20% to 30% less, and sometimes as much as 50% less.
Big Win #2: Fewer add-on Leaks
The second huge MemShrink improvement is much more recent. In fact it hasn’t even made it into a released version of Firefox yet. And the path towards it was much more circuitous.
I first revamped about:memory in May of last year, and those changes made it into Firefox 6. This started giving us insight into Firefox’s memory consumption, but it wasn’t until I broke up the reporting of JS memory consumption on a per-compartment basis that it really started to make a difference. (This change made it into Firefox 7, another reason why that release was so good from a memory consumption point of view.)
Per-compartment reporters made some blatant inefficiencies obvious, which were quickly fixed. More importantly, people quickly noticed that sometimes compartments were present for sites that had been closed long ago. This is a kind of memory leak that became known as a zombie compartment, and hunting them became a popular enough sport that more than 100 zombie compartment bug reports have been filed.
Some of the zombie compartments were due to defects in Firefox itself, and these were generally fixed fairly quickly. However, it soon became clear that the majority of them are due to add-ons. It’s quite easy to unintentionally create zombie compartments in add-ons. In the worst case, add-ons could leak the compartment of every single site visited.
This led to some lively discussion about how best to handle these leaks, because they are defects in third-party code that is largely out of Mozilla’s control, and yet they make Firefox look bad. Fortunately, this discussion became mostly moot when Kyle Huey took advantage of an 8,000 mile trip from home to implement a crazy idea he’d had six months earlier — when a tab is closed, simply cut the references from other compartments that would keep the compartment of the tab’s page alive. This turns out to work tremendously well and prevents most of the cases where add-ons can create zombie compartments. This change is scheduled to ship in Firefox 15, which is due for release in late August, and should more or less fix what I six months ago ranked as the single worst problem affecting Firefox’s memory consumption.
The Key Tool: Memory Reporters and About:memory
I mentioned about:memory above. It’s worth discussing in more detail, because it’s the single most important tool we’ve created, and has driven a lot of the MemShrink improvements.
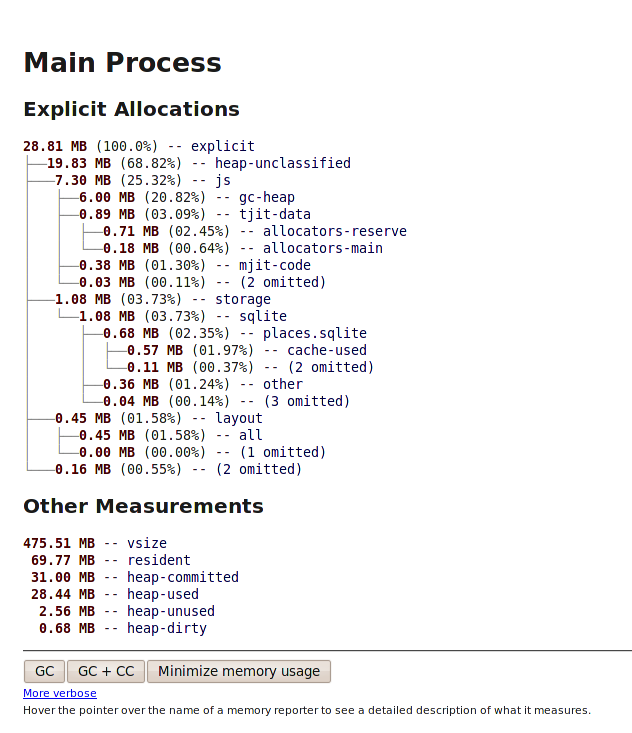
Let’s look at about:memory as it was in Firefox 6, which was released about 10 months ago.
Even these early versions had several key properties.
- about:memory doesn’t need a special build to run; it works even in released versions.
- It is trivially easy to use — you just type “about:memory” in the address bar.
- Because it’s all text you can cut and paste the output, and unlike many web pages it is carefully constructed so that it reproduces beautifully when you do so. No screenshots are necessary.
These properties massively expand the number of people who are able to detect and report problems relating to memory consumption. Any Firefox user can potentially do it; if the user doesn’t already know how, they can be taught in 10 seconds.
Having said that, this old version is almost laughably primitive compared to what we have now. First, let’s consider the state of the memory reporting infrastructure, which about:memory completely relies on, as it was at that time.
- There were a fixed number of measurements, which meant there were no individual measurements for variable-numbered entities such as compartments, window objects, or SQLite connections. Such measurements were only possible once I added support for memory multi-reporters. We now have dozens of measurements per variable-numbered entity, and thousands of measurements in total.
- Even once per-compartment reporters were added, we still didn’t have much insight into the memory consumption of the JavaScript code used by Firefox itself (and its add-ons). But compartment-per-global landed recently and gave us much finer-grained measurements, which (a) gives us some idea of how much memory is being used by JavaScript-based add-ons, and (b) gets us very close to being able to report memory consumption for each tab. Users have been requesting both of these things for years.
- Early memory reporters had lots of defects that caused them to report incorrect numbers, but these were obvious only when the numbers were ridiculously large or negative (both of which happened on occasion). The first of two major improvements in correctness came about as we learned how to structure memory reporters to avoid common defects. In particular, it’s best to write reporters that are traversal-based rather than counter-based, and to measure heap blocks with
malloc_usable_sizerather than computing the sizes. Reporters that usemalloc_usable_sizealso measure slop bytes, which are caused by the heap allocator rounding up allocation requests and can account for 5–10% of the heap. Early reporters didn’t have these characteristics, but most of them have been converted now. - Reporters with these characteristics are doubly-virtuous, because they also integrate well with DMD, a tool I wrote that dynamically checks memory reports. DMD provided the second major improvement in memory reporter correctness, because it identifies heap blocks that are counted twice, which is a mistake that’s easy to make.
- DMD also identifies unreported heap blocks, and was crucial in getting the “heap-unclassified” number down. In the example above it was 68.82%(!), whereas now it’s typically around 15%, which is low enough that people have mostly stopped complaining about it. Prior to DMD, identifying this “dark matter” was much harder and less systematic.
- The only tree shown in the above example is “explicit”. On Linux, Justin Lebar added code to summarize the information in the
/proc/<pid>/smapsfile in “size”, “rss”, “pss” and “swap” trees. - The reporters back then could only report byte measurements. They can now report unitless counts and percentages, both of which are useful.
Now consider the about:memory page itself, as it was back then.
- Insignificant measurements were simply omitted, and you had to reload in verbose mode to see them (and the measurements would be re-taken when that happened, potentially losing any interesting measurements). Now it is possible to expand and collapse arbitrary parts of the trees on the fly.
- The “Other Measurements” section contained a flat list of measurements. Trees are now possible, which makes that section more flexible and easier to understand.
- about:memory’s has been carefully streamlined to consume as little memory as possible, so that it doesn’t perturb what it’s measuring. This is really important now that we report so many measurements.
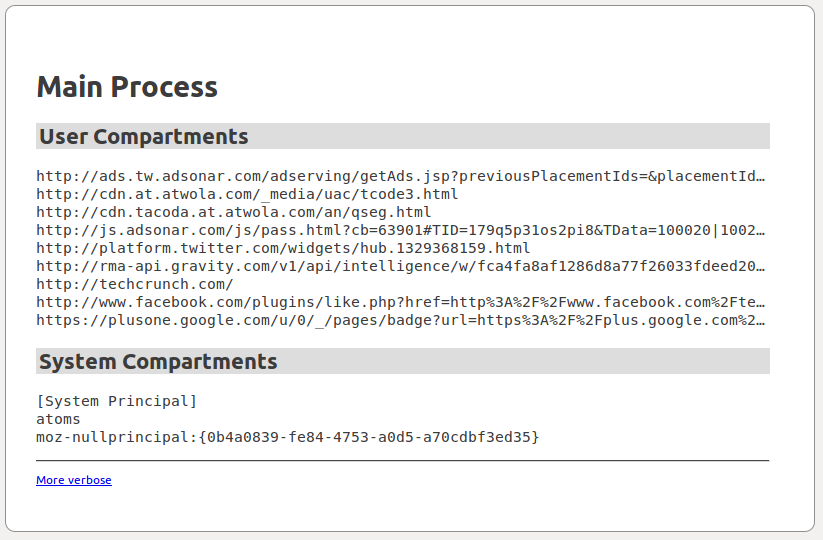
- about:memory now has a companion page, about:compartments, that just lists compartments (and ghost windows). about:compartments shares a lot of code with about:memory, and it is better than about:memory for certain tasks such as spotting zombie compartments.
All this stuff is important because you make what you measure. Just about every time we’ve started measuring some new thing, we’ve found and fixed problems as a result.
Smaller Things
The following smaller accomplishments were also made in the past year.
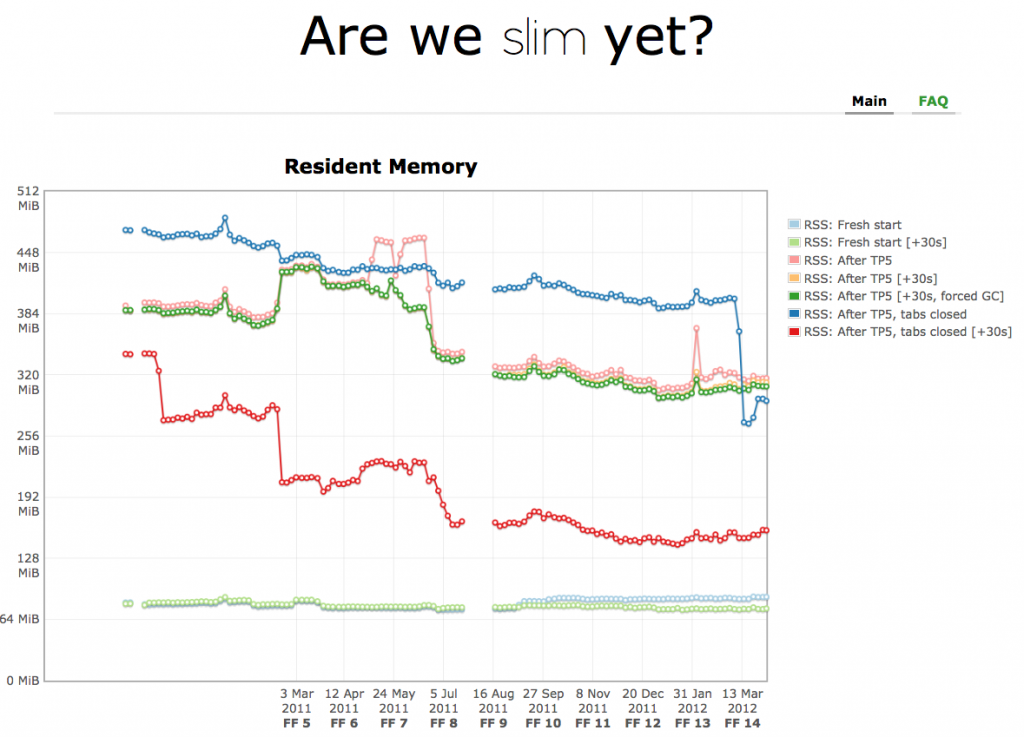
- John Schoenick used the MozMill endurance tests to build areweslimyet.com, which helps identify regressions in memory consumption.
- I removed a lot of unnecessary memory waste caused by “clownshoes” allocations.
- Olli Pettay wrote about:cc and Jan Honza Odvarko wrote about:ccdump. These closely related tools have been used to find various cycle collector leaks.
- I wrote 41 progress reports. I had/have two goals with these: to keep interested people informed of what it happening, and to provide evidence that Mozilla actually does care about memory consumption in Firefox.
This is only the tip of the iceberg, though. As I am writing this, there have been 314 MemShrink-tagged bugs marked FIXED in Bugzilla. In comparison, there are only 221 MemShrink-tagged bugs currently open. Breaking them down by priority we get the following.
- P1: 52 fixed, 25 open
- P2: 135 fixed, 88 open
- P3: 53 fixed, 106 open
- Unprioritized: 74 fixed, 2 open
Over 75 people were responsible for these fixes. I give many thanks to all those people, plus everybody who contributed in any other way to fixes, such as bug reporters and patch reviewers. And I’d like to give extra thanks to the MemShrink regulars: Justin Lebar, Kyle Huey, Andrew McCreight, Johnny Stenback, and Jet Villegas.
What’s Next?
There’s no real secret to MemShrink. So far it’s basically been a long, steady grind, gradually improving tools, fixing leaks, slimming down data structures, and responding to user’s problems. There are no plans to change that, and we’ll continue our recently-lowered pace of fortnightly meetings for the foreseeable future. And if we’re lucky, I might be writing a report on MemShrink’s second birthday a year from now!


