(“This Week in Glean” is a series of blog posts that the Glean Team at Mozilla is using to try to communicate better about our work. They could be release notes, documentation, hopes, dreams, or whatever: so long as it is inspired by Glean. You can find an index of all TWiG posts online.)
This is a special guest post by Anthony Miyaguchi!
For years, the Firefox Telemetry Measurements Dashboard has served as the go-to spot for visualizing measurements of various components in the browser. As our data tooling matures, we have also re-evaluated the way that we visualize aggregates. GLAM is the next iteration of the measurement dashboard, designed to generate and visualize aggregates over a large set of dimensions that are relevant to Firefox engineers and product managers. One defining difference is that we have moved from a S3 and Spark-based processing pipeline into one that centers around BigQuery.
Alongside aggregates for desktop Firefox, we have been thinking forward toward aggregates for Firefox on Android (currently Firefox Preview). As one of the earliest adopters of Glean, it is known throughout our repositories as Fenix. Though Telemetry and Glean are similar in many aspects, I’ve been able to recognize the collective experience in managing several thousand probes through the lens of Glean design decisions. In the rest of this post, I’ll be discussing the differences relevant in preparing Glean data for visualization in GLAM.
Extract-Transform-Load
The processing pipeline for Fenix has evolved from the extract-transform-load (ETL) queries written for desktop Firefox aggregates. For Firefox, main-pings are transformed into intermediate client-level aggregates every day. These aggregate tables are built incrementally so they can span far into history while processing each day only once. Downstream from these tables are SQL queries that tidy the data for visualization. This involves tasks such as enumerating bucket ranges and calculating useful statistics like percentiles.
An initially intimidating series of processing jobs for desktop telemetry.
The SQL queries are run on BigQuery, and depend on materialized results of a previous query. When these tasks are grouped together and sequenced, they form a directed-acyclic graph (DAG). This concept is useful because it captures dependencies between tasks. I was initially intimidated by the large desktop GLAM task graph, but it quickly faded after work on the Fenix processing pipeline began in earnest. Through the process of adapting aggregates from the telemetry.main table to org_mozilla_fenix.baseline table, I’ve come to appreciate the structure of metrics in the Glean ping and the convenience of accessing Glean data in BigQuery.
One of the most significant departures from the main ping is that measurements have been split semantically across multiple payloads. This means that a ping for a bookmark sync can contain different information than a history sync. One effect of this is the ability to represent the entire ping as a columnar BigQuery table. For example, it is fairly simple to aggregate a histogram within a Glean ping.
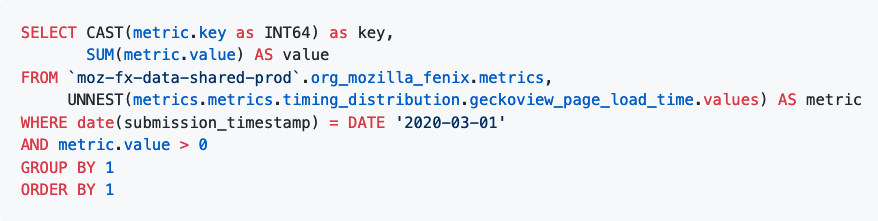
An example query for summing a histogram.
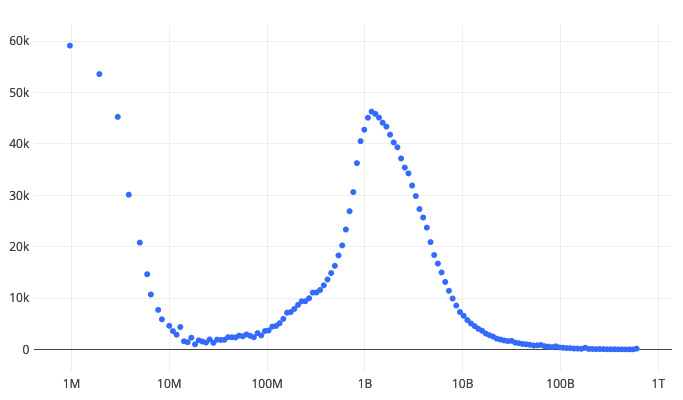
Summed timing distribution of `geckoview_page_load_time` in nanoseconds for 2020-03-01.
The main ping, on the other hand, is a monolithic relic that has become an unwieldy beast. The main ping contains thousands of probes, which has posed representational problems in BigQuery due to a hard 10,000 column limit. Each of the probes contains metadata such as the type (e.g. linear or exponential) or the range of the buckets. The probes can also appear across several processes. There have been estimates that there are up to 60k-80k columns if each path in the document were fully enumerated. To reduce the number of leaves in the schema (e.g. a primitive type like INT64 or STRING), histograms in the ingestion ping tables are represented as a JSON string. In addition, the sheer number of probes in the table requires further tuning queries to prevent overly complex SQL and large shuffles between the underlying BigQuery slots.
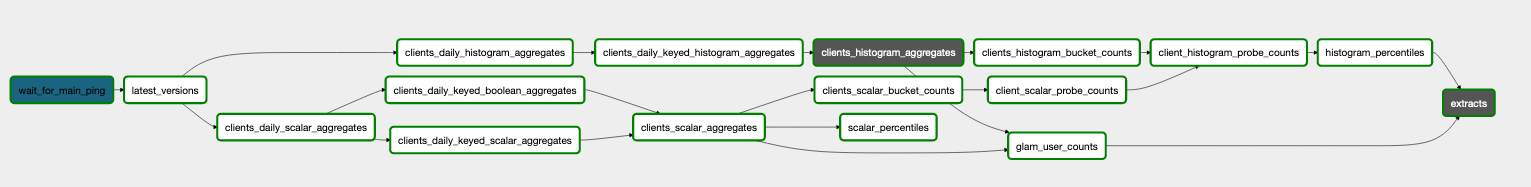
Client aggregation from daily aggregates of Fenix pings.
In contrast, Glean sends many small pings that are structurally consistent and semantically meaningful. A query written for one Glean ping table can be re-used against another Glean ping table. However, writing SQL for many small pings can be tedious to maintain by hand. In bigquery-etl, we use a templating engine to generate a set of SQL queries to process all of the tables in a Glean dataset. These queries are then combined into a logical view that are used by downstream tasks. The figure above shows the flattening and daily client aggregation of both the scalar (e.g. counters) and histogram (e.g. timing distribution) values for each of the ping tables.
Development and Next Steps
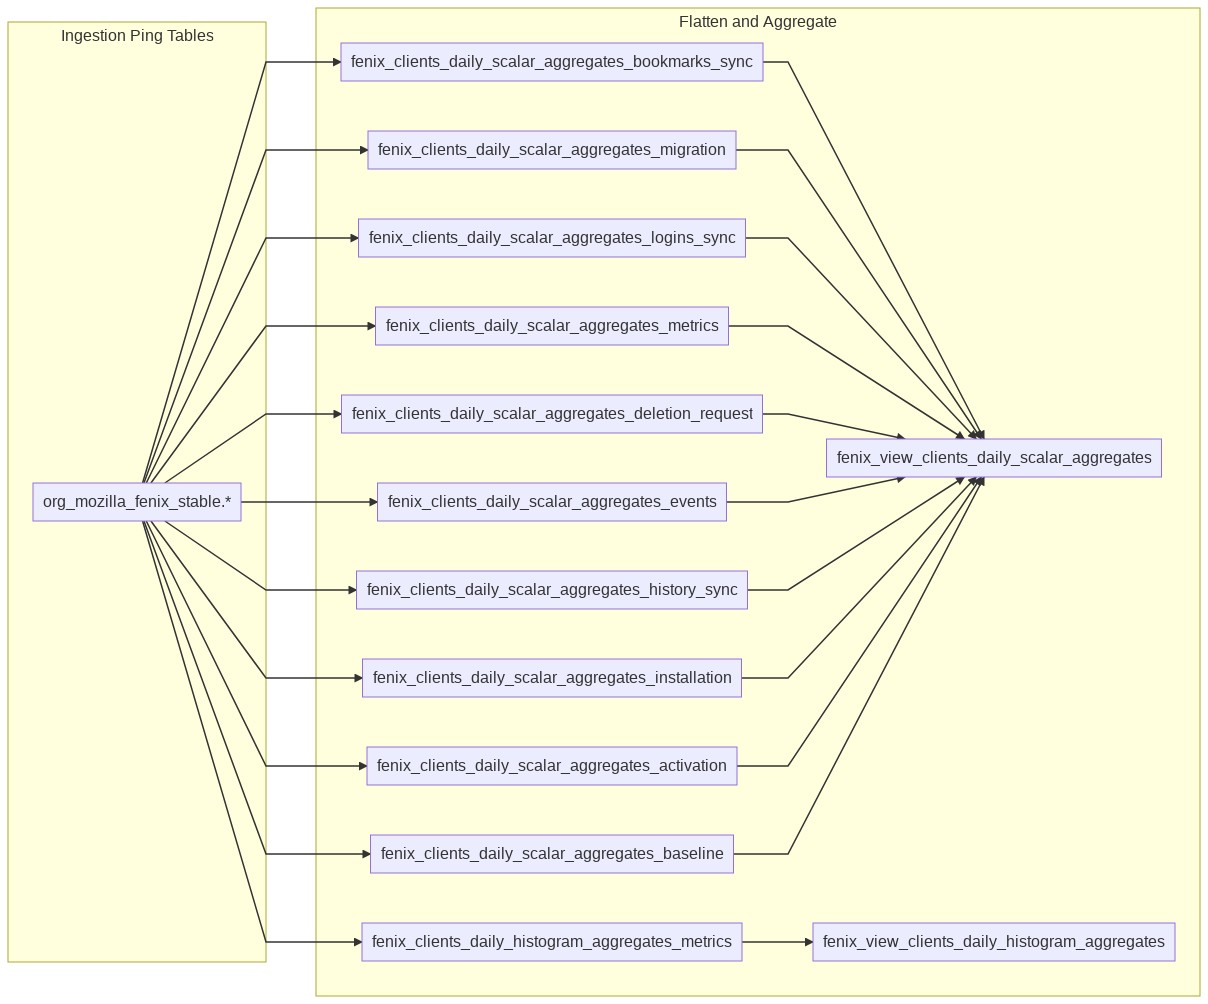
The aggregation pipeline is well organized, but complex due to the required calculations for visualization. The following diagram shows the flow of data up until the source of GLAM ingestion. This process is the same for desktop telemetry, with adjustments to counter the idiosyncrasies of main pings.
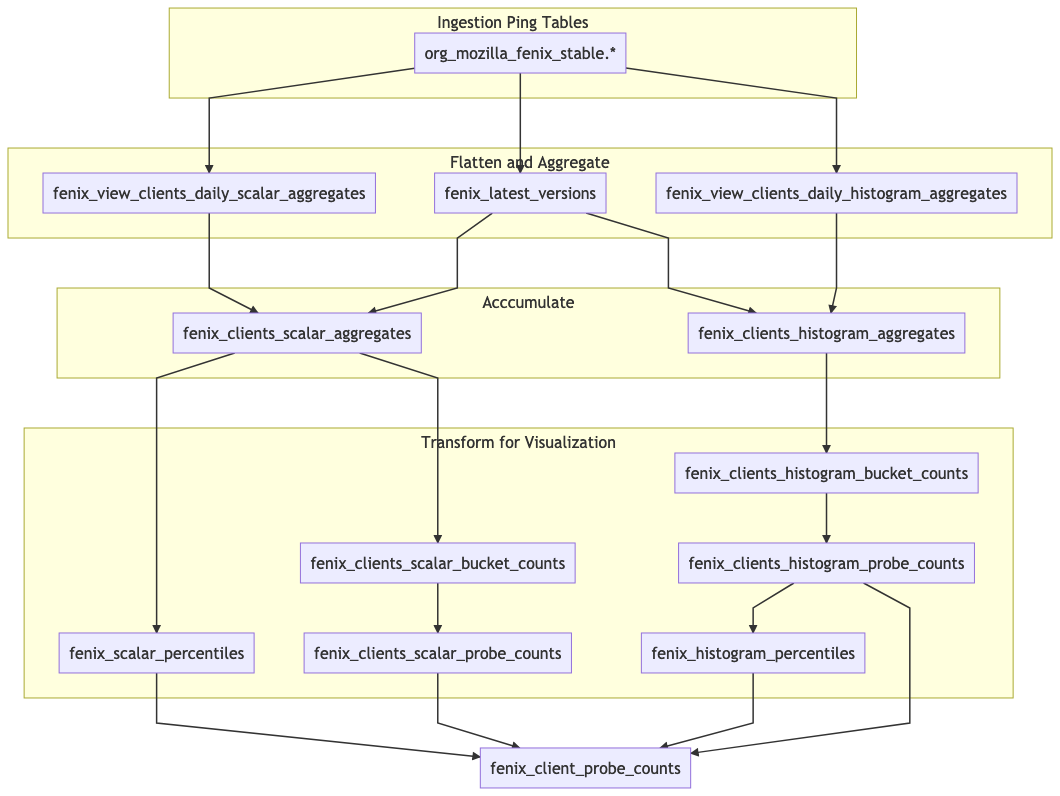
Dataflow for transforming aggregates for visualization. Note that the fenix_view_clients_daily tasks under “Flatten and Aggregate” have been collapsed from the previous figure.
The ingestion of Glean data into GLAM is in active development (see Bug 1610983), but the end-to-end pipeline of aggregates from ingested ping tables to CSV files has been implemented. Some of the next steps include automating the task dependency graph for use in Airflow, adding support for new metric types like strings, and generalizing the queries to products outside of Fenix.
Of the challenges ahead, the one that I find most interesting is managing the fan-out of tasks so they are easy to debug. Any product instrumented with Glean will be able to take advantage of this infrastructure “for free” because of the consistent structure of the pings and the templatization of queries in the pipeline. However, this will require building a maintainable process to keep aggregates up to date. Currently, there are 23 queries involved with the ETL of Fenix data into GLAM. Sometime in the near future, adding the nightly channel of Fenix will double the query count. There are over 10 products currently registered in the data platform, so there will be hundreds of tasks to schedule every day. However, the Glean SDK and the BigQuery ETL primitives at our disposal makes complexity manageable.