Diversity and inclusion is core to who we are at Mozilla Corporation. As a wholly owned subsidiary of the non-profit Mozilla Foundation with just over 1,000 employees globally, the Mozilla Corporation is focused on building products (like Firefox, Focus and Pocket) and exploring new technologies that give people more control over their lives online and shape the future of the internet for the public good. Our experience has demonstrated that diverse and inclusive teams lead to better products. And there’s significant independent research that confirms this conclusion.
Two years ago, we embarked on a journey to actively improve our organizational diversity and inclusion globally. Today, we’re sharing details about our demographics and the results of our ongoing efforts.
We are sharing our results to date to be transparent and hold ourselves accountable to our global community as we strive to build a more diverse and inclusive organization that reflects the people we serve. We aim to create a working environment where everyone can thrive and do their best work. We are not where we want to be, and have a lot more to do. We will post updates each year and update the blog when we have progress or challenges to share.
Diversity
To increase diversity one of the key areas of focus has been in how we recruit. We have introduced changes in our recruitment process that are showing results. We have trained our recruitment teams on behavioral interviewing and inclusive hiring, partnered with organizations like Jopwell to seek out more diverse candidates, and leveraged technology to mitigate bias in job descriptions and coding exercises. As a result, we are encouraged to see progress in increasing diversity for women globally and moving in the right direction for people of color in the United States.
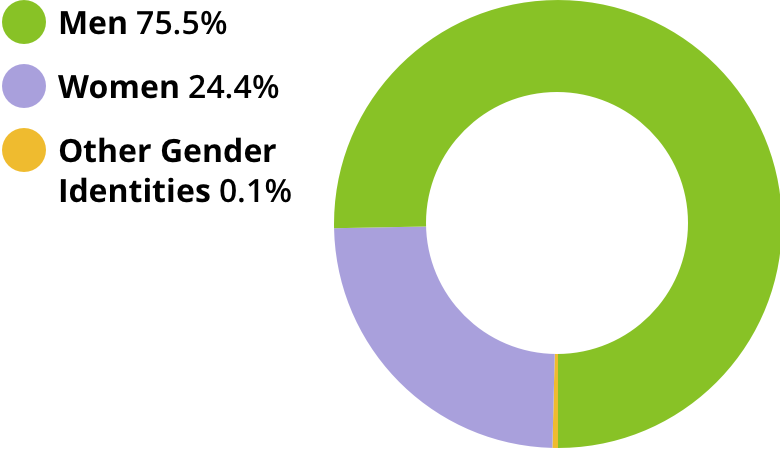
Gender (Global)
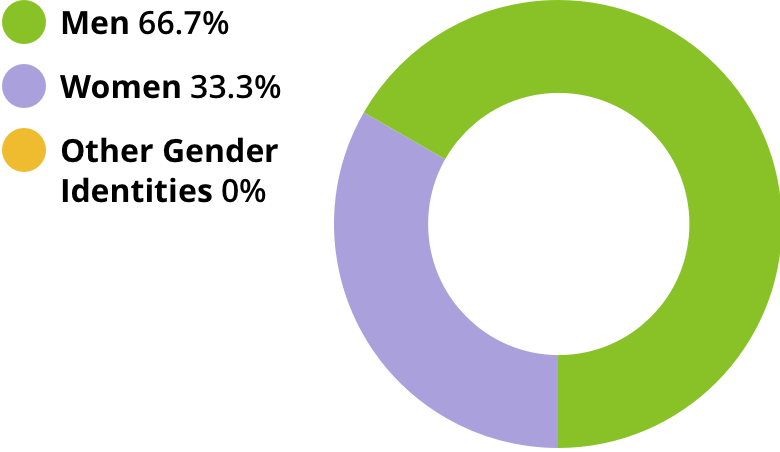
33.7% of hires overall and 20.2% of technical hires in 2017 were women. We have increased representation of women overall in 2017 by 1.5% to 24.4%. Women represent 36% of all people managers with 33.3% representation of women in executive leadership roles (vice president level and above).
Mozilla Corporation Gender Diversity (Global)
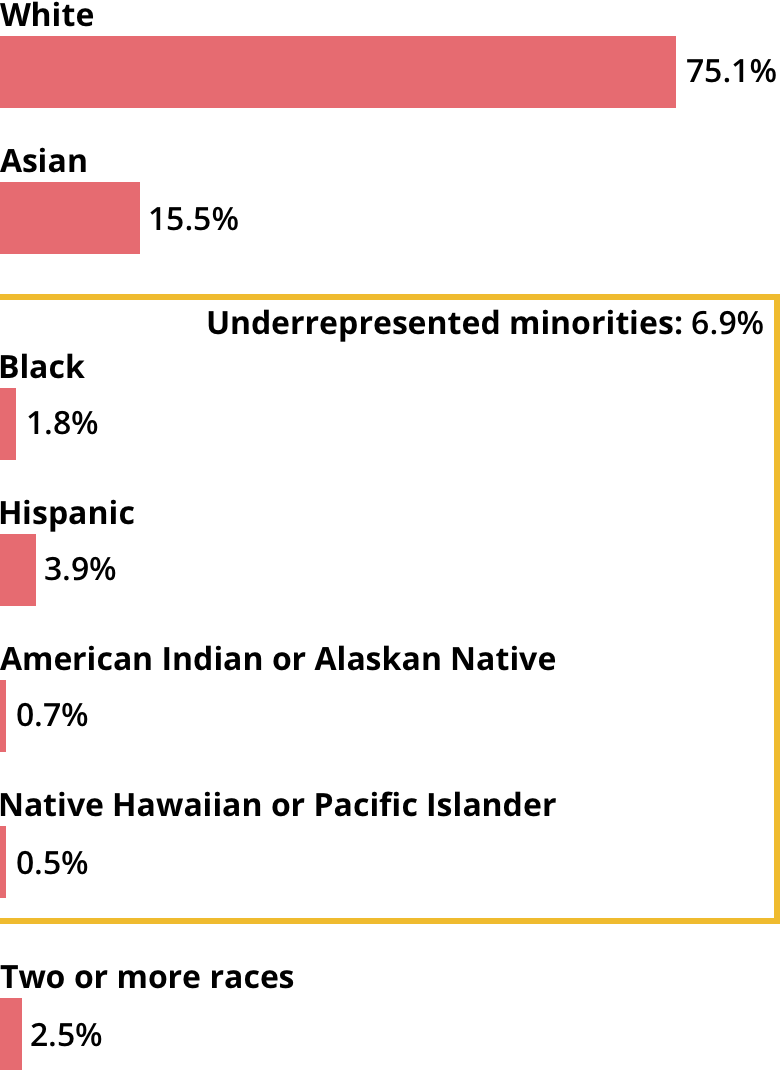
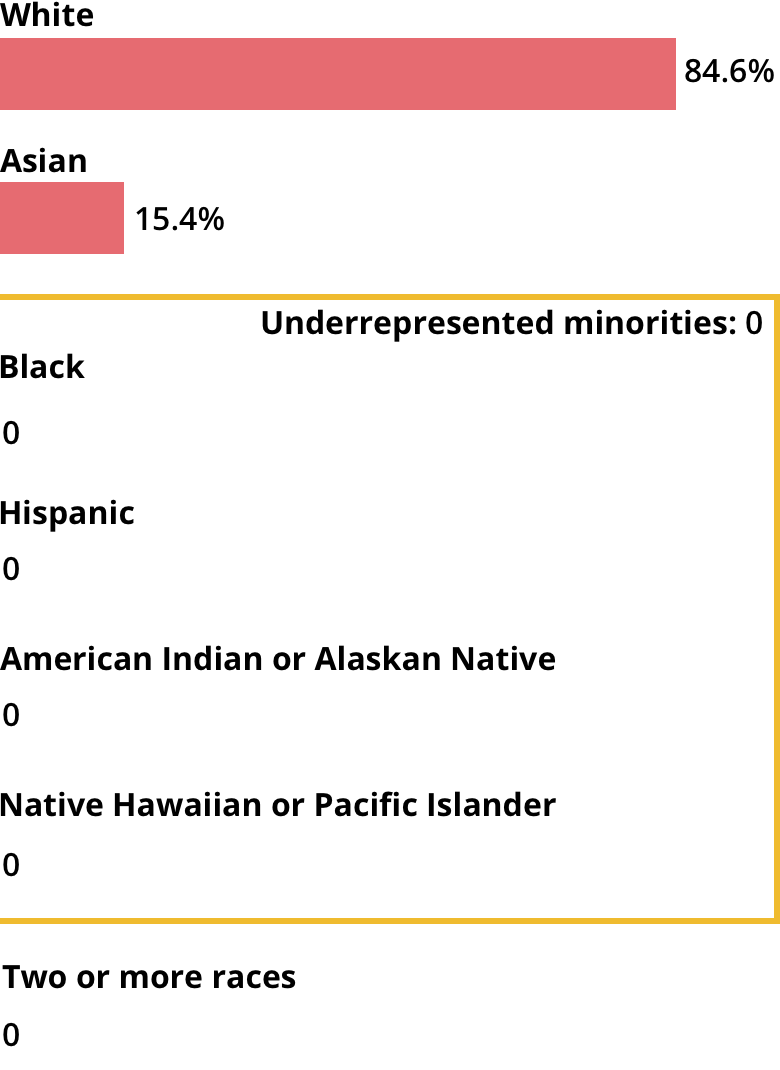
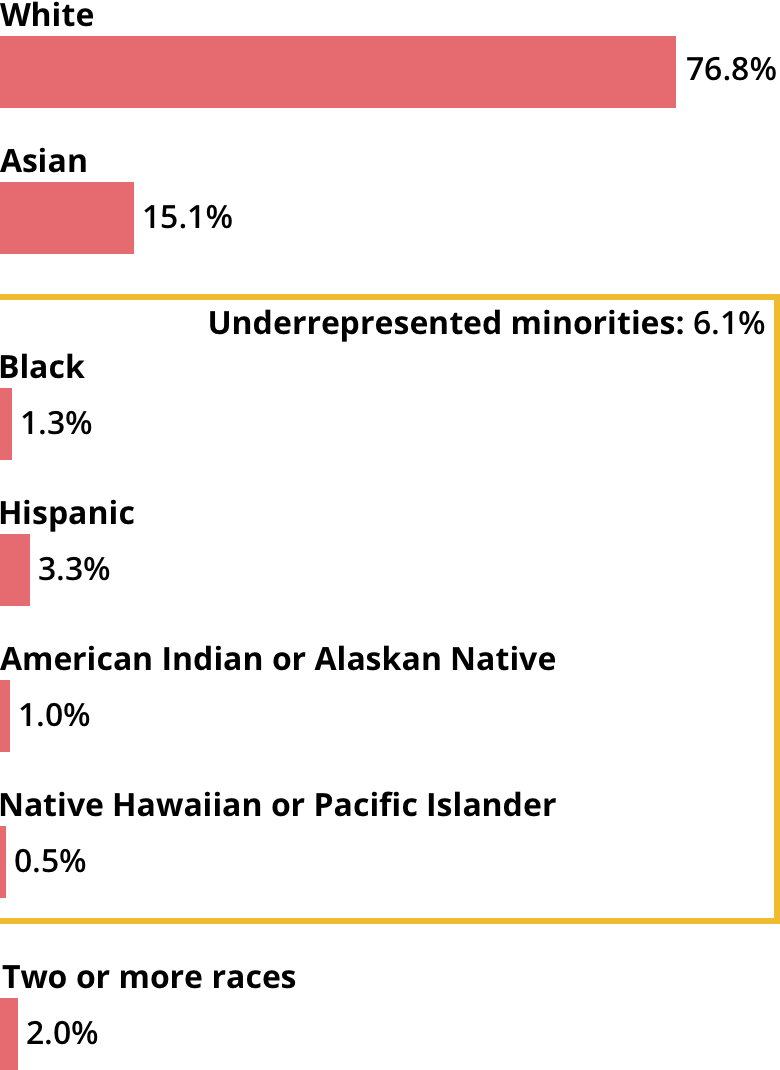
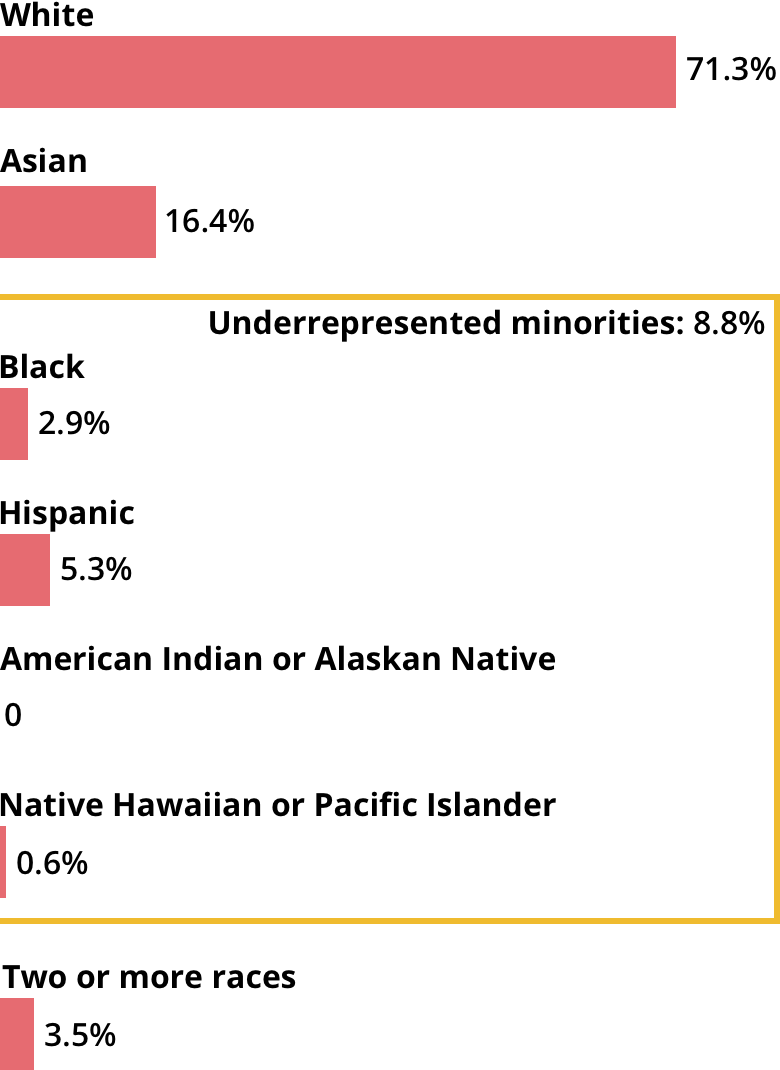
Underrepresented Minority Groups (United States)
12.4% of all people hired in 2017 were from underrepresented minority groups, and 35.2% of all new employees are people of color. We have increased the representation of black Mozillians by 0.8% and Hispanic Mozillians by 0.5% in 2017.
Mozilla Corporation Racial and Ethnic Diversity (US Only)
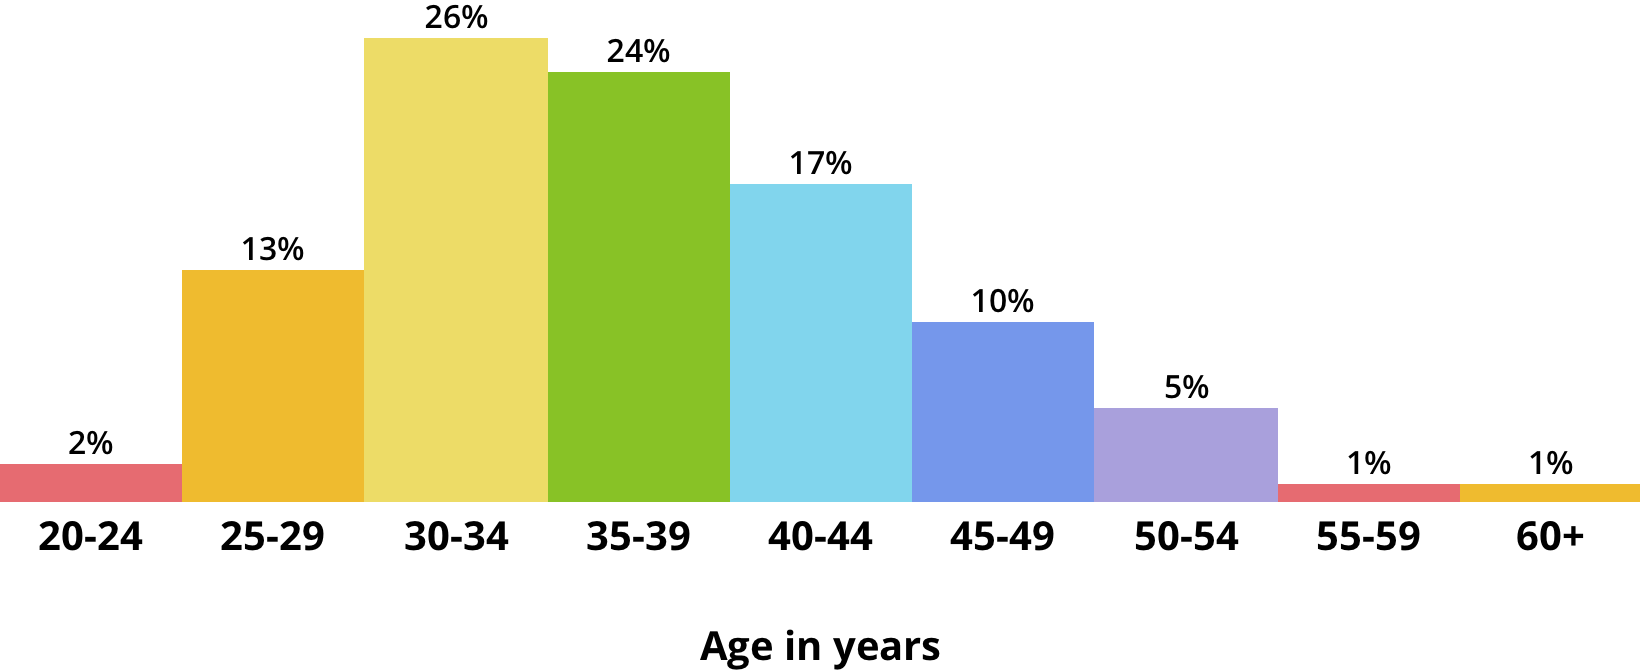
Age (Global)
The median age of our employees is 36.
Mozilla Corporation Age Diversity (Global)
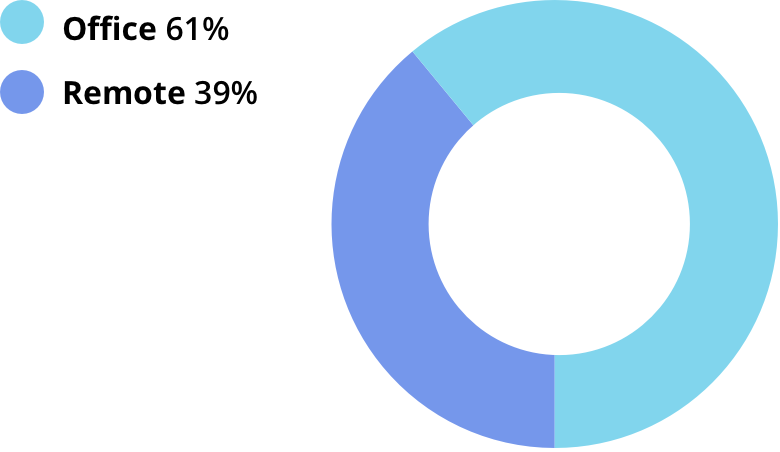
Geography (Global)
39% of our employees work remotely from home offices and coworking spaces, rather than from one of our 10 global offices. 43% of our employees are based outside the United States in one of 14 other countries.
Mozilla Corporation Workforce Distribution (Global)
Inclusion
In addition to understanding our demographic diversity, we have worked over the past two years to build and promote an ever more inclusive culture. We learned from focus groups and conducting an Inclusive Culture Survey that there were significant gaps in key areas of inclusion between women and men that we have worked to address.
We partnered with Stanford’s Clayman Institute for Gender Research to bring cutting edge academic research into our inclusion strategy and launched their women’s leadership development program. We also implemented major revisions to our Community Participation Guidelines (CPG) to set clearer expectations for behavior for our community of employees and volunteers in order to foster a more inclusive experience for all Mozillians who participate in our work.
We continue to measure inclusion through our twice a year employee Engagement Survey and have significantly reduced measurable differences between women and men’s experiences of our workplace culture in 2017. Our goal is to eliminate them entirely in the year ahead.
To foster greater inclusion for diverse people more broadly, we are actively working with Engendering Success in STEM, Outreachy, TechWomen, Tapia Celebration of Diversity in Computing, JSConf EU, Lesbians Who Tech, and many others, to sponsor programs and events that can help build a more representative pipeline of candidates for the tech industry and welcome many more diverse voices into the Open Source community.
Next Steps
Over the past two years, we have made some measurable progress, but there’s much more we need to do. We are committed for the long term to improving our organizational diversity and inclusion. Since you can’t fix what you don’t measure, we’ll continue to track progress — and report back on successes, learnings, and where we have more work to do.
Methodology
All diversity data are self-reported and drawn from Mozilla Corporation’s Human Resources Information System (HRIS) for regular employees as of December 31, 2017. Progress over 12 months is compared against December 31, 2016. Leadership representation is comprised of all vice presidents and above, including technical fellows; managers are any employees who manage others. Technical workers are defined using the AnitaB.org definitions. Currently less than 1% of Mozilla employees select “other gender identities”; we recognize that gender identities exist on a spectrum and intend to offer a more inclusive set of choices to our employees on gender identity, disability, veteran status and other diversity dimensions before next year’s disclosure. All race data are for US employees only, and categories are driven by US government requirements for disclosure. Employees who decline to provide demographic data are not included in the metrics provided. Mozilla Corporation has shared our EEO-1 form for US gender and race/ethnicity for three years as part of our State of Mozilla report; the 2017 form can be found here.
Data
| Overall | Leadership | Tech | Non-Tech | |
|---|---|---|---|---|
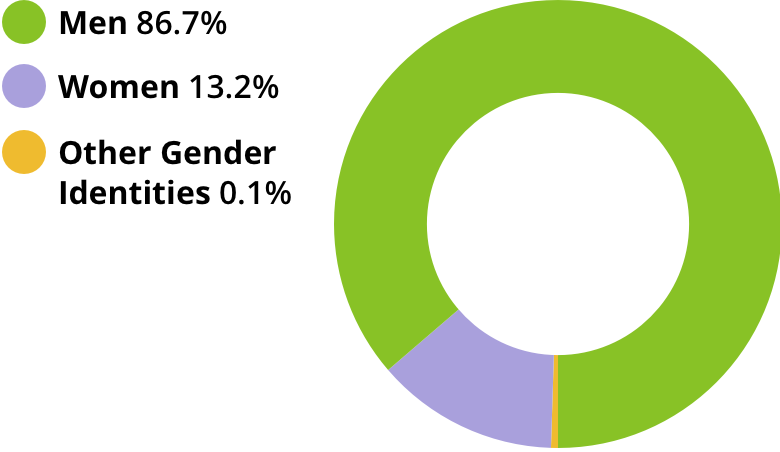
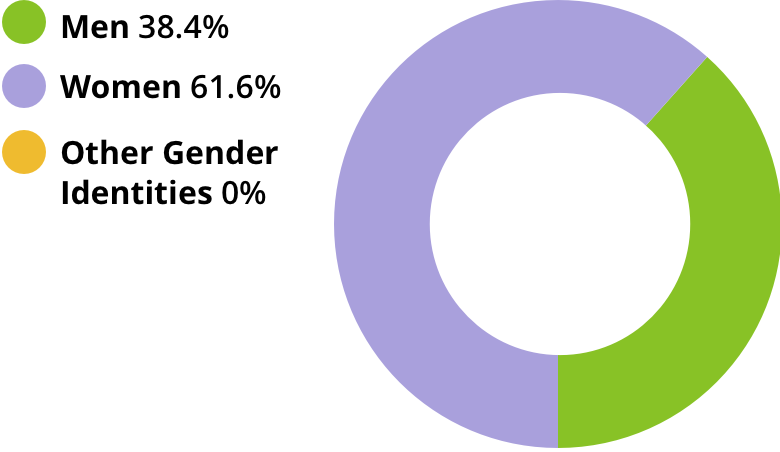
| Men | 75.5% | 66.7% | 86.7% | 38.4% |
| Women | 24.4% | 33.3% | 13.2% | 61.6% |
| Other Gender Identities | 0.1% | 0 | 0.1% | 0 |
| Overall | Leadership | Tech | Non-Tech | |
|---|---|---|---|---|
| White | 75.1% | 84.6% | 76.8% | 71.3% |
| Asian | 15.5% | 15.4% | 15.1% | 16.4% |
| Black | 1.8% | 0 | 1.3% | 2.9% |
| Hispanic | 3.9% | 0 | 3.3% | 5.3% |
| American Indian or Alaskan Native |
0.7% | 0 | 1.0% | 0 |
| Native Hawaiian or Pacific Islander |
0.5% | 0 | 0.5% | 0.6% |
| Two or more races | 2.5% | 0 | 2.0% | 3.5% |
| Age in years | Overall |
|---|---|
| 20-24 | 2% |
| 25-29 | 13% |
| 30-34 | 26% |
| 35-39 | 24% |
| 40-44 | 17% |
| 45-49 | 10% |
| 50-54 | 5% |
| 55-59 | 1% |
| 60+ | 1% |
| Location | Overall |
|---|---|
| Office | 61% |
| Remote | 39% |
Edited May 3, 2018