This blog post was originally issued May 20, 2020 and revised July 7, 2021 with updated data, because we identified errors. The most significant differences were that we overreported women in leadership positions and people of color in technical roles, and we underreported people of color in non-technical roles. More information on this correction can be found in the 2020 Diversity and Inclusion Disclosure.
This is the third year that we’re sharing data about the make-up of our workforce and how we’re making Mozilla a more inclusive workplace. We’re committed to sharing how we’re doing in our work to increase diversity at Mozilla and to ensure it’s an inclusive environment where everyone feels like they can do their best work. Research shows that diverse teams are more innovative, productive and outperform homogeneous ones. To help us achieve our mission to “ensure the internet is a global public resource, open and accessible to all”, we need a diversity of people involved. Also, caring about diversity and inclusion is just the right thing to do.
The Mozilla Corporation is a wholly owned subsidiary of the non-profit Mozilla Foundation. With over 1,000 employees globally, our focus is on building products and services (like Firefox and Pocket) and exploring new technologies to give people more control over their online lives and help shape the future of the internet for the public good.
We’ve made progress that we’re proud of, and there are areas we are focused on improving and making more progress in. We see that increasing the number of underrepresented minorities in the US is our biggest opportunity.
Increasing diversity at Mozilla
Last year was the second year that Mozilla’s senior leadership set diversity goals for the organization. We focused on the same two demographics from the previous year: women in technical roles globally and underrepresented minorities in the United States. For the second year in a row, we surpassed our goal for women in technical roles. But we missed our goal on underrepresented minorities. Details on our results are at the end of this post.
Here’s the main lessons that we’ve learned over the past three years
- Inclusion is completely tied to diversity. If we aren’t the kind of place underrepresented people want to work, no amount of marketing will help. And shaping a culture takes time, focus and persistence. We aim to create a working environment where everyone can thrive and do their best work. In 2018, one of the areas of focus was safety to report harassment, bullying and other inappropriate behaviour. We started talking more about what kind of behavior is inappropriate and included information on how to report in our D&I workshops with the new hire onboarding cohort. We had our leaders remind people in their orgs about how to report harassment. The score for this question continues to increase on our twice annual company-wide engagement survey.
- Business leaders need to lead with the changes that make sense for their organizations. For Diversity and Inclusion (D&I) efforts to result in substantial and successful outcomes, business leaders need to lead. The D&I team uses various types of data to identify issues and propose programs, and support and commitment of leaders to take ownership of D&I is critical. For example, the Firefox department, which is about half the company, has been enthusiastic partners in ensuring our recruitment process is inclusive. The Marketing department has invested several years in culture work–first establishing team norms, socializing them, and creating a Cultural Advocate role and team. And as the Pocket team continues to grow, they have been deliberate in how they scale their culture, including hiring a Culture Manager early on and focusing on inclusion from the start by creating rituals that encourage Pocketeers to bring their interests, passions and full selves into their work and relationships.
Gender (Global)
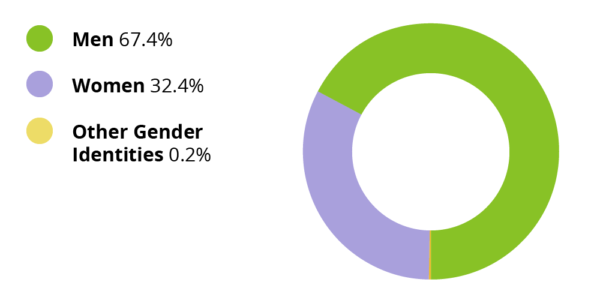
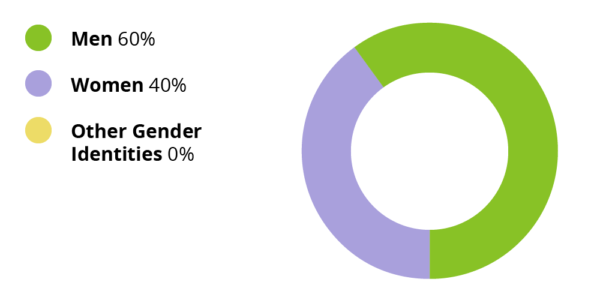
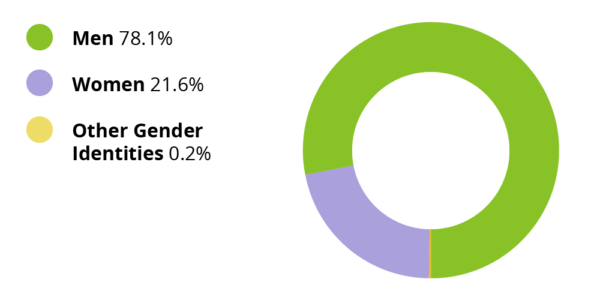
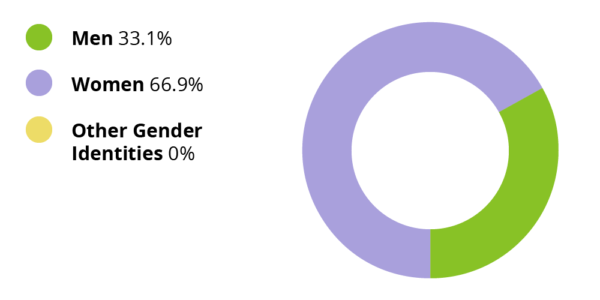
In 2019 we grew the number of women in technical roles from 17.4% (in 2018) to 21.6%. While we’re proud of this increase, we are still lagging behind other tech companies on women in technical roles. Women also made up 54.7% of hires overall and 44.1% of technical hires. We have increased representation of women overall from 28.3% to 32.4%. Women represent 41.4% of all people managers (up from 39.1%), with 40.0% representation of women in executive leadership roles (down from 41.2%)*.
We don’t think of gender as a binary and have developed policies to support staff who transition at work and have also offered many workshops internally on trans and non-binary inclusion at work.
Mozilla Corporation Gender Diversity (Global)
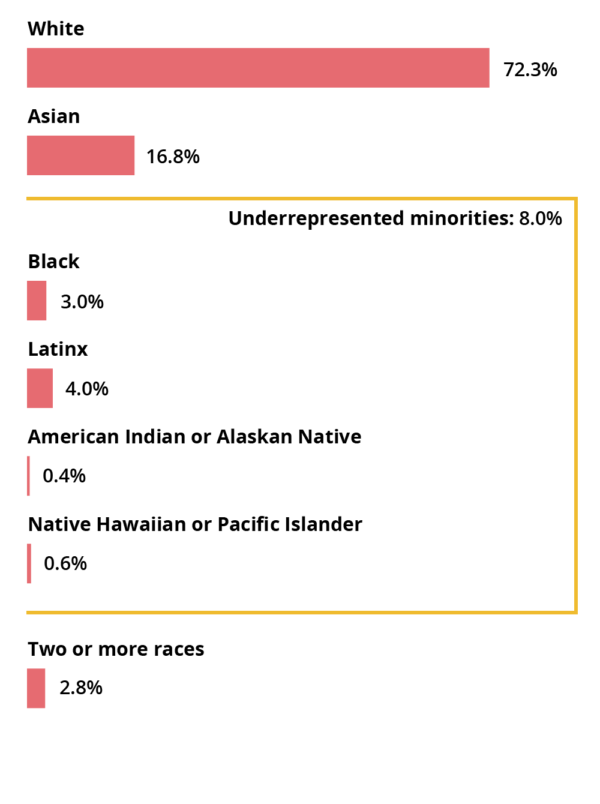
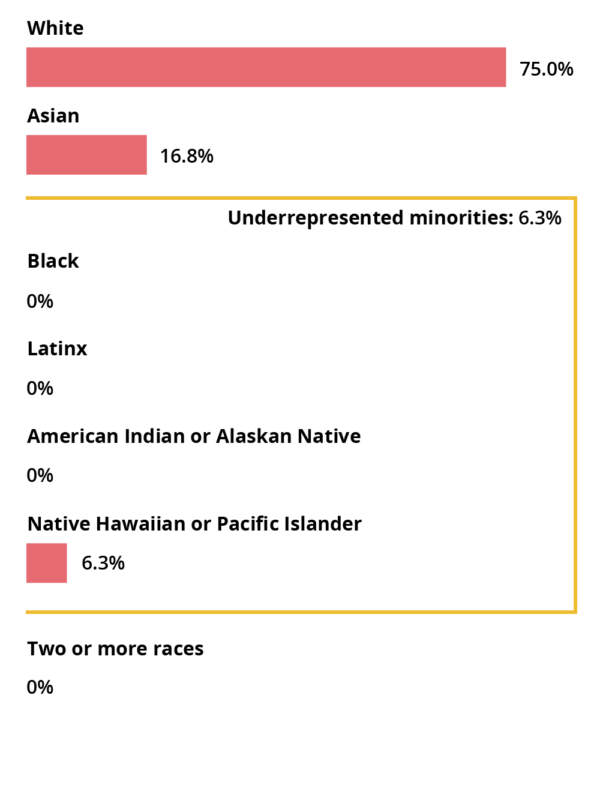
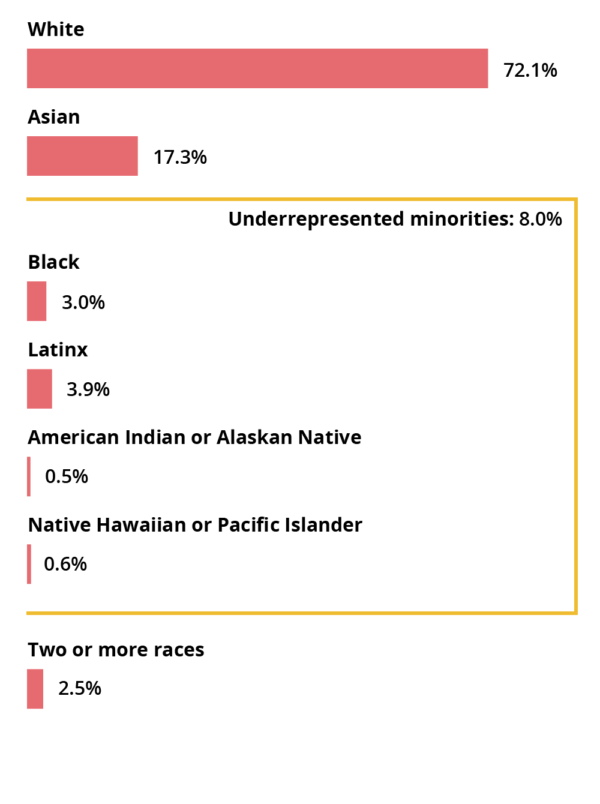
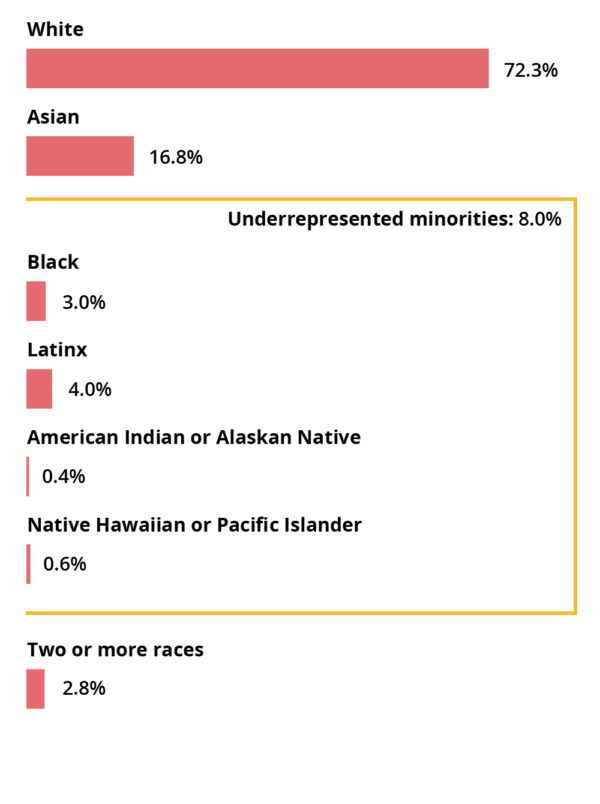
Underrepresented Minority Groups (United States)
Last year, we set a goal that 14% of our hires would be underrepresented minorities. We fell short of this goal with a hiring rate of 10.9%. While our representation of underrepresented people increased from 7.9% to 8.3%, we aren’t making progress as quickly as we had hoped. We have increased the representation of Black Mozillians to 3.2% (up from 2.7%). The representation of Latinx Mozillians stayed the same at 4.0%.
Mozilla Corporation Racial and Ethnic Diversity (US Only)
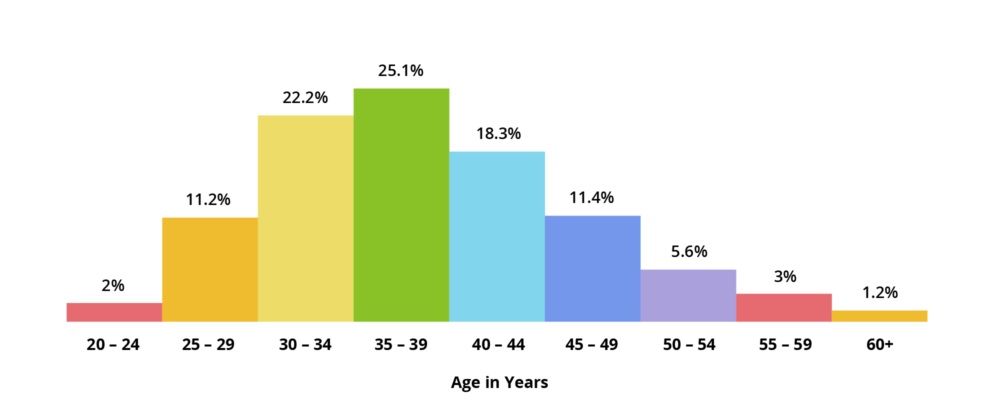
Mozilla Corporation Age Diversity (Global)
The median age of our employees was 37, which is the same as 2018. 40% of Mozillians are over the age of 40 (up from 35%).
Mozilla Corporation Age Diversity (Global)
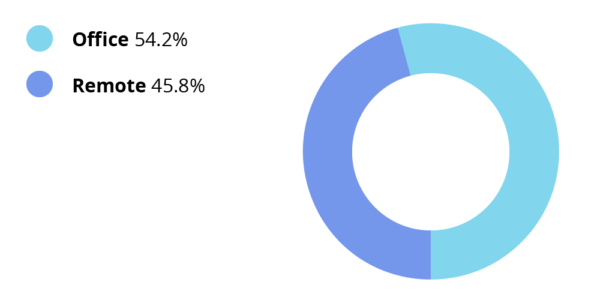
Mozilla Corporation Geography Diversity (Global)
46% of employees work remotely, the same percentage as 2018, from home offices and coworking spaces, rather than from one of our 10 global offices. 38% of our employees are based outside the United States in one of 14 other countries (down from 39%).
Mozilla has embraced remote working for many years and our remote work culture is strong. On all four engagement surveys in the past two years, remote workers have consistently had slightly higher engagement scores than workers in offices.
Mozilla Corporation Workforce Distribution (Global)
Here’s where we’re focusing our energy in 2020:
- Continuing to focus on the representation of women in technical roles globally and underrepresented minorities in the United States. We’ll partner with our Talent Acquisition team to continue debiasing our hiring process. We’ll also keep an eye on retention.
- Launching our first employee resource group. This resource group will be broadly focused on inclusion and a place where all Mozillians can choose to get involved.
- Working to increase psychological safety on teams. Psychological safety is “a belief that one will not be punished or humiliated for speaking up with ideas, questions, concerns or mistakes” and research shows that it’s foundational to innovation. Our hypothesis is that psychological safety is a key factor in creating an inclusive workplace.
Overall, we made progress in 2019 and we still have a lot more work to do. Increasing diversity and inclusion at Mozilla remains a top priority.
Methodology
All diversity data are self-reported and come from Mozilla Corporation’s Human Resources Information System for regular employees as of December 31, 2019. Progress over 12 months is compared against December 31, 2018. Leadership representation is made up of Vice Presidents and above, excluding executive-ranked technical fellows. Managers are any employees who manage others. Technical workers are defined using the AnitaB.org definitions. Currently less than 1% of Mozilla employees select “other gender identities.” We recognize that gender identities exist on a spectrum. At this time we do not track race and ethnicity outside of the US to comply with global laws. All race data are for US employees only, and categories are driven by US government requirements for disclosure. Employees who decline to provide demographic data are not included in the metrics provided.
Data (Updated on July 7, 2021)
| Overall | Leadership | Tech | Non-Tech | |
|---|---|---|---|---|
| Men | 67.4% | 61.9% | 78.1% | 33.1% |
| Women | 32.4% | 38.1% | 21.6% | 66.9% |
| Other Gender Identities | 0.2% | 0.0% | 0.2% | 0.0% |
| Overall | Leadership | Tech | Non-Tech | |
|---|---|---|---|---|
| White | 68.8% | 72.2% | 71.5% | 62.4% |
| Asian | 16.6% | 16.7% | 15.7% | 18.8% |
| Black | 3.0% | 0.0% | 2.3% | 4.6% |
| Latinx | 3.7% | 0.0% | 2.8% | 6.1% |
| American Indian or Alaskan Native |
0.4% | 0.0% | 0.4% | 0.5% |
| Native Hawaiian or Pacific Islander |
0.6% | 5.6% | 0.4% | 1.0% |
| Two or more races | 2.5% | 0.0% | 2.1% | 3.6% |
| Age in years | Overall |
|---|---|
| 20-24 | 2% |
| 25-29 | 11% |
| 30-34 | 22% |
| 35-39 | 25% |
| 40-44 | 18% |
| 45-49 | 11% |
| 50-54 | 6% |
| 55-59 | 3% |
| 60+ | 1% |
| Location | Overall |
|---|---|
| Office | 53% |
| Remote | 47% |