Last year at Mozilla Corporation we shared publicly for the first time how our workforce diversity numbers measured up to our ideals and to represent the people we serve. Today, we are sharing an update below on our continued work in this area. Overall, we made solid progress in 2018 — more than most in the open source sector — but we still have a lot more work to do. We are still lagging behind where we want and need to be.
The Mozilla Corporation is a wholly owned subsidiary of the non-profit Mozilla Foundation. With just over 1,050 employees globally, our focus is on building products and services (like Firefox, Firefox Monitor and Pocket) and exploring new technologies to give people more control over their online lives and help shape the future of the internet for the public good.
We are committed to sharing our diversity and inclusion results every year to hold ourselves accountable to creating an inspiring workplace where no one feels like an only.
Increasing diversity at Mozilla
Last year for the first time, Mozilla’s senior leadership set diversity accountability goals for the organization. We focused on two areas to start: the number of women in technical roles globally and representation of underrepresented minorities in the United States.
Gender (Global)
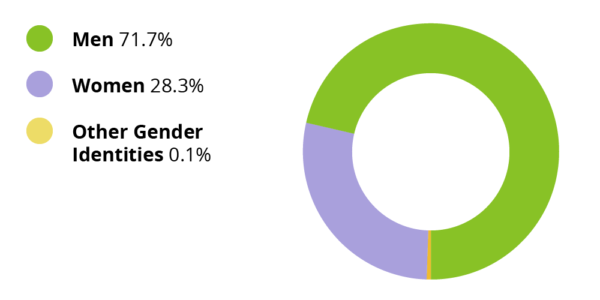
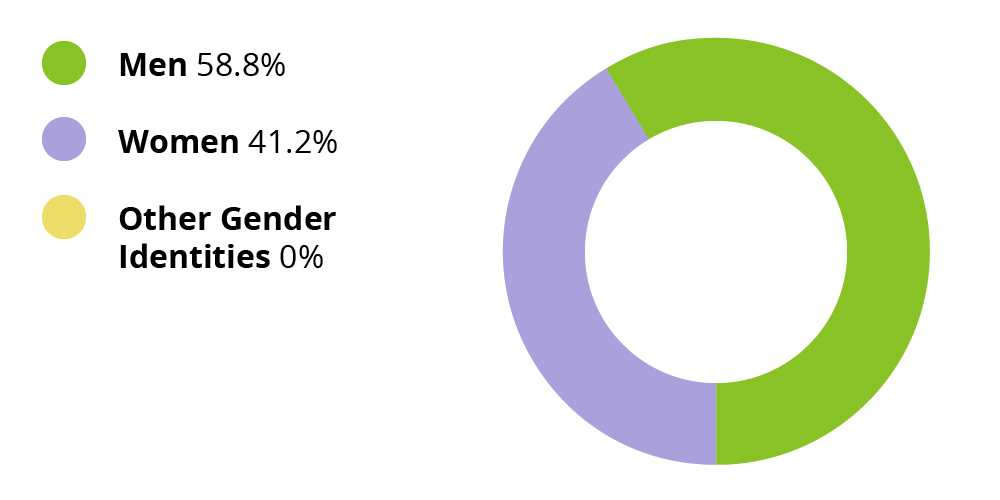
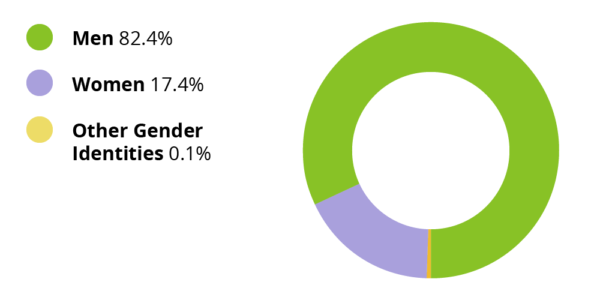
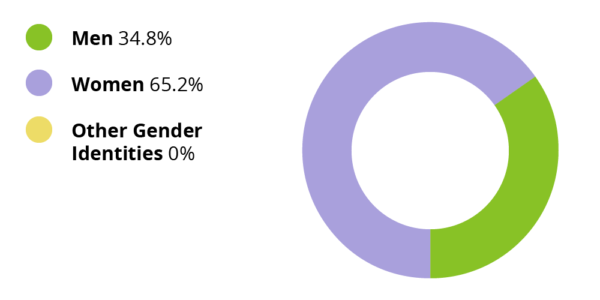
In 2018, a key goal was increasing our number of women in technical roles and we grew from 13.2% to 17.4%. While this year-over-year representation increase is well above the industry average, we are still lagging behind on overall representation. Women also made up 40.4% of hires overall and 33.7% of technical hires. We have increased representation of women overall from 24.4% to 28.3%. Women represent 39.1% of all people managers (up from 36.0%), with 41.2% representation of women in executive leadership roles (up from 33.3%)*.
Mozilla Corporation Gender Diversity (Global)
Underrepresented Minority Groups (United States)
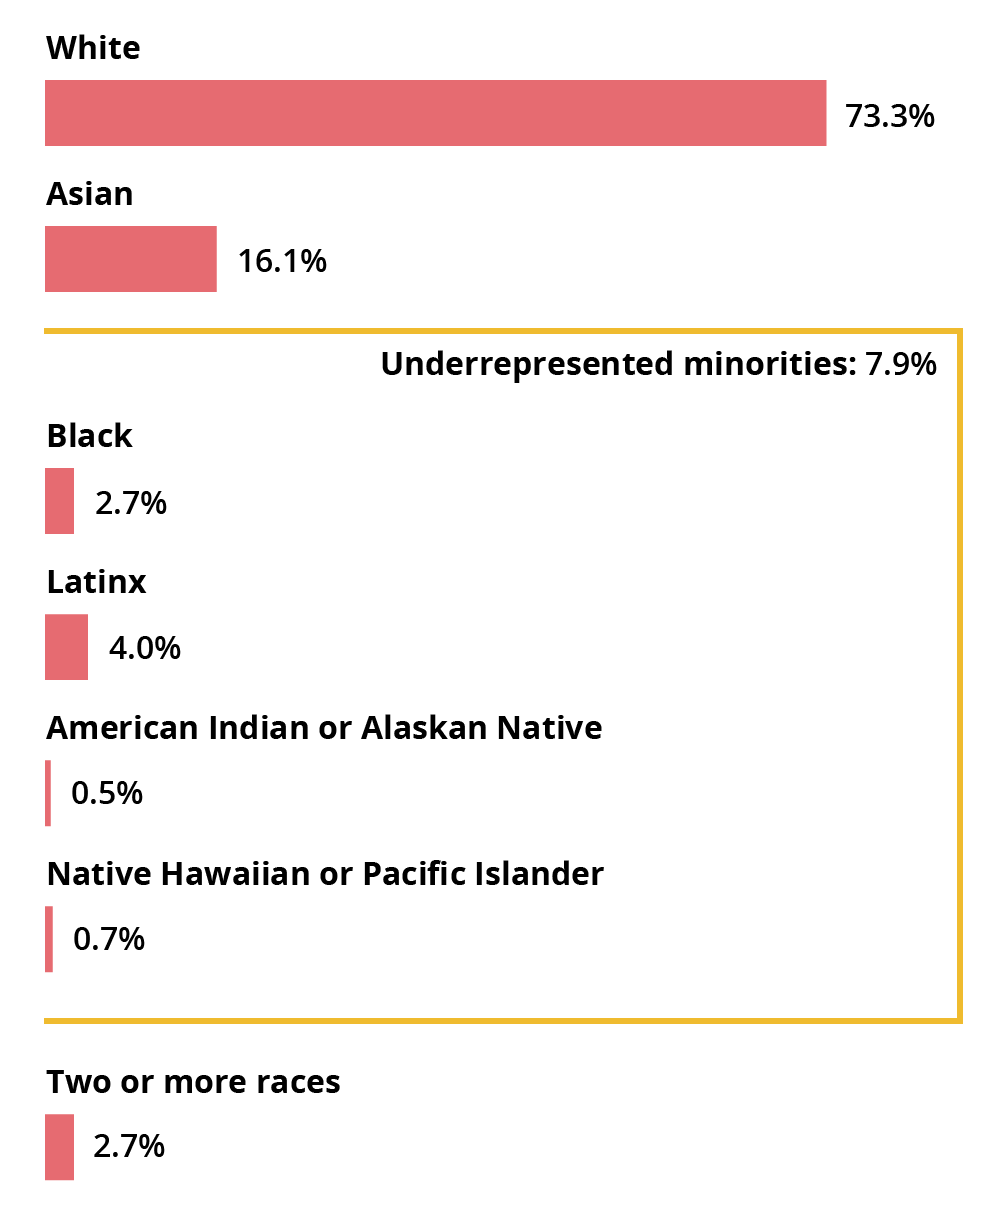
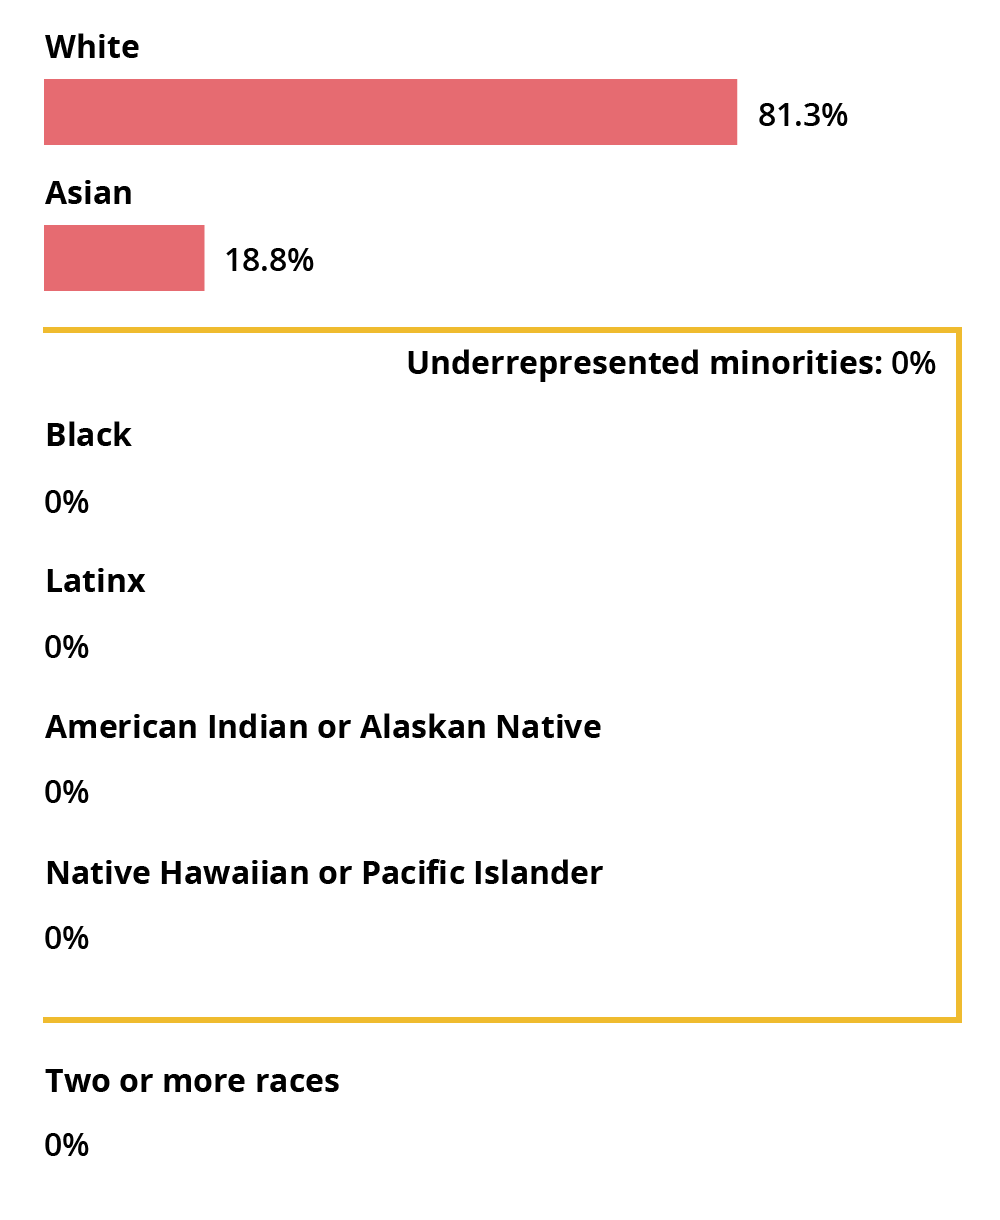
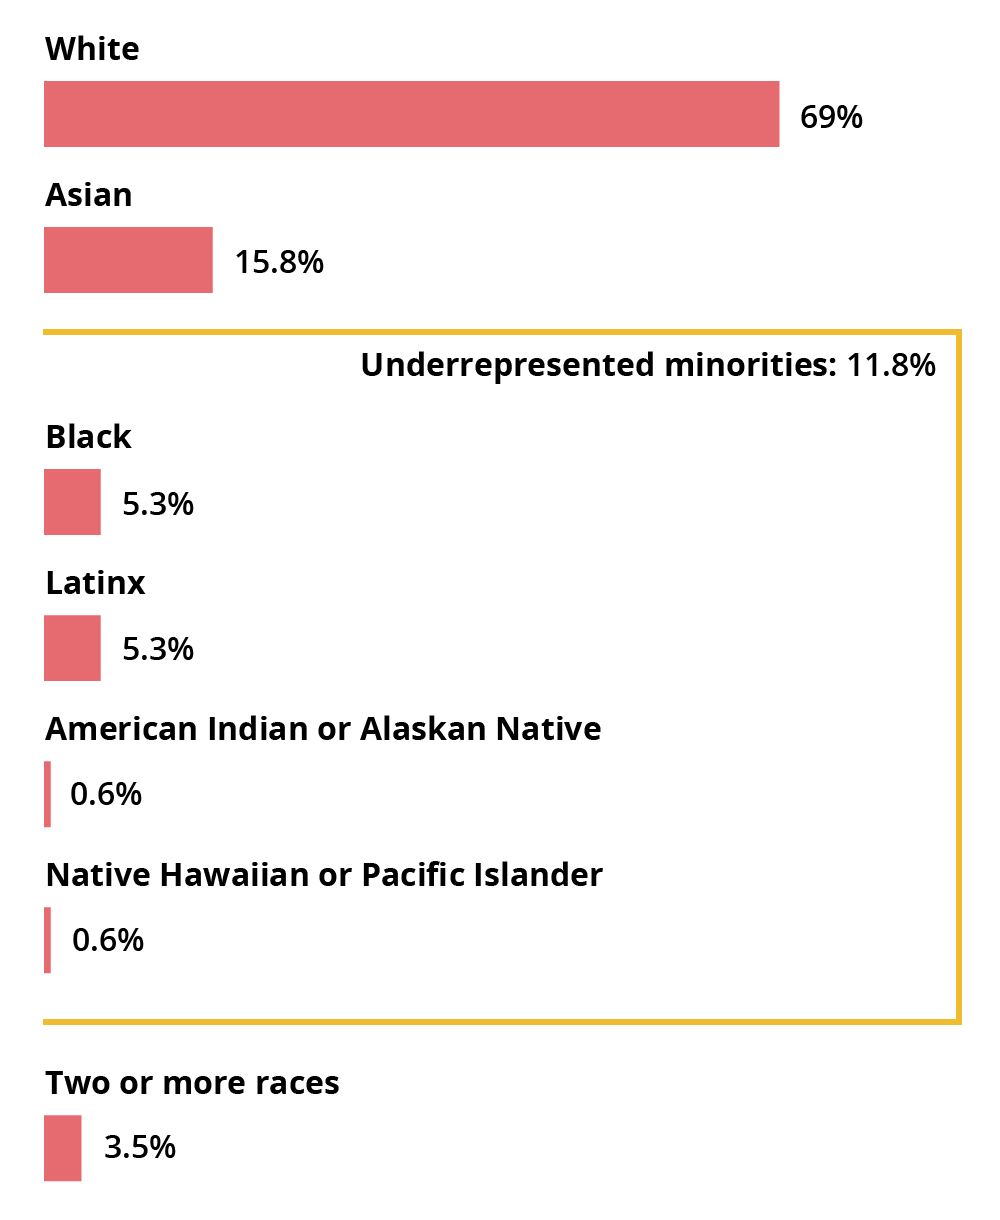
Last year, we set a goal of increasing representation of underrepresented minorities. We increased representation from 6.9% to 7.9% falling short of our goal of 8.9%. We continue to be committed to achieving increased representation.
12.4% of all people hired in 2018 were from underrepresented minority groups (flat from 2017), and 36.2% of all new employees are People of Color (up from 35.2%). We have increased the representation of Black Mozillians to 2.7% (up from 1.8%) and Latinx Mozillians to 4% (up from 3.9%) in 2018.
Mozilla Corporation Racial and Ethnic Diversity (US Only)

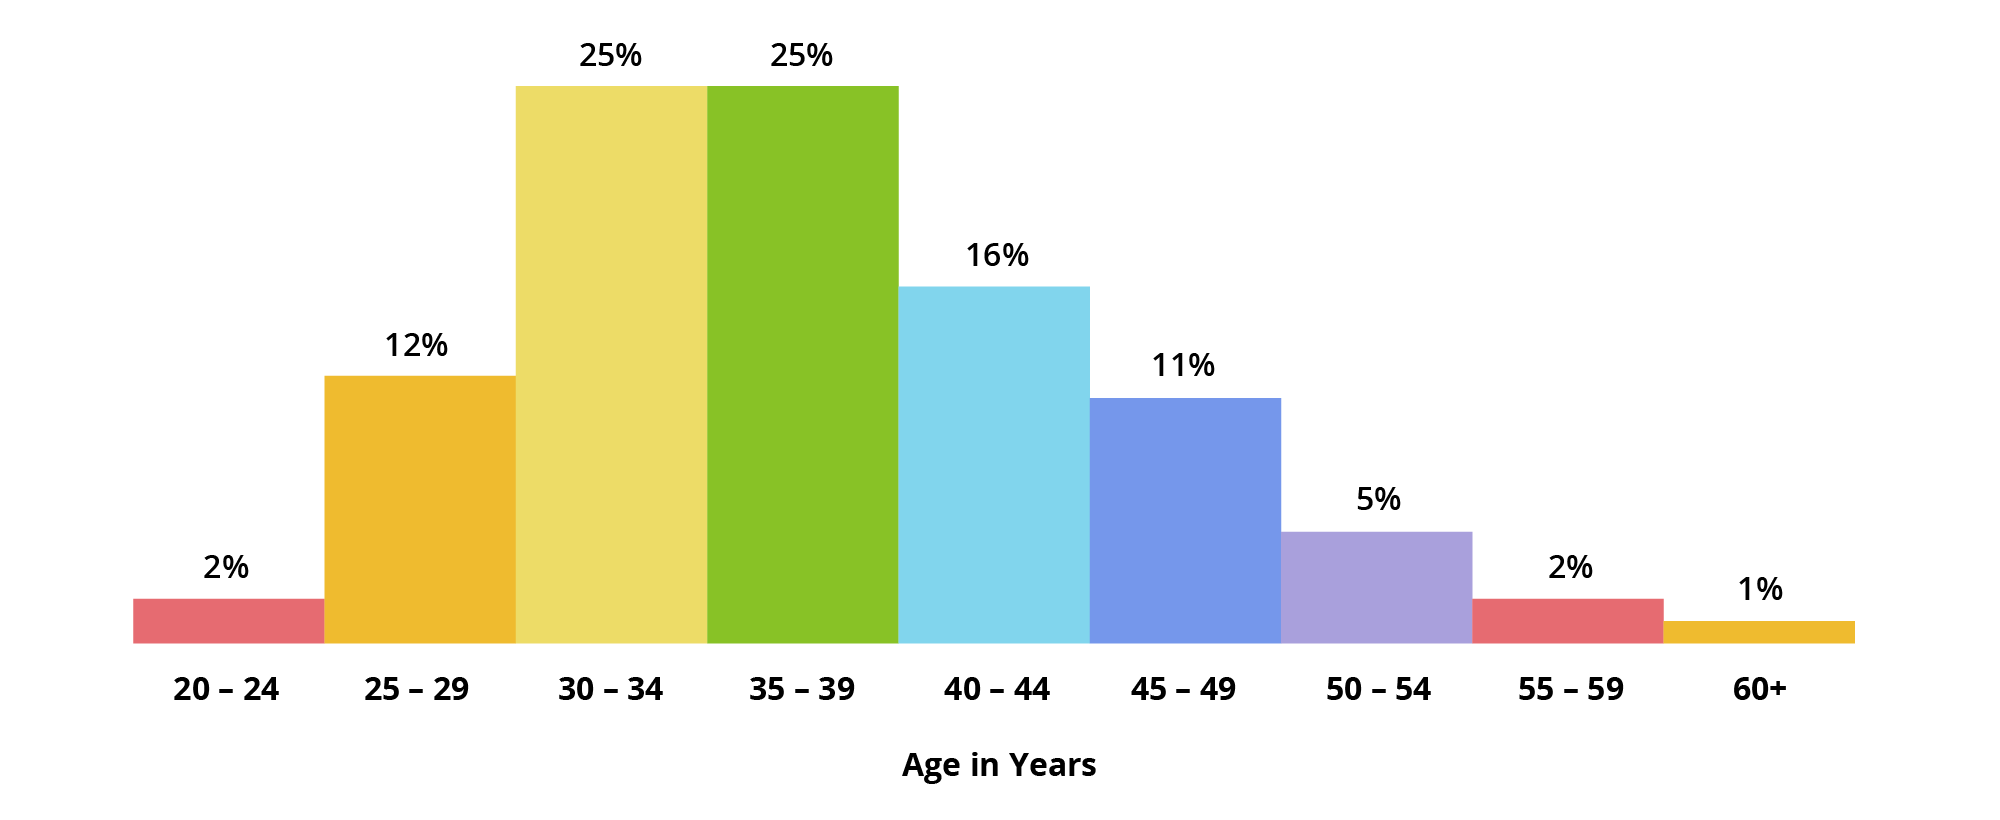
Mozilla Corporation Age Diversity (Global)
The median age of our employees is 37 (up from 36) and 35% of Mozillians are over the age of 40 (up from 34%).
Mozilla Corporation Age Diversity (Global)
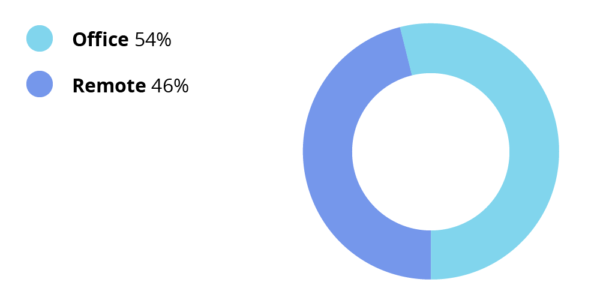
Mozilla Corporation Geography Diversity (Global)
46% of employees work remotely (up from 39%) from home offices and coworking spaces, rather than from one of our 10 global offices. 39% of our employees are based outside the United States in one of 14 other countries (down from 43%).
Mozilla Corporation Workforce Distribution (Global)
Building a more inclusive Mozilla
We aim to create a working environment where everyone can thrive and do their best work. In our 2018 employee engagement survey we focused on two key questions: “I would feel safe reporting harassment, bullying, or other inappropriate behavior if I felt the need,” and “Employees with a diversity of backgrounds, culture and experiences can be leaders at Mozilla.” The goal was to increase the affirmative scores above 80% on these questions and to narrow the gap between women’s and men’s experiences. While the overall scores increased, so too did the gaps between women’s and men’s experiences.
We know it is not enough to increase the representation of underrepresented groups at Mozilla. We also need to make sure that we have a work culture that accepts and values difference and a workplace where people can be their whole selves. That requires a variety of initiatives that support people in the multiple ways that make them who they are.
In 2018, to make Mozilla more inclusive internally, we:
- Completed a comprehensive pay equity study led by a third party firm we chose to ensure we had a completely objective analysis. This will be a standard process for us every year and if we find any issues we address them.
- Continued to debias the hiring process and ran inclusive hiring workshops quarterly.
- Ran our first round of Voice and Influence, a women’s leadership program, with 62 participants.
- Published gender transition guidelines and ran webinars on trans and non-binary inclusion.
- Participated in Outreachy, a program for underrepresented individuals to work in Free and Open Source Software. In 2018, we sponsored 27 participants.
- Stopped using the word meritocracy in our leadership and governance documents as it signals cultures where there is little effective restraint on perpetuating discrimination and buys into the myth that tech is a level playing field.
- Added four new topics to the Mozilla Manifesto including a commitment to an internet that includes all the peoples of the earth and an internet that catalyzes collaboration among diverse communities working together for the common good.
To support diversity and inclusion more broadly in our industry, we:
- Joined 55 other major companies in publicly affirming that the rights, identities and humanity of transgender, gender non-binary and intersex people deserve affirmation and respect.
- Hosted the XR Studio in San Francisco as a first-of-its-kind space for women and gender non-binary people to collaborate, learn and create projects with leading edge virtual reality, augmented reality, and artificial intelligence technologies.
- Partnered with Women Who Tech on the Women Startup Challenge Europe to diversify the startup ecosystem.
- Improved the diversity and inclusion of our grantmaking efforts through our MOSS program which recognizes, celebrates and supports open source projects that contribute to our work and to the health of the Internet.
- Sponsored 8 global events to promote opportunities in tech to diverse groups, including: European Women in Tech, Womxn of Color Leadership Forum, Tapia, Women of Silicon Roundabout, Women Transforming Technology, Girl Geek X Elevate, Tech Groove, Tech Superwomen Summit.
Methodology
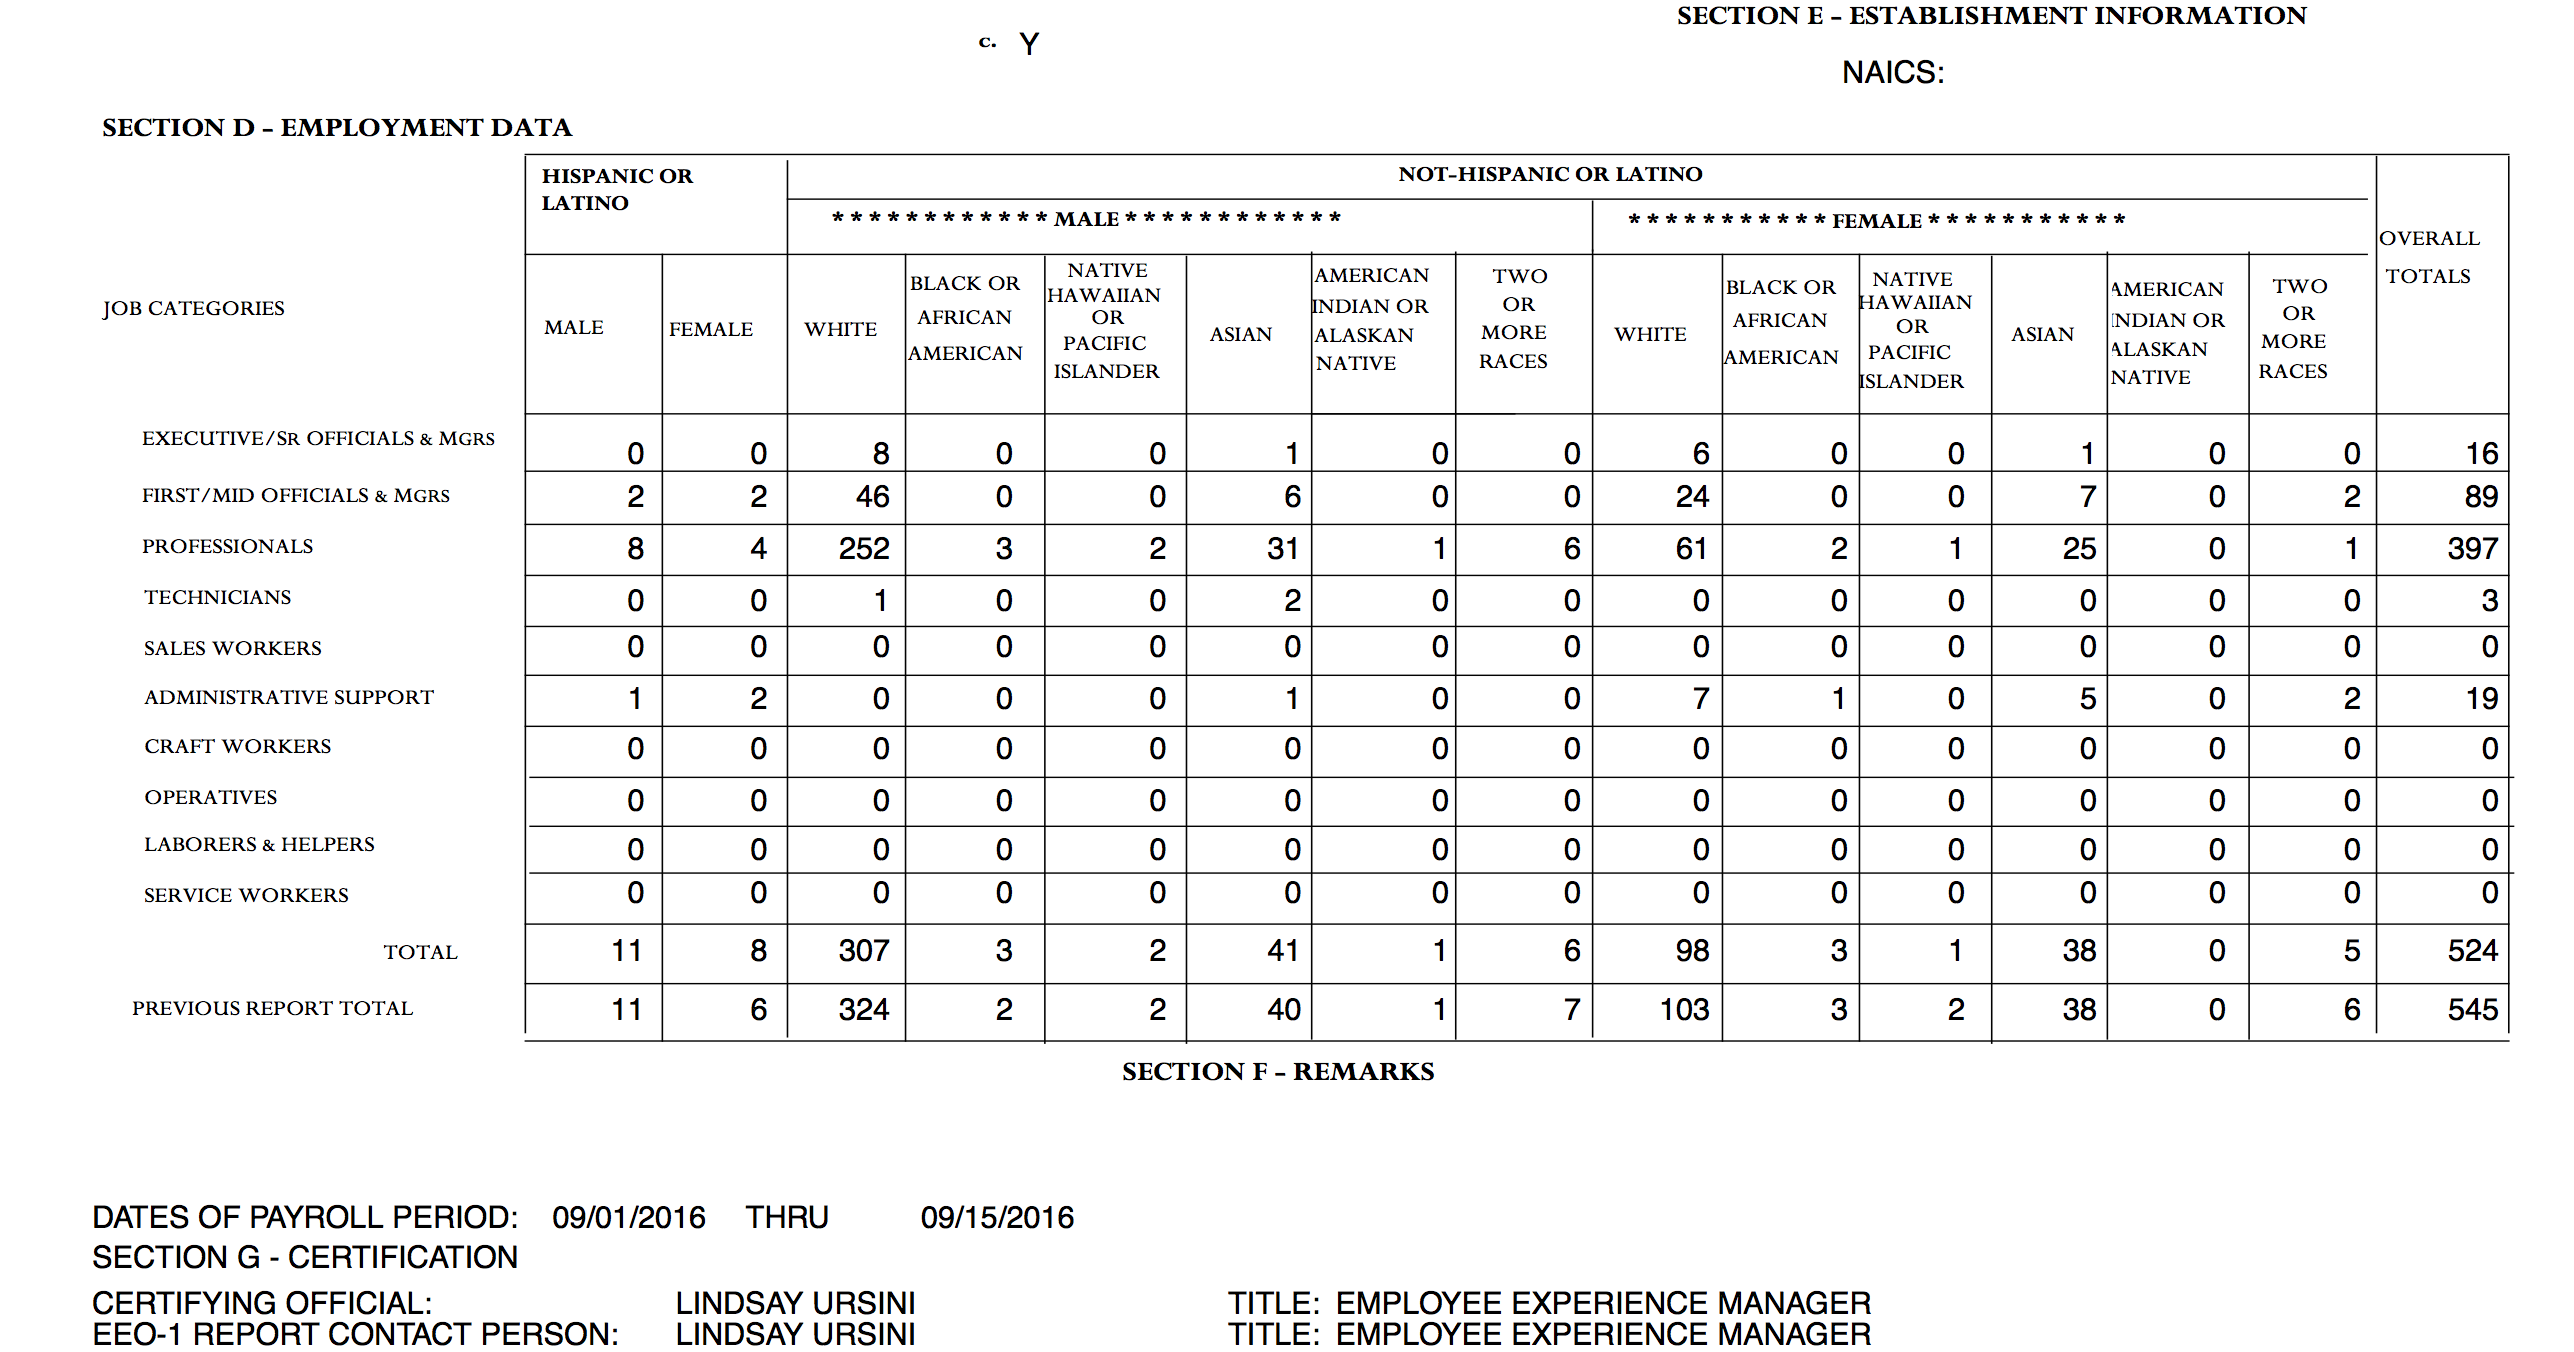
All diversity data are self-reported and come from Mozilla Corporation’s Human Resources Information System (HRIS) for regular employees as of December 31, 2018. Progress over 12 months is compared against December 31, 2017. Leadership representation is comprised of Vice Presidents and above, excluding executive-ranked technical fellows (which is 1 individual in 2018, a methodology change from 2017). Managers are any employees who manage others. Technical workers are defined using the AnitaB.org definitions. Currently less than 1% of Mozilla employees select “other gender identities.” We recognize that gender identities exist on a spectrum. At this time we do not track race and ethnicity outside of the US to comply with global laws. All race data are for US employees only, and categories are driven by US government requirements for disclosure. Employees who decline to provide demographic data are not included in the metrics provided. Mozilla Corporation has shared our EEO-1 form for US gender and race/ethnicity for three years as part of our State of Mozilla report; the 2018 form will be uploaded in April 2019.
Data
| Overall | Leadership | Tech | Non-Tech | |
|---|---|---|---|---|
| Men | 71.7% | 58.8% | 82.4% | 34.8% |
| Women | 28.3% | 41.2% | 17.4% | 65.2% |
| Other Gender Identities | 0.1% | 0 | 0.1% | 0 |
| Overall | Leadership | Tech | Non-Tech | |
|---|---|---|---|---|
| White | 73.3% | 81.3% | 75.1% | 69.0% |
| Asian | 16.1% | 18.8% | 16.2% | 15.8% |
| Black | 2.7% | 0 | 1.7% | 5.3% |
| Hispanic | 4.0% | 0 | 3.5% | 5.3% |
| American Indian or Alaskan Native |
0.5% | 0 | 0.5% | 0.6% |
| Native Hawaiian or Pacific Islander |
0.7% | 0 | 0.7% | 0.6% |
| Two or more races | 2.7% | 0 | 2.4% | 3.5% |
| Age in years | Overall |
|---|---|
| 20-24 | 2% |
| 25-29 | 12% |
| 30-34 | 25% |
| 35-39 | 25% |
| 40-44 | 16% |
| 45-49 | 11% |
| 50-54 | 5% |
| 55-59 | 2% |
| 60+ | 1% |
| Location | Overall |
|---|---|
| Office | 53.8% |
| Remote | 46.2% |