[Update: this post has been updated with significant new information. Look to the end.]
Activity Monitor is a tool in Mac OS X that shows a variety of real-time process measurements. It is well-known and its “Energy Impact” measure (which was added in Mac OS X 10.9) is often consulted by users to compare the power consumption of different programs. Apple support documentation specifically recommends it for troubleshooting battery life problems, as do countless articles on the web.
However, despite its prominence, the exact meaning of the “Energy Impact” measure is unclear. In this blog post I use a combination of code inspection, measurements, and educated guesses to hypothesize how it is computed in Mac OS X 10.9 and 10.10.
What is known about “Energy Impact”?
The following screenshot shows the Activity Monitor’s “Energy” tab.
 There are no units given for “Energy Impact” or “Avg Energy Impact”.
The Activity Monitor documentation says the following.
Energy Impact: A relative measure of the current energy consumption of the app. Lower numbers are better.
Avg Energy Impact: The average energy impact for the past 8 hours or since the Mac started up, whichever is shorter.
That is vague. Other Apple documentation says the following.
The Energy tab of Activity Monitor displays the Energy Impact of each open app based on a number of factors including CPU usage, network traffic, disk activity and more. The higher the number, the more impact an app has on battery power.
More detail, but still vague. Enough so that various other people have wondered what it means. The most precise description I have found says the following.
If my recollection of the developer presentation slide on App Nap is correct, they are an abstract unit Apple created to represent several factors related to energy usage meant to compare programs relatively.
I don’t believe you can directly relate them to one simple unit, because they are from an arbitrary formula of multiple factors.
[…] To get the units they look at CPU usage, interrupts, and wakeups… track those using counters and apply that to the energy column as a relative measure of an app.
This sounds plausible, and we will soon see that it appears to be close to the truth.
A detour: top
First, a necessary detour. top is a program that is similar to Activity Monitor, but it runs from the command-line. Like Activity Monitor, top performs periodic measurements of many different things, including several that are relevant to power consumption: CPU usage, wakeups, and a “power” measure. To see all these together, invoke it as follows.
top -stats pid,command,cpu,idlew,power -o power -d(A non-default invocation is necessary because the wakeups and power columns aren’t shown by default unless you have an extremely wide screen.)
It will show real-time data, updated once per second, like the following.
PID            COMMAND                  %CPU         IDLEW        POWER
50300          firefox                  12.9         278          26.6
76256          plugin-container         3.4          159          11.3
151            coreaudiod               0.9          68           4.3
76505          top                      1.5          1            1.6
76354          Activity Monitor         1.0          0            1.0
The PID, COMMAND and %CPU columns are self-explanatory.
The IDLEW column is the number of package idle exit wakeups. These occur when the processor package (containing the cores, GPU, caches, etc.) transitions from a low-power idle state to the active state. This happens when the OS schedules a process to run due to some kind of event. Common causes of wakeups include scheduled timers going off and blocked I/O system calls receiving data.
What about the POWER column? top is open source, so its meaning can be determined conclusively by reading the powerscore_insert_cell function in the source code. (The POWER measure was added to top in OS X 10.9.0 and the code has remain unchanged all the way through to OS X 10.10.2, which is the most recent version for which the code is available.)
The following is a summary of what the code does, and it’s easier to understand if the %CPU and POWER computations are shown side-by-side.
|elapsed_us| is the length of the sample period
|used_us| is the time this process was running during the sample period

  %CPU = (used_us * 100.0) / elapsed_us

  POWER = if is_a_kernel_process()
            0
          else
            ((used_us + IDLEW * 500) * 100.0) / elapsed_us
The %CPU computation is as expected.
The POWER computation is a function of CPU and IDLEW. It’s basically the same as %CPU but with a “tax” of 500 microseconds for each wakeup and an exception for kernel processes. The value of this function can easily exceed 100 — e.g. a program with zero CPU usage and 3,000 wakeups per second will have a POWER score of 150 — so it is not a percentage. In fact, POWER is a unitless measure because it is a semi-arbitrary combination of two measures with incompatible units.
Back to Activity Monitor and “Energy Impact”
MacBook Pro running Mac OS X 10.9.5
First, I did some measurements with a MacBook Pro with an i7-4960HQ processor running Mac OS X 10.9.5.
I did extensive testing with a range of programs: ones that trigger 100% CPU usage; ones that trigger controllable numbers of idle wakeups; ones that stress the memory system heavily; ones that perform frequent disk operations; and ones that perform frequent network operations.
In every case, Activity Monitor’s “Energy Impact” was the same as top‘s POWER measure. Every indication is that the two are computed identically on this machine.
For example, consider the data in the following table, The data was gathered with a small test program that fires a timer N times per second; other than extreme cases (see below) each timer firing causes an idle platform wakeup.
-----------------------------------------------------------------------------
Hz     CPU ms/s   Intr        Pkg Idle   Pkg Power  Act.Mon. top
-----------------------------------------------------------------------------
     2     0.14        2.00       1.80     2.30W     0.1    0.1
   100     4.52      100.13      95.14     3.29W       5      5
   500     9.26      499.66     483.87     3.50W      25     25
  1000    19.89     1000.15     978.77     5.23W      50     50
  5000    17.87     4993.10    4907.54    14.50W     240    240
 10000    32.63     9976.38    9194.70    17.61W     485    480
 20000    66.66    19970.95   17849.55    21.81W     910    910
 30000    99.62    28332.79   25899.13    23.89W    1300   1300
 40000   132.08    37255.47   33070.19    24.43W    1610   1650
 50000   160.79    46170.83   42665.61    27.31W    2100   2100
 60000   281.19    58871.47   32062.39    29.92W    1600   1650
 70000   276.43    67023.00   14782.03    31.86W     780    750
 80000   304.16    81624.60     258.22    35.72W      43     45
 90000   333.20    90100.26     153.13    37.93W      40     42
100000   363.94    98789.49      44.18    39.31W      38     38
The table shows a variety of measurements for this program for different values of N. Columns 2–5 are from powermetrics, and show CPU usage, interrupt frequency, and package idle wakeup frequency, respectively. Column 6 is Activity Monitor’s “Energy Impact”, and column 7 is top‘s POWER measurement. Column 6 and 7 (which are approximate measurements) are identical, modulo small variations due to the noisiness of these measurements.
MacBook Air running Mac OS X 10.10.4
I also tested a MacBook Air with an i5-4250U processor running Mac OS X 10.10.4. The results were substantially different.
-----------------------------------------------------------------------------
Hz     CPU ms/s   Intr        Pkg Idle   Pkg Power Act.Mon. top
-----------------------------------------------------------------------------
     2     0.21        2.00       2.00     0.63W   0.0     0.1
   100     6.75       99.29      96.69     0.81W   2.4     5.2
   500    22.52      499.40     475.04     1.15W   10       25
  1000    44.07      998.93     960.59     1.67W   21       48
  3000   109.71     3001.05    2917.54     3.80W   60      145
  5000    65.02     4996.13    4781.43     3.79W   90      230
  7500   107.53     7483.57    7083.90     4.31W   140     350
 10000   144.00     9981.25    9381.06     4.37W   190     460
The results from top are very similar to those from the other machine. But Activity Monitor’s “Energy Impact” no longer matches top‘s POWER measure. As a result it is much harder to say with confidence what “Energy Impact” represents on this machine. I tried tweaking the previous formula so that the idle wakeup “tax” drops from 500 microseconds to 180 or 200 microseconds and that gives results that appear to be in the ballpark but don’t match exactly. I’m a bit skeptical whether Activity Monitor is doing all its measurements at the same time or not. But it’s also quite possible that other inputs have been added to the function that computes “Energy Impact”.
What about “Avg Energy Impact”?
What about the “Avg Energy Impact”? It seems reasonable to assume it is computed in the same way as “Energy Impact”, but averaged over a longer period. In fact, we already know that period from the Apple documentation that says it is the “average energy impact for the past 8 hours or since the Mac started up, whichever is shorter.”
Indeed, when the Energy tab of Activity Monitor is first opened, the “Avg Energy Impact” column is empty and the title bar says “Activity Monitor (Processing…)”. After a few seconds the “Avg Energy Impact” column is populated with values and the title bar changes to “Activity Monitor (Applications in last 8 hours)”. If you have top open during those 5–10 seconds can you see that systemstats is running and using a lot of CPU, and so presumably the measurements are obtained from it.
systemstats is a program that runs all the time and periodically measures, among other things, CPU usage and idle wakeups for each running process (visible in the “Processes” section of its output.) I’ve done further tests that indicate that the “Avg Energy Impact” is almost certainly computed using the same formula as “Energy Impact”. The difference is that the the measurements are from the past 8 hours of wake time — i.e. if a laptop is closed for several hours and then reopened, those hours are not included in the calculation — as opposed to the 1, 2 or 5 seconds of wake time used for “Energy Impact”.
battery status menu
Even more prominent than Activity Monitor is OS X’s battery status menu. When you click on the battery icon in the OS X menu bar you get a drop-down menu which includes a list of “Apps Using Significant Energy”.
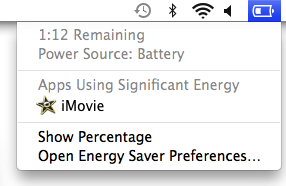
How is this determined? When you open this menu for the first time in a while it says “Collecting Power Usage Information” for a few seconds, and if you have top open during that time you see that, once again, systemstats is running and using a lot of CPU. Furthermore, if you click on an application name in the menu Activity Monitor will be opened and that application’s entry will be highlighted. Based on these facts it seems reasonable to assume that “Energy Impact” is again being used to determine which applications show up in the battery status menu.
I did some more tests (on my MacBook Pro running 10.9.5) and it appears that once an energy-intensive application is started it takes about 20 or 30 seconds for it to show up in the battery status menu. And once the application stops using high amounts of energy I’ve seen it take between 4 and 10 minutes to disappear. The exception is if the application is closed, in which case it disappears immediately.
Finally, I tried to determine the significance threshold. It appears that a program with an “Energy Impact” of roughly 20 or more will eventually show up as significant, and programs that have much higher “Energy Impact” values tend to show up more quickly.
All of these battery status menu observations are difficult to make reliably and so should be treated with caution. They may also be different in OS X 10.10. It is clear, however, that the window used by the battery status menu is measured in seconds or minutes, which is much less than the 8 hour window used for “Avg Energy Impact”.
An aside: systemstats is always running on OS X. The particular invocation used for the long-running instance — the one used by both Activity Monitor and the battery status menu — takes the undocumented --xpc flag. When I tried running it with that flag I got an error message saying “This mode should only be invoked by launchd”. So it’s hard to know how often it’s making measurements. The output from vanilla command-line invocations indicate it’s about every 10 minutes.
But it’s worth noting that systemstats has a -J option which causes the CPU usage and wakeups for child processes to be attributed to their parents. It seems likely that the --xpc option triggers the same behaviour because the Activity Monitor does not show “Avg Energy Impact” for child processes (as can be seen in the screenshot above for the login, bash and vim processes that are children of the Terminal process). This hypothesis also matches up with the battery status menu, which never shows child processes. One consequence of this is that if you ssh into a Mac and run a power-intensive program from the command line it will not show up in Activity Monitor’s energy tab or the battery status menu, because it’s not attributable to a top-level process such as Terminal! Such processes will show up in top and in Activity Monitor’s CPU tab, however.
How good a measure is “Energy Impact”?
We’ve now seen that “Energy Impact” is used widely throughout OS X. How good a measure is it?
The best way to measure power consumption is to actually measure power consumption. One way to do this is to use an ammeter, but this is difficult. Another way is to measure how long it takes for the battery to drain, which is easier but slow and requires steady workloads. Alternatively, recent Intel hardware provides high-quality estimates of processor and memory power consumption that are relatively easy to obtain.
These approaches all have the virtue of measuring or estimating actual power consumption (i.e. Watts). But the big problem is that they are machine-wide measures that cannot be used on a per-process basis. This is why Activity Monitor uses several proxy measures — ones that correlate with power consumption — which can be measured on a per-process basis. “Energy Impact” is a hybrid of at least two different proxy measures: CPU usage and wakeup frequency.
The main problem with this is that “Energy Impact” is an exaggerated measure. Look at the first table above, with data from the 10.9.5 machine. The variation in the “Pkg Power” column — which shows the package power from the above-mentioned Intel hardware estimates — is vastly smaller than the variation in the “Energy Impact” measurements. For example, going from 1,000 to 10,000 wakeups per second increases the package power by 3.4x, but the “Energy Impact” increases by 9.7x, and the skew gets even worse at higher wakeup frequencies. “Energy Impact” clearly weights wakeups too heavily. (In the second table, with data from the 10.10.4 machine, the weight given to wakeups is less, but still too high.)
Also, in the first table “Energy Impact” actually decreases when the timer frequency gets high enough. Presumably this is because the timer interval is so short that the OS has trouble putting the package into a idle power state. This leads to the absurd result that firing a timer at 1,000 Hz has about the same “Energy Impact” value as firing one at 100,000 Hz, when the package power of the latter is about 7.5x higher.
Having said all that, it’s understandable why Apple uses formulations of this kind for “Energy Impact”.
- CPU usage and wakeup frequency are probably the two most important factors affecting a process’s power consumption, and they are factors that can be measured on a per-process basis.
- Having a single measure makes things easy for users; evaluating the relative important of multiple measures is more difficult.
- The exception for kernel processes (which always have an “Energy Impact” of 0) avoids OS X itself being blamed for high power consumption. This makes a certain amount of sense — it’s not like users can close the kernel — while also being somewhat misleading.
If I were in charge of Apple’s Activity Monitor product, I’d do two things.
- I would compute a new formula for “Energy Impact”. I would measure the CPU usage, wakeup frequency (and any other inputs) and actual power consumption for a range of real-world programs, on a range of different Apple machines. From this data, hopefully a reasonably accurate model could be constructed. It wouldn’t be perfect, and it wouldn’t need to be perfect, but it should be possible to come up with something that reflects actual power consumption better than the existing formulations. Once formulated, I would then test the new version against synthetic microbenchmarks, like the ones I used above, to see how it holds up. Given the choice between accurately modelling real-world applications and accurately modelling synthetic microbenchmarks, I would definitely favour the former.
- I would publicly document the formula that is used so that developers can actually tell how their applications are being evaluated, and can optimize for that measure. You may think “but then developers will be optimizing for a synthetic measure rather than a real one” and you’d be right. That’s an inevitable consequence of giving a synthetic measure such prominence, and all the more reason for improving it.
Conclusion
“Energy Impact” is a flawed measure of an application’s power consumption. Nonetheless, it’s what many people use at this moment to evaluate the power consumption of OS X applications, so it’s worth understanding. And if you are an OS X application developer who wants to reduce the “Energy Impact” of your application, it’s clear that it’s best to focus first on reducing wakeup frequency, and then on reducing CPU usage.
Because Activity Monitor is closed source code I don’t know if I’ve characterized “Energy Impact” exactly correctly. The evidence given above indicates that I am close on 10.9.5, but not as close on 10.10.4. I’d love to hear if anybody has evidence that either corroborates or contradicts the conclusions I’ve made here. Thank you.
Update
A commenter named comex has done some great detective work and found on 10.10 and 10.11 Activity Monitor consults a Mac model-specific file in the /usr/share/pmenergy/ directory. (Thank you, comex.)
For example, my MacBook Air has a model number 7DF21CB3ED6977E5 and the file Mac-7DF21CB3ED6977E5.plist has the following list of key/value pairs under the heading “energy_constants”.
kcpu_time               1.0
kcpu_wakeups            2.0e-4
This matches the previously seen formula, but with the wakeups “tax” being 200 microseconds, which matches what I hypothesized above.
kqos_default            1.0e+00
kqos_background         5.2e-01
kqos_utility            1.0e+00
kqos_legacy             1.0e+00
kqos_user_initiated     1.0e+00
kqos_user_interactive   1.0e+00
“QoS” refers to quality of service classes which allow an application to mark some of its own work as lower priority. I’m not sure exactly how this is factored in, but from the numbers above it appears that operations done in the lowest-priority “background” class is considered to have an energy impact of about half that done in all the other classes.
kdiskio_bytesread       0.0
kdiskio_byteswritten    5.3e-10
These ones are straightforward. Note that the “tax” for disk reads is zero, and for disk writes it’s a very small number. I wrote a small program that wrote endlessly to disk and saw that the “Energy Impact” was slightly higher than the CPU percentage alone, which matches expectations.
kgpu_time 3.0e+00
It makes sense that GPU usage is included in the formula. It’s not clear if this refers to the integrated GPU or the separate (higher performance, higher power) GPU. It’s also interesting that the weighting is 3x.
knetwork_recv_bytes     0.0
knetwork_recv_packets   4.0e-6
knetwork_sent_bytes     0.0
knetwork_sent_packets   4.0e-6
These are also straightforward. In this case, the number of bytes sent is ignored, and only the number of packets matter, and the cost of reading and writing packets is considered equal.
So, in conclusion, on 10.10 and 10.11, the formula used to compute “Energy Impact” is machine model-specific, and includes the following factors: CPU usage, wakeup frequency, quality of service class usage, and disk, GPU, and network activity.
This is definitely an improvement over the formula used in 10.9, which is great to see. The parameters are also visible, if you know where to look! It would be wonderful if all these inputs, along with their relative weightings, could be seen at once in Activity Monitor. That way developers would have a much better sense of exactly how their application’s “Energy Impact” is determined.
12 replies on “What does the OS X Activity Monitor’s “Energy Impact” actually measure?”
Activity Monitor has been part of OS X since well before 10.9. The oldest system I have on hand to check is 10.7, but I’m pretty sure it goes back much further.
Yes. I fixed it. Thank you for the correction.
Activity Monitor has existed long before 10.9. Do you maybe mean the Energy component of Activity Monitor was introduced in 10.9?
Yes. I fixed it. Thank you for the correction.
Activity Monitor has been part of OS X since OS X 10.3; that was 12 years ago. I think you maybe meant to say that the Energy Impact tab has been part of Activity Monitor since OS X 10.9?
Yes. I fixed it. Thank you for the correction.
Instead of all this speculation, why didn’t you just disassemble the Activity Monitor application and see which API/system call it makes? I imagine that would prove conclusively that it does in fact just use the same result as provided by top.
> There are no units given for “Energy Impact” or “Avg Energy Impact”.
Since it’s a relative measure it has not units per se.
hi, have you consider the GPU also make some power consumption.
When I using Firefox to visit weibo.com on a mac, the CPU and GPU frequency goes high,and power consumption are much different.
I spent a bit of time disassembling the relevant functionality on OS X 10.11 (15A263e). It goes like this: Activity Monitor <- libsysmon.dylib <- sysmond <- libpmenergy.dylib, which reads plist files in /usr/share/pmenergy/. The files are named based on the "board-id" from IOKit (which you can find by running ioreg -l and searching for board-id), and appear to contain coefficients for how various system stats contribute to the energy impact figure. For example:
energy_constants
kcpu_time
1.0
kcpu_wakeups
2.0e-4
kqos_default
1.0
kqos_background
8.0e-01
kqos_utility
1.0
kqos_legacy
1.0
kqos_user_initiated
1.0
kqos_user_interactive
1.0
kdiskio_bytesread
4.5e-10
kdiskio_byteswritten
2.4e-10
kgpu_time
0.0
knetwork_recv_bytes
0.0
knetwork_recv_packets
4.0e-6
knetwork_sent_bytes
0.0
knetwork_sent_packets
4.0e-6
Nice find! I checked and /usr/share/pmenergy does not exist on my 10.9.5 machine, but it does exist on the 10.10.4 machine.
The 2.0e-4 value (which is the same on my 10.10.4 machine) for kcpu_wakeups matches the 200 microseconds possibility I mentioned. Looks like there is a bunch more factors being taken into account, though. I wonder how exactly the qos values are incorporated.
Thank you for the info.
I’ve updated the post to incorporate your discovery. Thank you again.