TL;DR: The Rust compiler has gotten 1.06x–4x faster over the past month.
As changes are made to the Rust compiler, a suite of benchmarks measuring compile time is run regularly on the development version. The data is viewable at http://perf.rust-lang.org. The default view is graphical, showing data from the past month.
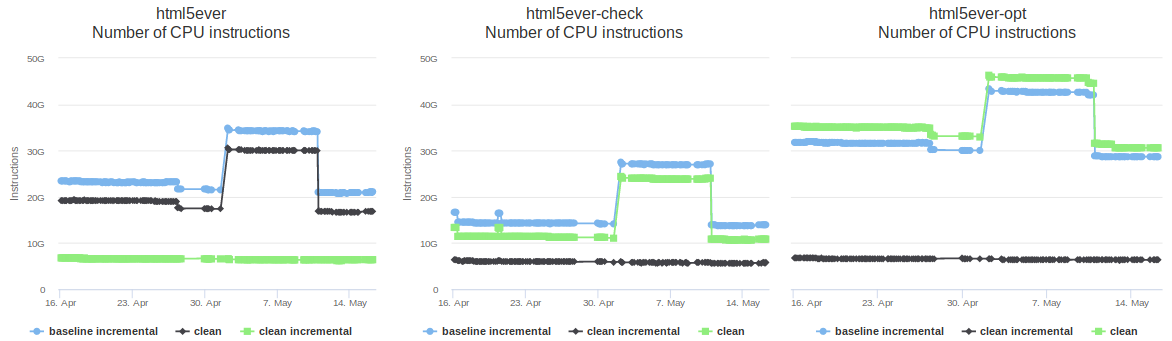
The screenshot above shows the graphs for a single benchmark called “html5ever”, which consists of an old version of the project of the same name. Each one shows measurements for a different kind of build: a debug build, a “check” build (which detect errors but don’t generate code), and an optimized build. Within each graph there are the following three data series.
- Clean: a normal build.
- Baseline incremental: an incremental build with no prior incremental runs. Such a build is a little slower than a normal build, because it does normal compilation and also gathers information to guide subsequent incremental builds.
- Clean incremental: an incremental build run immediately after a baseline incremental build. This is the best-case scenario for incremental compilation in which the minimal amount of work is done.
If you visit the site yourself you’ll see that most of the benchmarks have more than three data series, including ones for incremental builds done after small code changes (a more realistic use case), and one for builds with non-lexical lifetimes enabled.
The x-axis shows time and the y-axis shows instruction counts. Other units of measurements are available, including cycles, time, and memory usage. Instruction counts are shown as the default; this isn’t ideal because it’s only a proxy for the measurement that really matters (time)… but it’s a pretty good proxy, and it has a lot lower variation than the time measurements, which is important when detecting changes.
This graphical view is particularly useful for detecting major changes. For example, you can see that in early May there was a major regression for “clean” and “baseline incremental” builds, which Alex Crichton fixed a few days later.
As well as the graphical view, the site also provides a textual “compare” view, which can be reached via the link at the top left of each page. This view compares measurements from two revisions of the compiler; by default it compares the most recently measured revision with one from a month ago. (It can also be used locally, which is very useful to evaluate changes that speed up the compiler.)
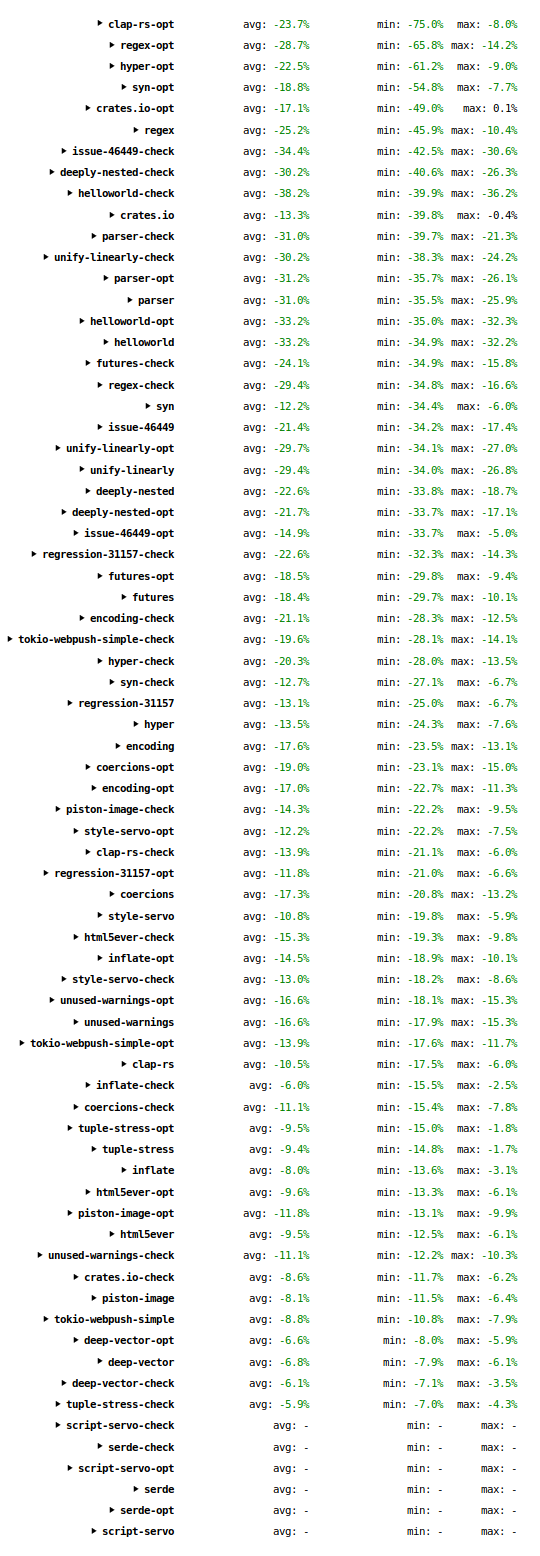
The screenshot above is of the “compare” view at the time of writing. Each line corresponds to a single graph from the graphical view. (If you visit the site and click on an individual entry it will expand and show all of the measurements. The resemblance between those measurements and this screenshot will of course diminish over time.) The “avg” column shows the average change across all the data series. The “min” and “max” columns show the minimum and maximum changes for any of the data series. The “serde” and “script-servo” lines are empty because those benchmarks were added to the suite less than a month ago, so no comparison can be made.
The table has many numbers, but the thing to take away is that they are almost all significantly negative, meaning that compile time has reduced. The “avg” numbers range from 6% to 38%; the “min” numbers (i.e. best result) go as high as 75%; the “max” numbers (i.e. worst result) go as high as 36%.
In conclusion: the Rust compiler has gotten significantly faster in the past month. Across a wide range of programs, and a wide range of build configurations, compile times have reduced by between 6% and 75%. To put it another way, the compiler has gotten between 1.06x and 4x faster.
These benefits are available right now to users of the Nightly channel. Users of the Release channel will see them more gradually, spread across one or two versions released over the next few months.