IMAGES
The big news this week is that Timothy Nikkel finished bug 689623, which causes us to (for the most part) only decode images that are visible or nearly visible. This goes a long way towards fixing our problems with decoded images which happens to be the #1 item on the MemShrink big ticket items list. The fixing of this bug also happened to fix the following bugs in passing: 661304, 682230.
To give you an idea of what changed, consider an image-heavy page like this one. Prior to Timothy’s change, shortly after loading that page on my machine Firefox’s memory consumption would reach 3 GiB, with 2.7 GiB of that being decoded (uncompressed) images. If I switched to another tab then 2.45 GiB of those decoded images would be immediately discarded, then after 10–20 seconds the remaining 250 MiB would be. If I switched back, all the images would immediately be decoded again and memory consumption would climb back to 3 GiB.
After Timothy’s change, Firefox’s memory consumption still peaks around 2.8 GiB just after loading the page, but then quickly drops back to 600 MiB as many of those decoded images are discarded. After that, even when scrolling quickly through the page I couldn’t get memory consumption to exceed 700 MiB.
This change will make such pages much smoother on desktop machines that don’t have lots of RAM, because there won’t be any paging, which slows things down drastically. Andrew McCreight wrote a comment that I can’t find now, but basically he said that on one of his machines, that page was extremely slow and painful to scroll through before the change, and after the change it was smooth and pleasant.
The peak that occurs when an image-heavy page first loads is still undesirable, and bug 542158 is open for fixing that, and it will build on the infrastructure that Timothy has developed. When that’s fixed, it’ll also greatly reduce the likelihood that an image-heavy page will cause an out-of-memory (OOM) crash, which is great for both desktop (esp. 32-bit Windows) and mobile/B2G.
Miscellaneous
Nicolas Pierron fixed a leak in IonMonkey that was causing runaway memory consumption for Shumway demos on Android. It has been backported to the Aurora and Beta channels.
I greatly reduced the size of the property cache. This is a data structure the JS engine uses to speed up property accesses. It used to be important, but is now barely necessary thanks to type inference and the JITs. This reduced memory consumption by 75 KiB per JSRuntime on 32-bit, and by 150 KiB per JSRuntime on 64-bit. There is one JSRuntime for each process, plus one for each worker, so for B2G it saves around 525 KiB at start-up.
We declared victory in the bug tracking the memory consumption of not-yet-loaded tabs. When the bug was opened it was over 1 MiB per tab (64-bit builds), it’s now around 200 KiB. Furthermore, if someone has many (e.g. hundreds) of not-yet-restored tabs they’re probably on a high-end machine, so the motivation for further reducing the memory consumption is low. There is a bug open about some scripts run for each of these tabs, however; avoiding these scripts may make start-up faster for heavy tab users.
Marco Bonardo reduced the maximum size of the cache used by each SQLite connection (excluding places.sqlite) from 4 MiB to 2 MiB. Update: Marco corrected me in the comments — there are four places.sqlite connections, but only one of them (the one for the awesome bar) is excluded from the new 2 MiB limit.
Somebody fixed a leak in the Roboform add-on. The fix is present in v7.8.7.5.
Olli Pettay improved our memory reporting by adding extra information to some system compartments that previously were undistinguished. Our experience has been that as soon as somebody adds a new memory measurement, it finds a problem, and this was no exception, leading to the filing of bug 844661 .
Jonathan Kew has been busy.
I wrote a script that can take a diff of two JSON memory report dumps. This will be very useful when comparing the memory consumption before and after doing something, for example. If you didn’t know that JSON memory report dumps existed, you’re probably not alone — it’s an undocumented feature that’s currently only available on Linux and Android, and is triggered by sending signal 34 to the browser(!) These dumps can be loaded by about:memory (see the buttons at the bottom) but there’s currently no easy way to trigger them, which is why today I filed a bug to make it easier.
I removed the pool used for recycling nsNodeInfo objects, which was causing them to never be released back to the OS. Never-shrinking structures like this can become a problem in longer-running browser sessions — for example, after running MemBench, which opens and closes 150 tabs, this pool was unnecessarily hoarding 4 MiB.
INteresting Open Bugs
In my MemShrink reports I mostly write about bugs that have been fixed. While this is satisfying and demonstrates progress, it might also give the impression that the MemShrink team has everything under control, when really we could use some help.
(In fact, the term “the MemShrink team” is something of a misnomer since there isn’t any such entity, officially. “The people who regularly attend MemShrink meetings” would be a more accurate term. But I’ll use “MemShrink team” as a short-hand for that.)
The MemShrink team has expertise in some areas of Mozilla code, such as DOM, cycle collector, JS engine (partial), Fennec, B2G, and memory profiling, and we tend to make good progress in those areas — we can fix bugs in those areas, and we generally pay attention to how these areas affect memory consumption.
But we lack expertise in areas like graphics, image-handling, layout, text rendering, storage, Jetpack/add-ons, and front-end. Graphics is a particular problem, because graphics issues, esp. those involving drivers, can cause huge memory consumption blow-ups. Bug 837542 is an example from the MemShrink:P1 list where gradients are somehow causing memory consumption to spike by 10s or even 100s of MiBs just by opening and closing a few tabs! We triage bugs like that as well as we can, but often we’re just guessing, and we’re mostly helpless to address such problems.
Therefore, moving forwards I’m going to start mentioning interesting open bugs that don’t have someone working on them.
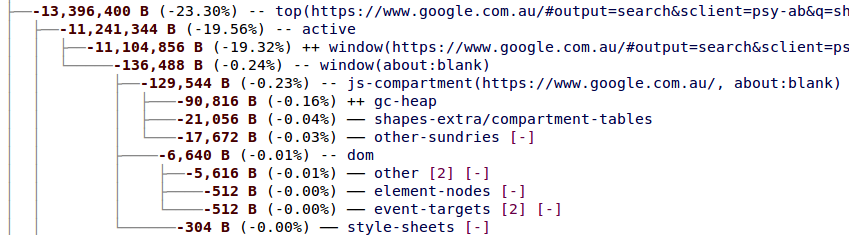
One example is bug 846173, which I filed when I noticed that fully loading the front page of TechCrunch takes over 100 MiB! And it’s mostly because of the many Facebook “like” buttons, Google “+1” buttons, and Twitter “tweet this” buttons — see the about:memory output for the full gory details. It’s obvious that most of these window objects are basically identical, except for the URL. Could we do something clever to avoid all this duplication? Justin Lebar wondered about a copy-on-write scheme. Are there other ways we could improve this case?
Another example is bug 842003, which is looking for an owner. Some basic leak-checking infrastructure in the IPC code could potentially detect some big problems for B2G.
In bug 842979 we’re seeing 10s or 100s of MiBs of orphan DOM nodes in long-running Gmail sessions. It’s not clear if this is a bug in Gmail, or caused by add-ons, or something else. Please comment in the bug if you have any additional data.
Another one: DMD, which is one of our most important tools, is pretty much useless on Fennec because it can’t get stack traces. If anyone who knows about such things would like to investigate, that would be very helpful. (In fact, I got a crash in the stack tracing code when I most recently tried to run DMD on Mac, which I haven’t had time to investigate.)
Bug Counts
Here are the current bug counts.
- P1: 12 (-6/+1)
- P2: 128 (-7/+7)
- P3: 122 (-0/+5)
- Unprioritized: 6 (-2/+6)
The closed P1s were 661304, 689623, 837187, 841976, 841993, 842756. Three of them related to an IPC leak fix that I mentioned in my last report.