We use Graphite to see how the Firefox Marketplace and Add-ons sites are doing. But the sheer volume of traffic to Add-ons always gives some interesting graphs.
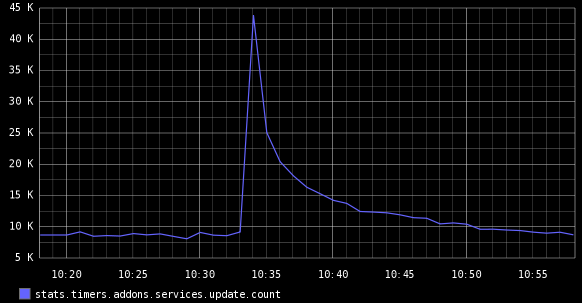
A while back we were switching between different clusters for add-on version check as the hardware behind it changed. As we switched clusters, we also switched from a hot cache to a cold cache. This resulted in a spike in traffic:
That’s almost 45,000 requests per second coming into version check and being processed by Python and MySQL. With hardly a blip on the hardware loads, we processed that quickly. We can see the affect as the cache picked up the slack, it falls down to the usual 8,000 requests per second. Crazy traffic.
We get a large number of requests to version check for a small number of add-ons. Like Adblock Plus which, as of writing this post, has over 15 million users. That’s pretty awesome.
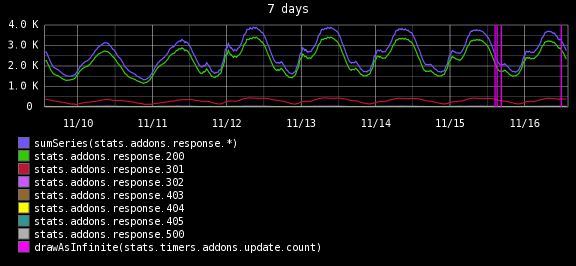
Looking at the traffic to Add-ons site (excluding version checks), traffic is very consistent depending upon the time of day.
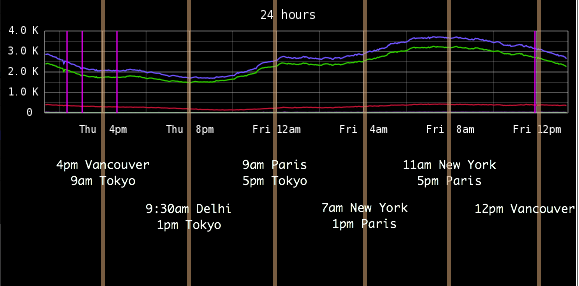
So when are those times? Here’s a graph of today’s traffic that I’ve annotated.
Our low point is as India wakes up. It goes up as Europe starts to wake up and then the east coast of the US. It hits its peak at about 11am on the east coast and then as Europe and the east coast goes of line traffic starts to fall.
There’s no real surprise there and data is backed up by looking at our internal metrics that show after the United States, the biggest traffic for Add-ons comes from Germany, Russia, France in that order. But it’s always nice to be reminded of the global reach of Mozilla.


