New Tool for Debugging WebRTC
Debugging WebRTC? Ever wanted a bit more visibility into the flow of a WebRTC call? Or see exactly what PeerConnection API calls were made and when? Have we got a debugging deal (dev tools plugin) for you! Go here or search for “dev tools media panel” on about:addons.
Getting Started
After loading the plugin and starting a call on, for example, appear.in, open the dev tools (Tools -> Web Developer -> Toggle Tools). Next, click on the “Media-Webrtc” pane. The “Media-Webrtc” pane is most likely at the far right. Finally, selecting the Webrtc tab shows something like: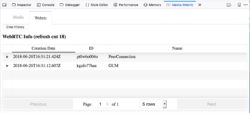
Expanding the PeerConnection element shows live updates on bytes/packets transmitted and received for RTP and RTCP streams as well as a list of API calls (including arguments) and a list of ice candidates, also with live updates on incoming and outgoing bytes.
Details
Expanding the API info section, you’ll see a list of API calls like this: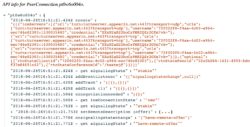
You can even expand some of the api calls for details. Of particular note, expanding setRemoteDescription or setLocalDescription calls shows the raw SDP received.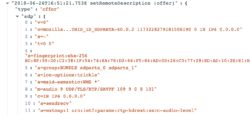
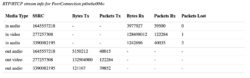
And finally, the following two example screenshots show the ICE candidates and RTP/RTCP data available. The received and transmitted bytes counters update automatically:
The code for the add-on is hosted on GitHub here. Lastly, we welcome Pull Requests! 🙂