One of the successes for Firefox Telemetry has been the introduction of standardized data types; histograms and scalars.
They are well defined and allow teams to autonomously add new instrumentation. As they are listed in machine-readable files, our data pipeline can support them automatically and new probes just start showing up in different tools. A definition like this enables views like this:
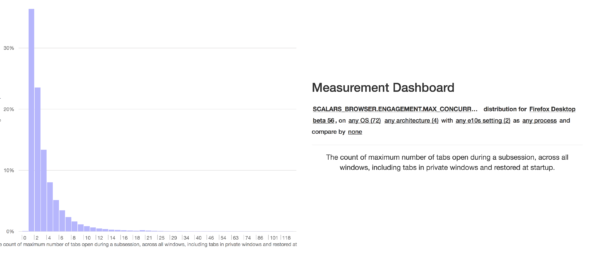
The distribution view for the max_concurrent_tabs scalar on the TMO dashboard.
This works great when shipping probes in the Firefox core code, going through our normal release and testing channels, which takes a few weeks.
Going faster
However, often we want to ship code faster using add-ons: this may mean running experiments through Test Pilot and SHIELD or deploying Firefox features through system add-ons.
When adding new instrumentation in add-ons, there are two options:
- Instrumenting the code in Firefox core code, then waiting a few weeks until it is in release.
- Implementing a custom ping and submitting it through Telemetry, requiring additional client and pipeline work.
Neither are satisfactory; there is significant manual effort for running simple experiments and adding features.
Filling the gap
This is one of the main pain-points coming up for adding new data collection, so over the last months we were planning how to solve this.
As the scope of an end-to-end solution is rather large, we are currently focused on getting the support built into Firefox first. This can enable some use-cases right away. We can then later add better and automated integration in our data pipeline and tooling.
The basic idea is to use the existing Telemetry APIs and seamlessly allow them to record data from new probes as well. To enable this, we will extend the API with registration of new probes from add-ons at runtime.
The recorded data will be submitted with the main ping, but in a separate bucket to tell them apart.
What we have now
We now support add-on registration of events from Firefox 56 on. We expect event recording to mostly be used with experiments, so it made sense to start here.
With this new addition, events can be registered at runtime by Mozilla add-ons instead of using a registry file like Events.yaml.
When starting, add-ons call nsITelemetry.registerEvents() with information on the events they want to record:
Services.telemetry.registerEvents(“myAddon.ui”, {
  “click”: {
    methods: [“click”],
    objects: [“redButton”, “blueButton”],
  }
});
Now, events can be recorded using the normal Telemetry API:
Services.telemetry.recordEvent(“myAddon.ui”, “click”,
                               “redButton”);
This event will be submitted with the next main ping in the “dynamic” process section. We can inspect them through about:telemetry:
![The event view in about:telemetry, showing that an event ["myAddon.ui", "click", "redButton"] was successfully recorded with a timestamp.](https://blog.mozilla.org/data/files/2017/09/Screen-Shot-2017-09-07-at-20.45.34-600x134.png)
The event view in about:telemetry.
On the pipeline side, the events are available in the events table in Redash. Custom analysis can access them in the main pings under payload/processes/dynamic/events.
The larger plan
As mentioned, this is the first step of a larger project that consists of multiple high-level pieces. Not all of them are feasible in the short-term, so we intend to work towards them iteratively.
The main driving goals here are:
- Make it easy to submit new Telemetry probes from Mozilla add-ons.
- New Telemetry probes from add-ons are easily accessible, with minimal manual work.
- Uphold our standards for data quality and data review.
- Add-on probes should be discoverable from one central place.
This larger project then breaks down into roughly these main pieces:
Phase 1: Client work.
This is currently happening in Q3 & Q4 2017. We are focusing on adding & extending Firefox Telemetry APIs to register & record new probes.
Events are supported in Firefox 56, scalars will follow in 57 or 58, then histograms on a later train. The add-on probe data is sent out with the main ping.
Phase 2: Add-on tooling work.
To enable pipeline automation and data documentation, we want to define a variant of the standard registry formats (like Scalars.yaml). By providing utilities we can make it easier for add-on authors to integrate them.
Phase 3: Pipeline work.
We want to pull the probe registry information from add-ons together in one place, then make it available publically. This will enable automation of data jobs, data discovery and other use-cases. From there we can work on integrating this data into our main datasets and tools.
The later phases are not set in stone yet, so please reach out if you see gaps or overlap with other projects.
Questions?
As always, if you want to reach out or have questions:
- You can find us on IRC in #telemetry and #datapipeline.
- We are available on slack in #fx-metrics.
- The main mailing list for data topics is fx-data-dev.
- Bugs can be filed in one of these components.
- You can also find us on Twitter as @MozTelemetry.
No comments yet
Comments are closed, but trackbacks are open.