
(“This Week in Glean” is a series of blog posts that the Glean Team at Mozilla is using to try to communicate better about our work. They could be release notes, documentation, hopes, dreams, or whatever: so long as it is inspired by Glean.) All “This Week in Glean” blog posts are listed in the TWiG index (and on the Mozilla Data blog).
As part of the DUET (Data User Engagement Team) working group, some of my day-to-day work involves building dashboards for visualizing user engagement aspects of the Firefox product. At Mozilla, we recently decided to use Looker to create dashboards and interactive views on our datasets. It’s a new system to learn but provides a flexible model for exploring data. In this post, I’ll walk through the development of several mobile acquisition funnels built in Looker. The most familiar form of engagement modeling is probably through funnel analysis — measuring engagement by capturing a cohort of users as they flow through various acquisition channels into the product. Typically, you’d visualize the flow as a Sankey or funnel plot, counting retained users at every step. The chart can help build intuition about bottlenecks or the performance of campaigns.
Mozilla owns a few mobile products; there is Firefox for Android, Firefox for iOS, and then Firefox Focus on both operating systems (also known as Klar in certain regions). We use Glean to instrument these products. The foremost benefit of Glean is that it encapsulates many best practices from years of instrumenting browsers; as such, all of the tables that capture anonymized behavior activity are consistent across the products. One valuable idea from this setup is that writing a query for a single product should allow it to extend to others without too much extra work. In addition, we pull in data from both the Google Play Store and Apple App Store to analyze the acquisition numbers. Looker allows us to take advantage of similar schemas with the ability to templatize queries.
ETL Pipeline
The pipeline brings all of the data into BigQuery so it can be referenced in a derived table within Looker.
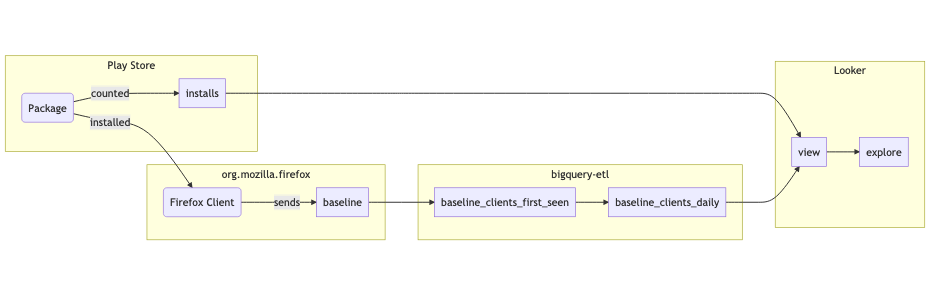
- App Store data is exported into a table in BigQuery.
- Glean data flows into the org_mozilla_firefox.baseline table.
- A derived org_mozilla_firefox.baseline_clients_first_seen table is created from the baseline table. An org_mozilla_firefox.baseline_clients_daily table is created that references the first seen table.
- A Looker explore references the baseline_clients_clients_daily table in a parameterized SQL query, alongside data from the Google Play Store.
- A dashboard references the explore to communicate important statistics at first glance, alongside configurable parameters.
Peculiarities of Data Sources
Before jumping off into implementing a dashboard, it’s essential to discuss the quality of the data sources. For one, Mozilla and the app stores count users differently, which leads to subtle inconsistencies.
For example, there is no way for Mozilla to tie a Glean client back to the Play Store installation event in the Play Store. Each Glean client is assigned a new identifier for each device, whereas the Play Store only counts new installs by account (which may have several devices). We can’t track a single user across this boundary, and instead have to rely on the relative proportions over time. There are even more complications when trying to compare numbers between Android and iOS. Whereas the Play Store may show the number of accounts that have visited a page, the Apple App Store shows the total number of page visits instead. Apple also only reports users that have opted into data collection, which under-represents the total number of users.
These differences can be confusing to people who are not intimately familiar with the peculiarities of these different systems. Therefore, an essential part of putting together this view is documenting and educating the dashboard users to understand the data better.
Building a Looker Dashboard
There are three components to building a Looker dashboard: a view, an explore, and a dashboard. These files are written in a markup called LookML. In this project, we consider three files:
- mobile_android_country.view.lkml
- Contains the templated SQL query for preprocessing the data, parameters for the query, and a specification of available metrics and dimensions.
- mobile_android_country.explore.lkml
- Contains joins across views, and any aggregate tables suggested by Looker.
- mobile_android_country.dashboard.lkml
- Generated dashboard configuration for purposes of version-control.
View
The view is the bulk of data modeling work. Here, there are a few fields that are particularly important to keep in mind. First, there is a derived table alongside parameters, dimensions, and measures.
The derived table section allows us to specify the shape of the data that is visible to Looker. We can either refer to a table or view directly from a supported database (e.g., BigQuery) or write a query against that database. Looker will automatically re-run the derived table as necessary. We can also template the query in the view for a dynamic view into the data.
derived_table: { sql: with period as (SELECT ...), play_store_retained as ( SELECT Date AS submission_date, COALESCE(IF(country = "Other", null, country), "OTHER") as country, SUM(Store_Listing_visitors) AS first_time_visitor_count, SUM(Installers) AS first_time_installs FROM `moz-fx-data-marketing-prod.google_play_store.Retained_installers_country_v1` CROSS JOIN period WHERE Date between start_date and end_date AND Package_name IN ('org.mozilla.{% parameter.app_id %}') GROUP BY 1, 2 ), ... ;;} |
Above is the derived table section for the Android query. Here, we’re looking at the play_store_retained statement inside the common table expression (CTE). Inside of this SQL block, we have access to everything available to BigQuery in addition to view parameters.
# Allow swapping between various applications in the datasetparameter: app_id { description: "The name of the application in the `org.mozilla` namespace." type: unquoted default_value: "fenix" allowed_value: { value: "firefox" } allowed_value: { value: "firefox_beta" } allowed_value: { value: "fenix" } allowed_value: { value: "focus" } allowed_value: { value: "klar" }} |
View parameters trigger updates to the view when changed. These are referenced using the liquid templating syntax:
AND Package_name IN (‘org.mozilla.{% parameter.app_id %}’)
For Looker to be aware of the shape of the final query result, we must define dimensions and metrics corresponding to columns in the result. Here is the final statement in the CTE from above:
SELECT submission_date, country, max(play_store_updated) AS play_store_updated, max(latest_date) AS latest_date, sum(first_time_visitor_count) AS first_time_visitor_count, ... sum(activated) AS activatedFROM play_store_retainedFULL JOIN play_store_installsUSING (submission_date, country)FULL JOIN last_seenUSING (submission_date, country)CROSS JOIN periodWHERE submission_date BETWEEN start_date AND end_dateGROUP BY 1, 2ORDER BY 1, 2 |
Generally, in an aggregate query like this, the grouping columns will become dimensions while the aggregate values become metrics. A dimension is a column that we can filter or drill down into to get a different slice of the data model:
dimension: country { description: "The country code of the aggregates. The set is limited by those reported in the play store." type: string sql: ${TABLE}.country ;;} |
Note that we can refer to the derived table using the ${TABLE} variable (not unlike interpolating a variable in a bash script).
A measure is a column that represents a metric. This value is typically dependent on the dimensions.
measure: first_time_visitor_count { description: "The number of first time visitors to the play store." type: sum sql: ${TABLE}.first_time_visitor_count ;;} |
We must ensure that all dimensions and columns are declared to make them available to explores. Looker provides a few ways to create these fields automatically. For example, if you create a view directly from a table, Looker can autogenerate these from the schema. Likewise, the SQL editor has options to generate a view file directly. Whatever the method may be, some manual modification will be necessary to build a clean data model for use.
Explore
One of the more compelling features of Looker is the ability for folks to drill down into data models without the need to write SQL. They provide an interface where the dimensions and measures can be manipulated and plotted in an easy-to-use graphical interface. To do this, we need to declare which view to use. Often, just declaring the explore is sufficient:
include: "../views/*.view.lkml"
|
We include the view from a location relative to the explore file. Then we name an explore that shares the same name as the view. Once committed, the explore is available to explore in a drop-down menu in the main UI.
The explore can join multiple views and provide default parameters. In this project, we utilize a country view that we can use to group countries into various buckets. For example, we may have a group for North American countries, another for European countries, and so forth.
explore: mobile_android_country { join: country_buckets { type: inner relationship: many_to_one sql_on: ${country_buckets.code} = ${mobile_android_country.country} ;; } always_filter: { filters: [ country_buckets.bucket: "Overall" ] }} |
Finally, the explore is also the place where Looker will materialize certain portions of the view. Materialization is only relevant when copying the materialized segments from the exported dashboard code. An example of what this looks like follows:
aggregate_table: rollup__submission_date__0 { query: { dimensions: [ # "app_id" is filtered on in the dashboard. # Uncomment to allow all possible filters to work with aggregate awareness. # app_id, # "country_buckets.bucket" is filtered on in the dashboard. # Uncomment to allow all possible filters to work with aggregate awareness. # country_buckets.bucket, # "history_days" is filtered on in the dashboard. # Uncomment to allow all possible filters to work with aggregate awareness. # history_days, submission_date ] measures: [activated, event_installs, first_seen, first_time_visitor_count] filters: [ # "country_buckets.bucket" is filtered on by the dashboard. The filter # value below may not optimize with other filter values. country_buckets.bucket: "tier-1", # "mobile_android_country.app_id" is filtered on by the dashboard. The filter # value below may not optimize with other filter values. mobile_android_country.app_id: "firefox", # "mobile_android_country.history_days" is filtered on by the dashboard. The filter # value below may not optimize with other filter values. mobile_android_country.history_days: "7" ] } # Please specify a datagroup_trigger or sql_trigger_value # See https://looker.com/docs/r/lookml/types/aggregate_table/materialization materialization: { sql_trigger_value: SELECT CURRENT_DATE();; }} |
Dashboard
Looker provides the tooling to build interactive dashboards that are more than the sum of its parts. Often, the purpose is to present easily digestible information that has been vetted and reviewed by peers. To build a dashboard, you start by adding charts and tables from various explores. Looker provides widgets for filters and for markdown text used to annotate charts. It’s an intuitive process that can be somewhat tedious, depending on how complex the information you’re trying to present.

Once you’ve built the dashboard, Looker provides a button to get a YAML representation to check into version control. The configuration file contains all the relevant information for constructing the dashboard and could even be written by hand with enough patience.
Strengths and Weaknesses of Looker
Now that I’ve gone through building a dashboard end-to-end, here are a few points summarizing my experience and the take-aways from putting together this dashboard.
Parameterized queries allow flexibility across similar tables
I worked with Glean-instrumented data in another project by parameterizing SQL queries using Jinja2 and running queries multiple times. Looker effectively brings this process closer to runtime and allows the ETL and visualization to live on the same platform. I’m impressed by how well it works in practice. The combination of consistent data models in bigquery-etl (e.g. clients_first_seen) and the ability to parameterize based on app-id was surprisingly straightforward. The dashboard can switch between Firefox for Android and Focus for Android without a hitch, even though they are two separate products with two separate datasets in BigQuery.
I can envision many places where we may not want to precompute all results ahead of time but instead just a subset of columns or dates on-demand. The costs of precomputing and materializing data is non-negligible, especially for large expensive queries that are viewed once in a blue moon or dimensions that fall in the long tail. Templating and parameters provide a great way to build these into the data model without having to resort to manually written SQL.
LookML in version control allows room for software engineering best practices
While Looker appeals to the non-technical crowd, it also affords many conveniences for the data practitioners who are familiar with the software development practices.
Changes to LookML files are version controlled (e.g., git). Being able to create branches and work on multiple features in parallel has been handy at times. It’s relieving to have the ability to make changes in my instance of the Looker files when trying out something new without having to lose my place. In addition, the ability to configure LookML views, explores, and dashboards in code allow for the process of creating new dashboards to incorporate many best practices like code review.
In addition, it’s nice to be able to use a real editor for mass revision. I was able to create a new dashboard for iOS data that paralleled the Android dashboard by copying over files, modifying the SQL in the view, and making a few edits to the dashboard code directly.
Workflow management is clunky for deploying new dashboards
While there are many upsides to having LookML explores and dashboards in code, there are several pain points while working with the Looker interface.
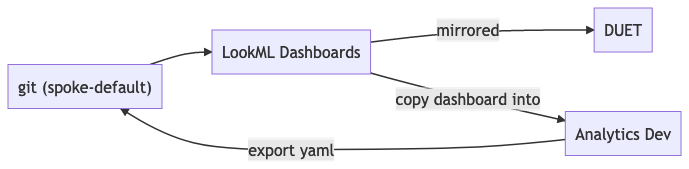
In particular, the workflow for editing a Dashboard goes something like this. First, you copy the dashboard into a personal folder that you can edit. Next, you make whatever modifications to that dashboard using the UI. Afterward, you export the result and copy-paste it into the dashboard code. While not ideal, this prevents the Dashboard from going out of sync from the one that you’re editing directly (since there won’t be conflicts between the UI and the code in version control). However, it would be nice if it were possible to edit the dashboard directly instead of making a copy with Looker performing any conflict resolution internally.
There have been moments where I’ve had to fight with the built-in git interface built into Looker’s development mode. Reverting a commit to a particular branch or dealing with merge conflicts can be an absolute nightmare. Suppose you do happen to pull the project in a local environment. In that case, you aren’t able to validate your changes locally (you’ll need to push, pull into Looker, and then validate and fix anything). Finally, the formatting option is stuck behind a keyboard shortcut while the browser is already using the keyboard shortcut.
Conclusion: Iterating on Feedback
Simply building a dashboard is not enough to demonstrate that it has value. It’s important to gather feedback from peers and stakeholders to determine the best path forward. Some things benefit from having a concrete implementation, though; there are differences between different platforms and inconsistencies in the data that may only appear after putting together an initial draft of a project.
While hitting goals of making data across app stores and our user populations visible, the funnel dashboard has room for improvement. Having this dashboard located in Looker makes the process of iterating that much easier, though. In addition, the feedback cycle of changing the query to seeing the results is relatively low and is easy to roll back. The tool is promising, and I look forward to seeing how it transforms the data landscape at Mozilla.