Staring at the Sun: Dalvik vs. ASM.js vs. Native

As many of you are probably already aware, Mozilla has recently gotten into the mobile OS space with Firefox OS. Firefox OS is built using web technologies like HTML, CSS, and of course Javascript. All Firefox OS apps are built on these technologies, including core platform apps.

Given that app logic in Firefox OS will be written in Javascript, one of the questions facing Mozilla’s Javascript engine (SpiderMonkey) is how it stacks up against other language platforms on mobile devices. To try to get some insight into that question, I spent a little time over the last two weeks conducting a small performance experiment.

the experiment

Starting with the SunSpider benchmark as a base, I ported a handful of programs from Javascript to both Java and C++, being as faithful as possible to the original logic. I compiled the Java version into an Android Dalvik app, and I compiled the C++ version with emscripten to produce asm.js code.

Then I measured the following times on a Nexus 4:

  1. Dalvik app, running directly on Android
  2. Asm.js code (compiled from C++), running on Mobile Firefox Nightly
  3. Native code (compiled from C++), running directly on Android (compiled using ndk-build V=1 TARGET_ARCH_ABI=armeabi-v7a)

I took the inverse of the running times (so that higher scores would be better), and scaled all results so that Dalvik had a score of 1 for each program.

I also looped the runs 10 to 1000 times (depending on the program) to give the optimizing engines an opportunity to compile the hot code. Typically, SunSpider programs take a fraction of a second to run. Longer runtimes make SunSpider mimic app execution conditions, since apps typically run from dozens of seconds to minutes at a time.

The ported programs were binary-trees, 3D-morph, partial-sums, fasta, spectral-norm, nsieve, and nbody. You can obtain the source code at:

http://github.com/kannanvijayan/benchdalvik

the disclaimer

I want to be very clear about this up-front: I don’t think SunSpider is a great benchmark for sophisticated performance analysis. It’s really much closer to a collection of micro-benchmarks that cover a limited baseline level of performance measurement.

I chose SunSpider for this experiment because it contains small benchmarks that are easy to hand port, and because there is a clear translation from the Javascript source to a comparable C++ or Java source. Comparing different language platforms is not an exact science. Even in these simple micro benches, it behooves us to properly analyze and evaluate the results.

the results

Disclaimers aside, you may be surprised at the results:

Benchmark Results

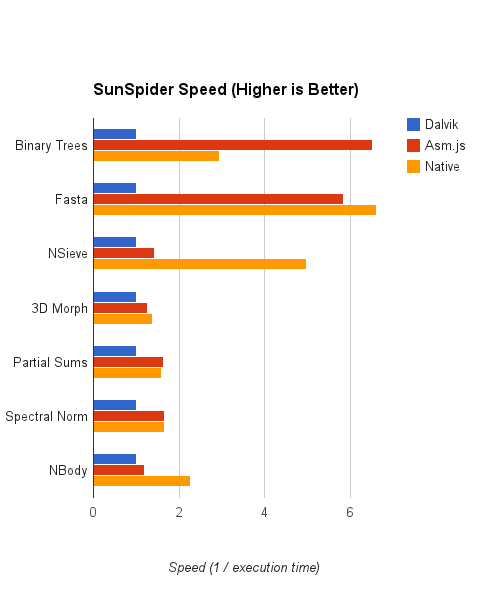
The graph above shows asm.js doing pretty well, rivaling or beating native on some benchnmarks (binary-trees). The numbers by themselves, however, aren’t as useful or as interesting as the reasons why. Let’s dissect the results from most interesting to least interesting.

the analysis

Binary Trees

The binary trees score is very surprising. Here, the asm.js version actually does significantly better than native. This result seems very counter-intuitive, but it may have a reasonable explanation.

Notice that binary-trees allocates a lot of objects. In C++, this causes many calls to malloc. When compiled to native code, the malloc implementation occasionally uses expensive system calls to allocate new memory from the system.

In asm.js, the compiled C++ is executed using a Javascript typed array as the “machine memory”. The machine memory is allocated once and then used for the entire program runtime. Calls to malloc from asm.js programs perform no syscalls. This may be the reason behind asm.js-compiled C++ doing better than native-compiled C++, but requires further investigation to confirm.

Another question is why Dalvik does so badly. This is the kind of thing Java should excel at: simple, fixed size class, lots of small allocations, etc. I don’t have a good answer to this question – this score actually genuinely surprised me, as I was expecting Dalvik to come out stronger than it did.

This is pure speculation, but I think Dalvik’s score may be a consequence of its tracing JIT. After speaking to people with tracing JIT experience, I learned that compiling recursion using tracing JITs can be very difficult. Given that binary trees spends most of its time in a few recursive functions, this might explain Dalvik’s result. If a reader has better insight into this score and what might be causing it, I would love your feedback.

Fasta

Note that the fasta program has been modified to move the makeCumulative operation out of the main loops and into the the setup code.

Asm.js and native C++ both come out far ahead of Dalvik, with native gaining a bit of an edge over asm.js. Let’s analyze what’s going on here.

It’s easy to see from the code that the program spends a LOT of time iterating across an associative array and accessing its values. In the C++/asm.js implementation, this is turned into an efficient iteration across a hash_map composed of inlined char keys and double values. In Java, this is an iteration across a java.util.HashMap, which stores heap-boxed Character and Double instances.

The Java hash table iteration incurs heavy overhead and indirection. The iteration traverses pointers to Map.Entry objects instead of directly iterating across fixed-size entries (as in C++), and it is forced to extract char and double values from heap-allocated Character and Double objects. Java collections are extremely powerful, but they tend to show their strengths more on large collections of more complex objects than on small collections of primitive values. The tiny lookup tables in fasta work against Java’s strengths.

The C++/asm.js version has a more efficient storage of these values, as well as a more efficient iteration across them. C++/asm.js also uses one-byte chars, as opposed to Java and Javascript’s two-byte chars, which means the C++/asm.js implementation generally touches less memory.

Breaking it down, the fasta benchmark’s main measurement is how fast the language can do lookups on small associative arrays. I believe Dalvik doesn’t do too well here because of Java peculiarities: collections not holding primitive values, and collection iteration having heavy overhead.

That said, it’s nice to see asm.js coming reasonably close behind native.

NSieve

In this benchmark, asm.js comes in about 3x slower than native, and slightly ahead of Dalvik.

This was an unexpected result – I had expected asm.js to be much closer to native speed. Alon Zakai (Mozilla researcher and author of emscripten, the tool that compiles C++ to asm.js) informs me that on desktop (x86) machines, the asm.js score is around 84% of the native score. This suggests that the problem lies in Spidermonkey’s ARM code-generation, and should be able to be improved upon.

3D Morph, Partial Sums, and Spectral Norm

I’m lumping these together because I feel that their scores all have basically the same explanation.

Native, asm.js, and Dalvik all have pretty similar scores, with native beating asm.js by a bit, and asm.js beating Dalvik by a slightly bigger bit. (Ignore the part where asm.js seems to come ahead of native on partial sums – I’m pretty sure that’s just measurement noise, and that the scores are actually just neck and neck).

The thing about these programs is that they’re all very double-precision-floating-point-heavy. These operations on an ARM cpu tend to be very expensive, and speed differences in other parts of the code would be underrepresented in the overall score.

The most surprising aspect of these results is not the asm.js vs native score, but the fact that Dalvik seems to lag behind about 20-30% from the asm.js scores.

NBody

In nbody, asm.js edges out Dalvik, but clocks in at about half the speed of the native code.

I have a guess about why asm.js is only half as fast as native here. The nbody code performs a lot of double-indirections: pulling a pointer out of an array, and then reading from memory at an offset from that pointer. Each of those reads can be implemented on ARM in a single instruction using the various addressing modes for the ARM LDR instruction.

For example, reading an object pointer from an array of pointers, and then reading a field within that object, would take two instructions:

LDR TargetReg, [ArrayReg + (IndexReg leftshift 2)]
LDR TargetReg, [TargetReg + OffsetOfField]

(Above, ArrayReg is a register holding a pointer to the array, IndexReg is a register holding the index within the array, and OffsetOfField is a constant value)

However, in asm.js, the “memory” reads are actually reads within a typed array, and “pointers” are just integer offsets within that array. Pointer dereferences in native code become array reads in asm.js code, and these reads must be bounds-checked as well. The equivalent read in asm.js would take five instructions:

LDR TargetReg, [ArrayReg + (IndexReg leftshift 2)]
CMP TargetReg, MemoryLength
BGE bounds-check-failure-address
LDR TargetReg, MemoryReg + TargetReg
LDR TargetReg, [TargetReg + OffsetOfField]

(Above, ArrayReg, IndexReg, and OffsetOfField are as before, and MemoryReg is a register holding a pointer to the base of the TypedArray used in asm.js to represent memory)

Basically, asm.js adds an extra level of indirection into the mix, making indirect memory reads more expensive. Since this benchmark relies heavily on performing many of these within its inner loops, I expect that this overhead weighs heavily.

Please keep in mind that the above reasoning is just an educated guess, and shouldn’t be taken as fact without further verification.

the takeaway

This experiment has definitely been interesting. There are a couple of takeaway conclusions I feel reasonably confident drawing from this:

1. Asm.js is reasonably competitive with native C++ code on ARM. Even discarding the one score where asm.js did better, it executes at around 70% of the speed of native C++ code. These results suggest that apps with high performance needs can use asm.js as the target of choice for critical hot-path code, achieving near native performance.

2. Asm.js competes very well on mobile performance compared to Dalvik. Even throwing out the benchmarks that are highly favourable to asm.js (binary-trees and fasta), there seems to be a consistent 10-50% speedup over comparable Dalvik code.

the loose ends

The astute reader may at this point be wondering what happened to the plain Javascript scores. Did regular Javascript do so badly that I ignored them? Is there something fishy going on here?

To be frank, I didn’t include the regular Javascript scores in the results because regular Javascript did far too well, and I felt that including those scores would actually confuse the analysis instead of help it.

The somewhat sad fact is that SunSpider scores have been “benchmarketed” beyond reason. All Javascript engines, including SpiderMonkey, use optimizations like transcendental math caches (a cache for operations such as sine, cosine, tangent, etc.) to improve their SunSpider scores. These SunSpider-specific optimizations, ironically, make SunSpider a poor benchmark for talking about plain Javascript performance.

If you really want to see how plain Javascript scores alongside the rest, click the following link:

http://blog.mozilla.org/javascript/files/2013/08/Dalvik-vs-ASM-vs-Native-vs-JS.png

the errata

HackerNews reader justinsb pointed out a bug in my C++ and Java code for spectral norm (https://news.ycombinator.com/item?id=6174204). Programs have been re-built and the relevant numbers re-generated. The chart in the main post has been updated. The old chart is available here:

https://blog.mozilla.org/javascript/files/2013/08/Dalvik-vs-ASM-vs-Native.png

22 responses

Post a comment

  1. Osvaldo Pinali Doederlein wrote on :

    Individual memory allocation functions in C/C++ (like malloc/new/delete/free) do not involve any syscalls; the heap is a local resource and these alloc functions are just regular libraries that run in the process. The implementation of these libraries only needs syscalls to grab (or return) large chunks of virtual memory from the OS, but this is very infrequent unless you have some degenerate program that expands and contracts the heap in very quick cycles (even in that case, a good library would avoid releasing virtual memory too eagerly). OTOH, this kind of benchmark is very good for GC and very bad for a malloc that has to walk free lists.

    Reply

    1. Kannan Vijayan wrote on :

      Your last comment was exactly my belief as well, and one of the reasons why the results surprised me so much.

      To get a proper answer, I need to look into the libc malloc implementation on Android’s NDK libc, and figure out how large its brk() / mmap() requests are when it goes to get more memory from the system, and how much it’s allocating each time, and compare with the malloc implementation used by emscripten.

      The problem is, outside of that answer, I can’t come up with a very good reason for why the native build would be so much slower than the asm.js build. It’s a very counterintuitive result and I’m still not exactly sure how and why it happens.

      Reply

      1. panzi wrote on :

        Just guessing here:
        Maybe it’s about the cleanup? C++ eagerly destroys objects and runs destructors. Is it possible to force the JavaScript gc to run at a certain point? Then what happens if you force it to run before the end of the test? Maybe the gc is just very lazy. I read something on reddit about speeding up the D compiler by writing a custom allocator that never frees any memory, which dramatically improved it’s speed.

        Reply

        1. Kannan Vijayan wrote on :

          The GC definitely plays a part in these outcomes. SpiderMonkey does deallocations in the background (the mark runs synchronously, but the sweep is pushed to a background thread). This wouldn’t have been an issue for Native vs. ASM.js, though, since they are both running the exact same C++ code, and emscripten’s compilation of the C++ code doesn’t do JS object allocation.

          There are a lot of different variants to test. I’m back to working on JS engine these days, so I’m not sure when I can get a chance to test different variants.

          But the sources I used to do the tests are available. Feel free to check it out and let me know!

          Reply

  2. Zac Bowling wrote on :

    So we have a better NDK than Googles at Apportable. We use our own malloc and better C++ runtime (libc++ instead of libstdc++) and use Clang 3.4 instead of GCC.

    One problem with your tests is that you are using the system malloc, and that is horribly slow (and dalvik gc will even obtain a global lock on it every now and then). Firefox does not use the system malloc (instead it uses jemalloc). This actually has a big overhead.

    I would love to run your tests on our platform. Can publish the exact times you got? I want to spin it up and see if I can get better numbers on the native side.

    Reply

    1. Kannan Vijayan wrote on :

      Here’s a paste of a CSV containing scores:
      http://paste.ubuntu.com/5960016/

      The right column of 9 numbers for each platform represents the time each of 9 runs. Those are averaged, inversed, and then scaled to the Dalvik score (so Dalvik gets a 1 always) to arrive at the numbers used in the chart.

      Reply

  3. voidlogic wrote on :

    The binary tree benchmark is meaningless, any decent C/C++/Java programmer would create a node pool in that high-GC/malloc pressure senario. Its not a news flash that poorly written C/C++/Java can be slower than well written asm.js Javascript one.

    Also, where are the process memory usage stats? There are always tradeoffs, my understanding is that Davlik is much slower than the JVM on the same hardware, but uses much less memory.

    Reply

    1. Kannan Vijayan wrote on :

      The native build and asm.js code were generated from the same C++ source. Any optimization issue suffered by the former would also affect the latter. This is not a case of “bad native code” vs. “good asm.js code”. They’re both generated from the exact same source.

      These same pooled allocation techniques can be used in plain Javascript as well. In fact, I’m aware that game developers use that same technique (pooling JS objects into linked lists), to improve performance on JS engines. However, implementing the fastest binary trees implementation was not my goal. My goal was to compare and contrast the costs and tradeoffs associated with particular implementation techniques across various platforms and languages. To do that effectively, I needed to keep each implementation as faithful and similar to the others as was sensible.

      You are correct that Dalvik optimizes more for space than for speed. However, there’s something about binary-trees that really seems to throw it off even more than other benchmarks. The only thing I can pinpoint is the recursion aspect.

      I didn’t collect memory usage stats because the focus of my experiment was on speed, and I feel that these benchmarks would not even be the appropriate ones to use to talk about memory usage. Most of them do minimal allocation. Binary trees and spectral norm are the odd ones out here, and even they don’t really stress the memory system.

      If I had wanted to compare memory footprint, I’d use larger benchmarks with more hot code (to test the memory footprint of the JITs), and which allocated more memory and created complex object graphs (to test the object memory overhead and GC performance). Doing that would be a much more involved task, and independent of the measurements presented here.

      Reply

  4. Wukix Inc wrote on :

    We make a lisp implementation, mocl (https://wukix.com/mocl), that runs on Android and we found similar results for the binary trees benchmark. This was not from SunSpider binary trees, but from the binary trees of http://benchmarksgame.alioth.debian.org/. I assume they are similar.

    For a parameter of n=16, Dalvik came in at 66.4s whereas mocl came in at 17.8s. I wish I had some solid theory to explain this, but I don’t. I imagined it was an issue with the Dalvik GC, but your theory on tracing JITs seems plausible.

    Reply

  5. David Illsley wrote on :

    An interesting set of tests. The general conclusion – that you can get asm.js to go pretty fast on mobile seems to have been proved. At the more detailed level, I’m a little unconvinced.

    The Fasta numbers for Dalvik seem wrong because of the use of a HashMap. That’s not how you’d do it in Java – Java devs aren’t used to associative arrays – you’d do the array of objects thing they’ve done in fastaredux.java (or even separate primitve arrays if you cared about performance). Comparing an optimised subset of JS vs the highest level abstraction in another language doesn’t really mean much.

    Reply

    1. Kannan Vijayan wrote on :

      One of the principles in the experiment was to use the language’s natural mechanisms for implementing behaviours. The C++ code used a hash_map, the JS code used its native “hash table” (a raw object), so I used the natural corollary to that in Java.

      The goal with these benches is less about the final score than it is about how the various language mechanisms contribute to that score for each of the platforms. In turn, that reveals information about those platforms and their strengths and weaknesses.

      Reply

  6. Nestor wrote on :

    I’m assuming that the Firefox Nightly uses an asm.js-optimized version of SM, which is fine of course. It would be very interesting however to see the results for the same asm.js code running on the stock browser and/or Chrome to compare it under more common circumstances.

    Reply

    1. Kannan Vijayan wrote on :

      Not a bad idea. I can run the asm.js benches on Chrome. I’ll try to do that when I get time.

      Reply

  7. Mikael Ståldal wrote on :

    Why are you not using Android specific APIs in the Java versions that you run on Dalvik?

    In fasta, you could replace java.util.HashMap with http://developer.android.com/reference/android/util/SparseArray.html

    Reply

    1. Kannan Vijayan wrote on :

      Thanks for pointing that out! This was my first foray into Android development, so I used the APIs I was familiar with from programming Java. I was not familiar with the android-specific APIs available.

      I’ve gone back to JS engine work now, but I’d be interested in how that change affects results. If I get time I’ll re-try with this and see what the results are.

      Reply

  8. Simon wrote on :

    I looked only at the binary-tree codes yet. But I got the feeling, that you misuse the volatile keyword both in Java and C++. They don’t mean the same thing. It slows down both codes unnecessarily. (especially on ARM in the JAVA case)

    Reply

    1. Kannan Vijayan wrote on :

      The use of volatile writes doesn’t hit the hot paths in the code, so I doubt that it would end up making that big of an impact on the results.

      Reply

  9. A wrote on :

    I can’t even tell how much wrong there is with your tests and the way you ran them.

    First of all I’ve looked into your Java code (Dalvik) apps and you’re not using any of the provided libraries that would make the app faster. Try to look into Android development guide and see how much there is provided to a developer for free to make everyone’s life easier.

    Then, don’t forget that you shouldn’t just compare execution times, but also with that you need to compare CPU usage, memory usage, and measuring an app performance by just putting times is just wrong. You should read a book “how google tests software”, then read about developing a responsive UI for Android on developer.android.com, then you should read about how improve application performance. Don’t forget that we are talking about ASM.js and the purpose of ASM is to create heavily optimized JS code on its output. You as a developer haven’t done any improvements to your code on the Java side, so this is just wrong to compare.

    Let’s talk about your NDK code and the way you’re measuring its performance. You can’t just measure the time it took for an app to execute within the native shared library, it’s just WRONG. Don’t forget that the execution time maybe really fast in the C++ code but there is an overhead for the response to get back into the Java code. You didn’t account for that in your tests. Also, after taking a look at your make files for native code, you didn’t use any optimization flags for Android, nor did you use the “-O” flag for GCC compiler to optimize the code for you. Remember what ASM.js does? It provides heavily optimized code for you on its output, you didn’t do anything like that for the C++ code you’ve been trying to run.

    So after you’ve done all of these optimizations for Android apps that are Java or C++ based, do your measurements again.

    Now I am not saying that ASM.js is bad, it’s awesome! but your tests are completely wrong and therefore you’re providing a false information to the public.

    Reply

    1. Kannan Vijayan wrote on :

      First of all I’ve looked into your Java code (Dalvik) apps and you’re not using any of the provided libraries that would make the app faster.

      Outside of the Fasta benchmark, which requires a simple map structure, there’s not really any scope for “libraries” in these benchmarks. Everything is basically implemented in terms of arrays on both Java and C++.

      Don’t forget that we are talking about ASM.js and the purpose of ASM is to create heavily optimized JS code on its output. You as a developer haven’t done any improvements to your code on the Java side, so this is just wrong to compare.

      The purpose of all the platforms is to create heavily optimized outputs for their target architectures. C compilers try to generate heavily optimized native code. ASM.js takes LLVM bitcode and generates heavily optimized JS that is then compiled by a JIT that is designed to generate heavily optimized machine code. Dalvik’s compiler also generates heavily optimized bytecode, and the runtime JITs its code to generate heavily optimized native code at runtime.

      Both the C++ and Java ports of the benchmarks look very similar to each other and to the plain JS versions. They all just use raw arrays and doubles and integers (except for Fasta, which also uses a hash map).

      Also, my aim with this experiment did not include other metrics. I was looking at speed because that’s what I wanted to find out about. If I wanted to investigate memory, I would have picked a different set of tests and different testing methodology. The SunSpider suite is not an appropriate benchmark for memory tests. Many of the programs work off of a fixed number of allocations, which make it unsuitable for measuring things like memory overheads, etc.

      Let’s talk about your NDK code and the way you’re measuring its performance. You can’t just measure the time it took for an app to execute within the native shared library, it’s just WRONG. Don’t forget that the execution time maybe really fast in the C++ code but there is an overhead for the response to get back into the Java code. You didn’t account for that in your tests.

      The overhead time for getting back into the Java code was not part of the score. The score is derived from just the loop execution time, not the whole program execution time.

      Also, after taking a look at your make files for native code, you didn’t use any optimization flags for Android, nor did you use the “-O” flag for GCC compiler to optimize the code for you. Remember what ASM.js does? It provides heavily optimized code for you on its output, you didn’t do anything like that for the C++ code you’ve been trying to run.

      The “APP_OPTIM := release” line in the Android.mk file for the native builds indicates that the native code should be built with “-O2”. The native-compiled C++ code thus used “-O2” for its optimization level (and also the ARM instruction set instead of the THUMB instruction set, since ARM is faster on average).

      ASM.js takes as its input the optimized bitcode produced by LLVM on the same C++ code. Here, too, the optimization level was “-O2”. Both the native and ASM.js builds of the C++ code were optimized to the same degree.

      So after you’ve done all of these optimizations for Android apps that are Java or C++ based, do your measurements again.

      I went to a great deal of effort to ensure that the comparisons were made on as level of a field as possible. The optimizations and changes you have suggested have already been done, and contribute to the reported scores.

      Reply

  10. Lefteris Stamatogiannakis wrote on :

    I’ve seen in your benchmarks that you are testing mainly with doubles.

    What about floats? It seems to me that floats are used a lot more in practise (in native code) than doubles.

    Is there anyway to define a var as a float in ASM.js?

    Reply

    1. Luke Wagner wrote on :

      Not yet but see:
      https://blog.mozilla.org/javascript/2013/11/07/efficient-float32-arithmetic-in-javascript
      and
      https://bugzilla.mozilla.org/show_bug.cgi?id=904918

      Reply

  11. Matthew Holloway wrote on :

    It would be interesting to see comparisons with the Android browser’s JavaScript, or iOS, too.

    Reply

Reply to A

Cancel Reply