DHAT is a heap profiler that comes with Valgrind. (The name is short for “Dynamic Heap Analysis Tool”.) It tells your where all your heap allocations come from, and can help you find the following: places that cause excessive numbers of allocations; leaks; unused and under-used allocations; short-lived allocations; and allocations with inefficient data layouts. This old blog post goes into some detail.
In the new Valgrind 3.15 release I have given DHAT a thorough overhaul.
The old DHAT was very useful and I have used it a lot while profiling the Rust compiler. But it had some rather annoying limitations, which the new DHAT overcomes.
First, the old DHAT dumped its data as text at program termination. The new DHAT collects its data in a file which is read by a graphical viewer that runs in a web browser. This gives several advantages.
- The separation of data collection and data presentation means you can run a program once under DHAT and then sort and filter the data in various ways, instead of having to choose a particular sort order in advance. Also, full data is in the output file, and the graphical viewer chooses what to omit.
- The data can be sorted in more ways than previously. Some of these sorts involve useful filters such as “short-lived” and “zero reads or zero writes”.
- The graphical viewer allows parts of the data to be hidden and unhidden as necessary.
Second, the old DHAT divided its output into records, where each record consisted of all the heap allocations that have the same allocation stack trace. The choice of stack trace depth could greatly affect the output.
In contrast, the new DHAT is based around trees of stack traces that avoid the need to choose stack trace depth. This avoids both the problem of not enough depth (when records that should be distinct are combined, and may not contain enough information to be actionable) and the problem of too much depth (when records that should be combined are separated, making them seem less important than they really are).
Third, the new DHAT also collects and/or shows data that the old DHAT did not.
- Byte and block measurements are shown with a percentage relative to the global measurements, which helps gauge relative significance of different parts of the profile.
- Byte and block measurements are also shown with an allocation rate (bytes and blocks per million instructions), which enables comparisons across multiple profiles, even if those profiles represent different workloads.
- Both global and per-node measurements are taken at the global heap peak, which gives Massif-like insight into the point of peak memory use.
- The final/lifetimes stats are a bit more useful than the old deaths stats. (E.g. the old deaths stats didn’t take into account lifetimes of unfreed blocks.)
Finally, the new DHAT has a better handling of realloc. The sequence p = malloc(100); realloc(p, 200); now increases the total block count by 2 and the total byte count by 300. In the old DHAT it increased them by 1 and 200. The new handling is a more operational view that better reflects the effect of allocations on performance. It makes a significant difference in the results, giving paths involving reallocation (e.g. repeated pushing to a growing vector) more prominence.
Overall these changes make DHAT more powerful and easier to use.
The following screenshot gives an idea of what the new graphical viewer looks like.
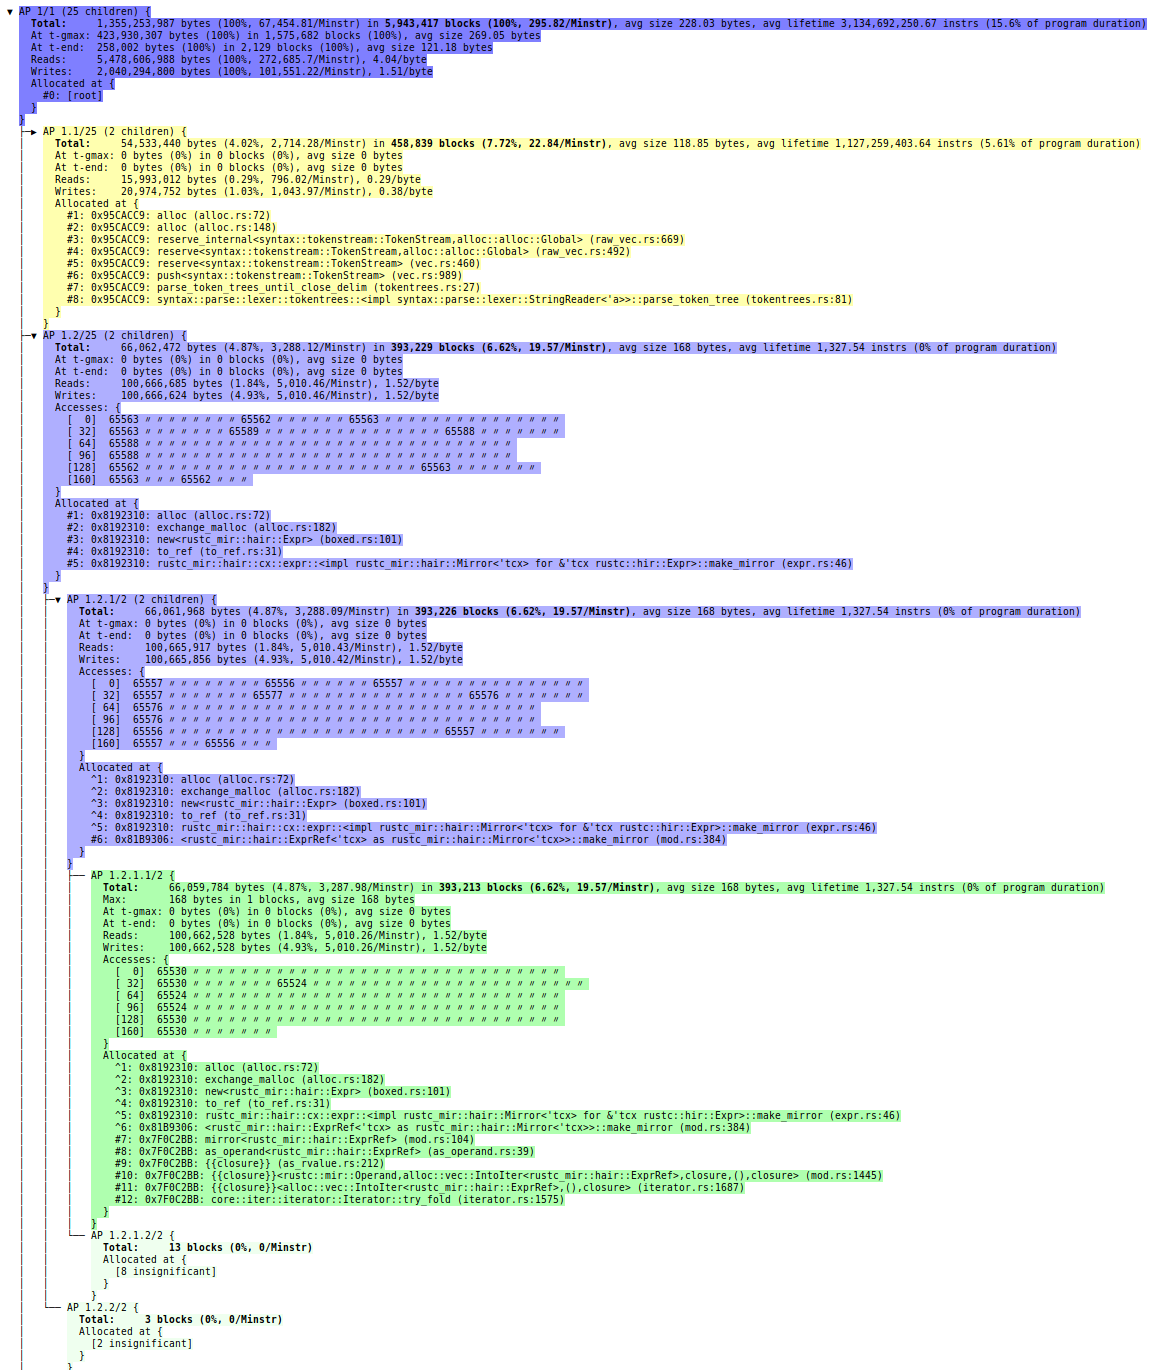
The new DHAT can be run using the --tool=dhat flag, in contrast with the old DHAT, which was an “experimental” tool and so used the --tool=exp-dhat flag. For more details see the documentation.