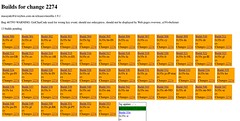
 I’ve uploaded a snapshot of a build in progress on my test display which gives a bit better insight on what’s possible to show about a build based on the information that buildbot has, or a build database had. The important pieces here compared to tinderbox are:
- Builds in progress are associated with the check-in that triggered the build.
- Builds in progress show individual build steps.
- Finished builds are displayed in compact form. In this case, all builds end with warnings, and thus come back in a shade of orange.
- Builds not yet started that are already requested are displayed on top.
I didn’t go into the detail of mentioning which builders are having pending builds. This is mostly me waiting for django 1.1 and aggregation support, but in the end it’s as simple as a GROUP BY. Nor did I try to make that display visually pretty, hell no.
In the context of our regular builds, it’s worthwhile mentioning what unit test and talos runs would look like, i.e., “builds” that are scheduled after the binary builds are done. Those wouldn’t show up until they’re actually scheduled, which is fair enough, as that is what’s actually happening. If a windows build fails, there won’t be unit tests nor talos builds run. You wouldn’t end up in a situation where you think you’re done and you aren’t, though. (Talos not working this way aside, that needs thought due to different masters etc.) The actual builders don’t finish until they triggered the spin-off runs, so you either see the binary build as still running, or you see the triggered runs as pending. Here, as soon as you don’t have anything running or pending and your boxens are green, you’re off the hook.
I also added microsummaries and RSS feeds for this view, so you can use the web to learn about your the fire you lit up.