In recent weeks, we’ve seen either major updates or new launches from a couple significant sources of browser market share. Thus, we thought this would be a good opportunity to provide a high-level overview of a few sources that are out there, what their samples look like, and the ability of each to slice and dice data.
Below you’ll find four different sources of browser market share data. Please note this isn’t meant to be a comprehensive list (if you know of other good sources, please leave a comment). I’ve sorted the following by sample size, largest to smallest, based purely on my own best guess.
1) Gemius
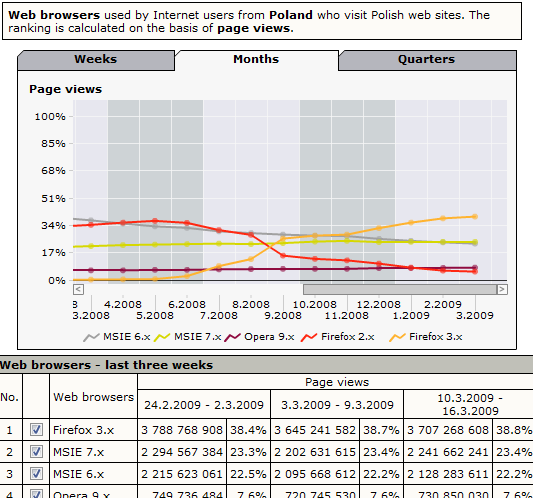
Gemius describes themselves as the “largest online research agency in Central and Eastern Europe”. Even though their data is concentrated on just one region, their sample size is stellar. Looking at any report, you can quickly see the exact number of page views that their data is based on, e.g., browser market share for last week in Poland is based on nearly 10 Billion page views. Looking across different countries, it appears that their monthly sample size is greater than 50 Billion page views. Better yet, all of Gemius’ market share data is free and publicly available.
2) Net Applications
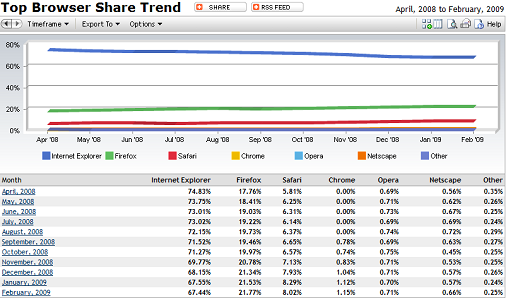
Net Applications describes themselves as “a leading source of applications for webmasters and eMarketers”. Their browser market share data has been published for many years and has been often relied upon by the business press. Derived from site visitors to their network of live stats customers, Net Applications’ data is based on 160 million visitors per month. Most of their data is available publicly, and for a small subscription fee, you can also drill into their data by region/country, by week, and in several other ways.
3) StatCounter
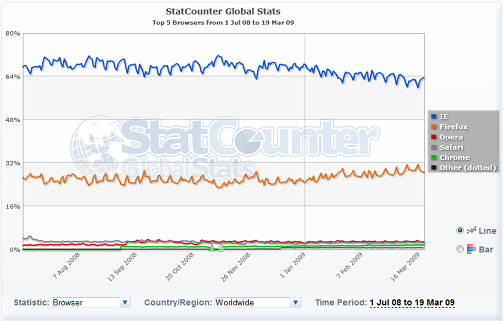
StatCounter appears a bit similar to Net Applications in that they’re a web analytics firm publishing market share reports based on data from across their customers’ web sites. While StatCounter has been around for many years, they just recently launched their browser market share report. They present a super slick (i.e., cool) interface where you can instantly adjust the date range, select a region/country, and choose a bar or trended line chart. And it’s all publicly available. They describe their sample as follows, “Stats are based on aggregate data collected by StatCounter on a sample exceeding 4 billion pageviews per month collected from across the StatCounter network of more than 3 million websites.” So far, I’ve noticed a few inconsistencies when drilling down by region or country (and the data only dates to last summer), but otherwise, it’s good to see StatCounter recently release this service.
4) AT Internet Institute (formerly Xiti)
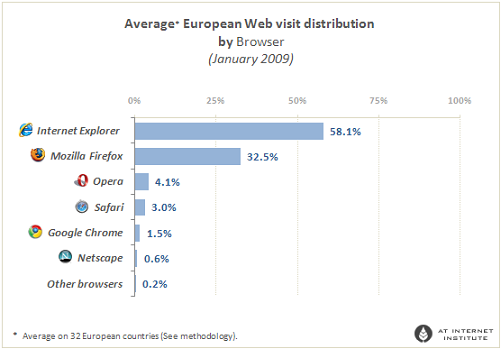
AT Internet Institute describes itself as a company that “enables an integral analysis of websites, intranet and mobile sites”. They have been publishing browser market share reports for nearly five years, and they collect their data in a way similar to the providers highlighted above. For their most recent report (released last week), AT Internet Institute describes their sample as a “cross-section of 122,099 websites”. I believe the majority of these sites are based in France, and the vast majority of the traffic comes from European internet users. While you can’t drill down into their raw data, their quarterly reports do a fairly good job of analyzing and interpreting interesting trends.


Tomer Cohen wrote on
:
Asa Dotzler wrote on
:
David Naylor wrote on
:
Augusto Radtke wrote on
:
Nick wrote on
:
Vanger wrote on
:
Tree wrote on
:
kkovash wrote on
:
Damon wrote on
:
financial spreadbetting wrote on
: