Categories
Memory consumption Performance Programming Rust

How to get the size of Rust types with -Zprint-type-sizes

When optimizing Rust code it’s sometimes useful to know how big a type is, i.e. how many bytes it takes up in memory. std::mem::size_of can tell you, but often you want to know the exact layout as well. For example, an enum might be surprisingly big, in which case you probably will want to know if, for example, there is one variant that is much bigger than the others.

The -Zprint-type-sizes option does exactly this. It isn’t enabled on release versions of rustc, so you’ll need to a nightly version of rustc. Here is one possible invocation:

cargo +nightly rustc -- -Zprint-type-sizes

It will print out details of the size, layout, and alignment of all types in use. For example, for this type:

enum E {
    A,
    B(i32),
    C(u64, u8, u64, u8),
    D(Vec<u32>),
}

it prints the following, plus info about a few built-in types:

print-type-size type: `E`: 32 bytes, alignment: 8 bytes
print-type-size     discriminant: 1 bytes
print-type-size     variant `A`: 0 bytes
print-type-size     variant `B`: 7 bytes
print-type-size         padding: 3 bytes
print-type-size         field `.0`: 4 bytes, alignment: 4 bytes
print-type-size     variant `C`: 23 bytes
print-type-size         field `.1`: 1 bytes
print-type-size         field `.3`: 1 bytes
print-type-size         padding: 5 bytes
print-type-size         field `.0`: 8 bytes, alignment: 8 bytes
print-type-size         field `.2`: 8 bytes
print-type-size     variant `D`: 31 bytes
print-type-size         padding: 7 bytes
print-type-size         field `.0`: 24 bytes, alignment: 8 bytes

It shows:

  • the size and alignment of the type;
  • for enums, the size of the discriminant;
  • for enums, the size of each variant;
  • the size, alignment, and ordering of all fields (note that the compiler has reordered variant C‘s fields to minimize the size of E);
  • the size and location of all padding.

Every detail you could possibly want is there. Brilliant!

For rustc developers, there’s an extra-special trick for getting the size of a type within rustc itself. Put code like this into a file a.rs:

#![feature(rustc_private)]
extern crate syntax;
use syntax::ast::Expr;
fn main() {
    let _x = std::mem::size_of::<Expr>();
}

and then compile it like this:

RUSTC_BOOTSTRAP=1 rustc -Zprint-type-sizes a.rs

I won’t pretend to understand how it works, but the use of rustc_private and RUSTC_BOOTSTRAP somehow let you see inside rustc while using it, rather than while compiling it. I have used this trick for PRs such as this one.

Categories
Memory consumption Performance Rust

How to speed up the Rust compiler in 2018: NLL edition

Niko Matsakis recently blogged about the Rust compiler’s new borrow checker, which implements non-lexical lifetimes (NLL). The new borrow checker is a really nice improvement to Rust, because it accepts many sound programs that the old borrow checker rejected.

In the blog post, Niko wrote briefly about the performance of the new borrow checker.

Finally, those of you who read the previous posts may remember that the performance of the NLL checker was a big stumbling block. I’m happy to report that the performance issues were largely addressed: there remains some slight overhead to using NLL, but it is largely not noticeable in practice, and I expect we’ll continue to improve it over time.

This paragraph is true, but glosses over a lot of details! This post will be about my contributions to this performance work.

Wins

Before I describe individual improvements, it’s worth mentioning that the new borrow checker uses bitsets (1D) and bit matrices (2D) heavily. A number of my wins involved these data structures.

#51869: This PR changed some code so that it overwrote an existing dense bitset rather than replacing it with a newly created one of the same size, reducing instruction counts for most benchmarks, the best by 1.5%.

#51870: This PR reused a structure containing two bitsets rather than recreating it afresh for every statement in a basic block, reducing instruction counts for numerous benchmarks, the best by 1%.

#52250: The compiler has a SparseBitMatrix type. Rows were added on demand, and each row was implemented as a sparse bitset using a BTreeMap. In practice, many of the rows were relatively dense, with 10–90% of the bits being set. This PR changed SparseBitMatrix to use a dense representation for rows, reducing instruction counts on one benchmark by 33% and by 1% on a few others. The PR had a mixed effect on memory usage, increasing the peak on some benchmarks and reducing it on others. (Never fear! #54318 below ended up fixing the regressions.)

#52342: This PR avoided a bunch of allocations in Canonicalizer methods, reducing instruction counts on numerous benchmarks, the best by 2%.

#53383: Further profiling showed that some dense bitsets were large, but had very few bits set within them, so the dense representation was wasteful. This PR implemented a new hybrid bitset type that uses a sparse representation for bitsets with up to 8 bits set and switches to a dense representation beyond that, and used it to replace dense bitsets in several places, reducing instruction counts on the five slowest benchmarks by 55%, 21%, 16%, 10% and 9%, and reducing peak memory usage of three benchmarks by 53%, 33%, and 9%.

#53513: This PR force-inlined a function at one hot callsite, reducing instruction counts on two benchmarks by 1%.

#53551: This PR avoided some clone calls, reducing instruction counts for one benchmark by 0.5%.

#53733: This PR added special handling for a very common and simple case in unroll_place, reducing the instruction counts on one benchmark by 25%.

#53942: A function called precompute_borrows_out_of_scope does a traversal of one or more basic blocks. In order to detect whether a basic block had been previously visited, it recorded the ID of every visited statement in a hash table. Some basic blocks can have many statements, resulting in many hash table lookups. This PR changed the code to record the ID of visited basic blocks in the hash table instead of visited statements — trickier than it sounds because the analysis can start in the middle of a basic block, in which case the first half might need to be eventually visited — reducing instruction counts on one benchmark by 60%.

#54211: Liveness analysis created an array that could get very large. Each element in the array was a struct containing two u32s and a bool. Each of those elements took up 12 bytes, but only 9 of the bytes held data. This PR split the array into three separate arrays, one per field, making the code slightly less readable but reducing peak memory usage on one benchmark by 20%. (Fun fact: those u32s used to be usizes, but I shrunk them back in May.)

#54213: This PR tweaked some code so that the lifetimes of two large data structures didn’t overlap, reducing peak memory usage by 27% on one benchmark and 8% on another. (Note: those data structures are dominated by, you guessed it, bitsets!)

#54318: This PR changed SparseBitMatrix so that each instantiated row used the hybrid bitset representation from #53383 instead of the dense representation, reducing peak memory usage by 14–45% on four benchmarks, and 96% (from 29.1GB to 1.2GB) on one external crate! This PR also fixed the peak memory regression that #52250 introduced for a few benchmarks.

#54420: I subsequently realized that #54211 didn’t go far enough. Some debugging println! statements showed that both of the u32s in each liveness entry almost always held a special value that meant “invalid”. When data is repetitive, compression is possible: I could use a packed representation where the common (INVALID, INVALID, true) and (INVALID, INVALID, false) cases were represented by special u32 values, and all other triples were represented by a u32 index into an auxiliary table. This PR changed the representation as described, reducing instruction counts on numerous benchmarks, the best by 16%, and reducing peak memory usage on numerous benchmarks, the best by 38%. (I also tried a more compact representation where each element was a single byte; it reduced peak memory usage some more by the instruction count reduction was less, so I went with the earlier approach.)

Progress and current status

You probably noticed that some of the improvements in the previous section were large, and I wasn’t the only one working on NLL performance; Niko Matsakis and David Wood also contributed some big wins. This is because the new borrow checker’s performance was originally, to be honest, terrible. This is understandable; the focus had been on functionality and correctness, which is fair enough for a large and complex new component. Nonetheless, in June I was very nervous about its performance.

To be more specific, “check” builds (which don’t generate code) ran as much as 50x slower with the new borrow checker on some benchmarks. And multiple benchmarks were disabled on CI because they were simply too slow or used too much memory.

Issue #52028 tells a representative story. It was originally filed because the html5ever benchmark was triggering out-of-memory failures on CI. Measurements with Massif and DHAT showed that its peak heap memory usage was over 14 GB, largely caused by a single 12 GB allocation! In comparison, the peak with the old borrow checker was roughly 200–300 MB. If you read through that issue, you can see that over a period of 2.5 months we reduced the memory usage from 14 GB, to 10 GB, to 2 GB, to 1.2 GB, to 600 MB, to 501 MB, and finally to 266 MB.

And things are pretty good now. The instruction counts on “check” builds for all benchmarks are at most 18% higher with the new borrow checker than the old borrow checker, and are typically around 5%. (And note that “check” builds are the worst-case scenario; non-“check” builds will see a smaller relative slowdown because of the extra time needed for code generation, which is unaffected by the borrow checker.) Memory usage is similar: all benchmarks except one have peak memory usage that is at most 20% higher, with the typical value around 3%. (The one remaining exceptional benchmark uses 2.7x memory.) The worse numbers generally occur on programs containing very large constants.

I’m not entirely happy even with this level of performance regression, but for now I have run out of ideas for improving it further. The new borrow checker is a lot more sophisticated and tracks a lot more data, so strict performance parity is a tough ask. Nonetheless, given how bad performance was a few months ago, I’m happy that we’ve got it down to a level where most people probably won’t notice any difference. Given that the new borrow checker makes Rust a significantly nicer and easier language to use, I hope it’s an acceptable trade-off.

Categories
Firefox Rust

San Francisco Oxidation meeting notes

At last week’s Mozilla All Hands meeting in San Francisco we had an Oxidation meeting about the use of Rust in Firefox. It was low-key, being mostly about status and progress. The notes are here for those who are interested.

Categories
Performance Rust

How to speed up the Rust compiler some more in 2018

I recently wrote about some work I’ve done to speed up the Rust compiler. Since then I’ve done some more.

rustc-perf improvements

Since my last post, rustc-perf — the benchmark suite, harness and visualizer — has seen some improvements. First, some new benchmarks were added: cargo, ripgrep, sentry-cli, and webrender. Also, the parser benchmark has been removed because it was a toy program and thus not a good benchmark.

Second, I added support for several new profilers: Callgrind, Massif, rustc’s own -Ztime-passes, and the use of ad hoc eprintln! statements added to rustc. (This latter case is more useful than it might sound; in combination with post-processing it can be very helpful, as we will see below.)

Finally, the graphs shown on the website now have better y-axis scaling, which makes many of them easier to read. Also, there is a new dashboard view that shows performance across rustc releases.

Failures and incompletes

After my last post, multiple people said they would be interested to hear about optimization attempts of mine that failed. So here is an incomplete selection. I suggest that rustc experts read through these, because there is a chance they will be able to identify alternative approaches that I have overlooked.

nearest_common_ancestors 1: I managed to speed up this hot function in a couple of ways, but a third attempt failed. The representation of the scope tree is not done via a typical tree data structure; instead there is a HashMap of child/parent pairs. This means that moving from a child to its parent node requires a HashMap lookup, which is expensive. I spent some time designing and implementing an alternative data structure that stored nodes in a vector and the child-to-parent links were represented as indices to other elements in the vector. This meant that child-to-parent moves only required stepping through the vector. It worked, but the speed-up turned out to be very small, and the new code was significantly more complicated, so I abandoned it.

nearest_common_ancestors 2: A different part of the same function involves storing seen nodes in a vector. Searching this unsorted vector is O(n), so I tried instead keeping it in sorted order and using binary search, which gives O(log n) search. However, this change meant that node insertion changed from amortized O(1) to O(n) — instead of a simple push onto the end of the vector, insertion could be at any point, which which required shifting all subsequent elements along. Overall this change made things slightly worse.

PredicateObligation SmallVec: There is a type Vec<PredicationObligation> that is instantiated frequently, and the vectors often have few elements. I tried using a SmallVec instead, which avoids the heap allocations when the number of elements is below a threshold. (A trick I’ve used multiple times.) But this made things significantly slower! It turns out that these Vecs are copied around quite a bit, and a SmallVec is larger than a Vec because the elements are inline. Furthermore PredicationObligation is a large type, over 100 bytes. So what happened was that memcpy calls were inserted to copy these SmallVecs around. The slowdown from the extra function calls and memory traffic easily outweighed the speedup from avoiding the Vec heap allocations.

SipHasher128: Incremental compilation does a lot of hashing of data structures in order to determine what has changed from previous compilation runs. As a result, the hash function used for this is extremely hot. I tried various things to speed up the hash function, including LEB128-encoding of usize inputs (a trick that worked in the past) but I failed to speed it up.

LEB128 encoding: Speaking of LEB128 encoding, it is used a lot when writing metadata to file. I tried optimizing the LEB128 functions by special-casing the common case where the value is less than 128 and so can be encoded in a single byte. It worked, but gave a negligible improvement, so I decided it wasn’t worth the extra complication.

Token shrinking: A previous PR shrunk the Token type from 32 to 24 bytes, giving a small win. I tried also replacing the Option<ast::Name> in Literal with just ast::Name and using an empty name to represent “no name”. That  change reduced it to 16 bytes, but produced a negligible speed-up and made the code uglier, so I abandoned it.

#50549: rustc’s string interner was structured in such a way that each interned string was duplicated twice. This PR changed it to use a single Rc‘d allocation, speeding up numerous benchmark runs, the best by 4%. But just after I posted the PR, @Zoxc posted #50607, which allocated the strings out of an arena, as an alternative. This gave better speed-ups and was landed instead of my PR.

#50491: This PR introduced additional uses of LazyBTreeMap (a type I had previously introduced to reduce allocations) speeding up runs of multiple benchmarks, the best by 3%. But at around the same time, @porglezomp completed a PR that changed BTreeMap to have the same lazy-allocation behaviour as LazyBTreeMap, rendering my PR moot. I subsequently removed the LazyBTreeMap type because it was no longer necessary.

#51281: This PR, by @Mark-Simulacrum, removed an unnecessary heap allocation from the RcSlice type. I had looked at this code because DHAT’s output showed it was hot in some cases, but I erroneously concluded that the extra heap allocation was unavoidable, and moved on! I should have asked about it on IRC.

Wins

#50339: rustc’s pretty-printer has a buffer that can contain up to 55 entries, and each entry is 48 bytes on 64-bit platforms. (The 55 somehow comes from the algorithm being used; I won’t pretend to understand how or why.) Cachegrind’s output showed that the pretty printer is invoked frequently (when writing metadata?) and that the zero-initialization of this buffer was expensive. I inserted some eprintln! statements and found that in the vast majority of cases only the first element of the buffer was ever touched. So this PR changed the buffer to default to length 1 and extend when necessary, speeding up runs for numerous benchmarks, the best by 3%.

#50365: I had previously optimized the nearest_common_ancestor function. Github user @kirillkh kindly suggested a tweak to the code from that PR which reduced the number comparisons required. This PR implemented that tweak, speeding up runs of a couple of benchmarks by another 1–2%.

#50391: When compiling certain annotations, rustc needs to convert strings from unescaped form to escaped form. It was using the escape_unicode function to do this, which unnecessarily converts every char to \u{1234} form, bloating the resulting strings greatly. This PR changed the code to use the escape_default function — which only escapes chars that genuinely need escaping — speeding up runs of most benchmarks, the best by 13%. It also slightly reduced the on-disk size of produced rlibs, in the best case by 15%.

#50525: Cachegrind showed that even after the previous PR, the above string code was still hot, because string interning was happening on the resulting string, which was unnecessary in the common case where escaping didn’t change the string. This PR added a scan to determine if escaping is necessary, thus avoiding the re-interning in the common case, speeding up a few benchmark runs, the best by 3%.

#50407: Cachegrind’s output showed that the trivial methods for the simple BytePos and CharPos types in the parser are (a) extremely hot and (b) not being inlined. This PR annotated them so they are inlined, speeding up most benchmarks, the best by 5%.

#50564: This PR did the same thing for the methods of the Span type, speeding up incremental runs of a few benchmarks, the best by 3%.

#50931: This PR did the same thing for the try_get function, speeding up runs of many benchmarks, the best by 1%.

#50418: DHAT’s output showed that there were many heap allocations of the cmt type, which is refcounted. Some code inspection and ad hoc instrumentation with eprintln! showed that many of these allocated cmt instances were very short-lived. However, some of them ended up in longer-lived chains, in which the refcounting was necessary. This PR changed the code so that cmt instances were mostly created on the stack by default, and then promoted to the heap only when necessary, speeding up runs of three benchmarks by 1–2%. This PR was a reasonably large change that took some time, largely because it took me five(!) attempts (the final git branch was initially called cmt5) to find the right dividing line between where to use stack allocation and where to use refcounted heap allocation.

#50565: DHAT’s output showed that the dep_graph structure, which is a IndexVec<DepNodeIndex,Vec<DepNodeIndex>>, caused many allocations, and some eprintln! instrumentation showed that the inner Vec‘s were mostly only a few elements. This PR changed the Vec<DepNodeIndex> to SmallVec<[DepNodeIndex;8]>, which avoids heap allocations when the number of elements is less than 8, speeding up incremental runs of many benchmarks, the best by 2%.

#50566: Cachegrind’s output shows that the hottest part of rustc’s lexer is the bump function, which is responsible for advancing the lexer onto the next input character. This PR streamlined it slightly, speeding up most runs of a couple of benchmarks by 1–3%.

#50818: Both Cachegrind and DHAT’s output showed that the opt_normalize_projection_type function was hot and did a lot of heap allocations. Some eprintln! instrumentation showed that there was a hot path involving this function that could be explicitly extracted that would avoid unnecessary HashMap lookups and the creation of short-lived Vecs. This PR did just that, speeding up most runs of serde and futures by 2–4%.

#50855: DHAT’s output showed that the macro parser performed a lot of heap allocations, particular on the html5ever benchmark. This PR implemented ways to avoid three of them: (a) by storing a slice of a Vec in a struct instead of a clone of the Vec; (b) by introducing a “ref or box” type that allowed stack allocation of the MatcherPos type in the common case, but heap allocation when necessary; and (c) by using Cow to avoid cloning a PathBuf that is rarely modified. These changes sped up runs of html5ever by up to 10%, and crates.io by up to 3%. I was particularly pleased with these changes because they all involved non-trivial changes to memory management that required the introduction of additional explicit lifetimes. I’m starting to get the hang of that stuff… explicit lifetimes no longer scare me the way they used to. It certainly helps that rustc’s error messages do an excellent job of explaining where explicit lifetimes need to be added.

#50932: DHAT’s output showed that a lot of HashSet instances were being created in order to de-duplicate the contents of a commonly used vector type. Some eprintln! instrumentation showed that most of these vectors only had 1 or 2 elements, in which case the de-duplication can be done trivially without involving a HashSet. (Note that the order of elements within this vector is important, so de-duplication via sorting wasn’t an option.) This PR added special handling of these trivial cases, speeding up runs of a few benchmarks, the best by 2%.

#50981: The compiler does a liveness analysis that involves vectors of indices that represent variables and program points. In rare cases these vectors can be enormous; compilation of the inflate benchmark involved one that has almost 6 million 24-byte elements, resulting in 143MB of data. This PR changed the type used for the indices from usize to u32, which is still more than large enough, speeding up “clean incremental” builds of inflate by about 10% on 64-bit platforms, as well as reducing their peak memory usage by 71MB.

What’s next?

These improvements, along with those recently done by others, have significantly sped up the compiler over the past month or so: many workloads are 10–30% faster, and some even more than that. I have also seen some anecdotal reports from users about the improvements over recent versions, and I would be interested to hear more data points, especially those involving rustc nightly.

The profiles produced by Cachegrind, Callgrind, and DHAT are now all looking very “flat”, i.e. with very little in the way of hot functions that stick out as obvious optimization candidates. (The main exceptions are the SipHasher128 functions I mentioned above, which I haven’t been able to improve.) As a result, it has become difficult for me to make further improvements via “bottom-up” profiling and optimization, i.e. optimizing hot leaf and near-leaf functions in the call graph.

Therefore, future improvement will likely come from “top-down” profiling and optimization, i.e. observations such as “rustc spends 20% of its time in phase X, how can that be improved”? The obvious place to start is the part of compilation taken up by LLVM. In many debug and opt builds LLVM accounts for up to 70–80% of instructions executed. It doesn’t necessarily account for that much time, because the LLVM parts of execution are parallelized more than the rustc parts, but it still is the obvious place to focus next. I have looked at a small amount of generated MIR and LLVM IR, but there’s a lot to take in. Making progress will likely require a lot broader understanding of things than many of the optimizations described above, most of which require only a small amount of local knowledge about a particular part of the compiler’s code.

If anybody reading this is interested in trying to help speed up rustc, I’m happy to answer questions and provide assistance as much as I can. The #rustc IRC channel is also a good place to ask for help.

Categories
Performance Rust

The Rust compiler is getting faster

TL;DR: The Rust compiler has gotten 1.06x–4x faster over the past month.

As changes are made to the Rust compiler, a suite of benchmarks measuring compile time is run regularly on the development version. The data is viewable at http://perf.rust-lang.org. The default view is graphical, showing data from the past month.

Screenshot of perf.rust-lang.org showing measurements of the html5ever benchmark

The screenshot above shows the graphs for a single benchmark called “html5ever”, which consists of an old version of the project of the same name. Each one shows measurements for a different kind of build: a debug build, a “check” build (which detect errors but don’t generate code), and an optimized build. Within each graph there are the following three data series.

  • Clean: a normal build.
  • Baseline incremental: an incremental build with no prior incremental runs. Such a build is a little slower than a normal build, because it does normal compilation and also gathers information to guide subsequent incremental builds.
  • Clean incremental: an incremental build run immediately after a baseline incremental build. This is the best-case scenario for incremental compilation in which the minimal amount of work is done.

If you visit the site yourself you’ll see that most of the benchmarks have more than three data series, including ones for incremental builds done after small code changes (a more realistic use case), and one for builds with non-lexical lifetimes enabled.

The x-axis shows time and the y-axis shows instruction counts. Other units of measurements are available, including cycles, time, and memory usage. Instruction counts are shown as the default; this isn’t ideal because it’s only a proxy for the measurement that really matters (time)… but it’s a pretty good proxy, and it has a lot lower variation than the time measurements, which is important when detecting changes.

This graphical view is particularly useful for detecting major changes. For example, you can see that in early May there was a major regression for “clean” and “baseline incremental” builds, which Alex Crichton fixed a few days later.

As well as the graphical view, the site also provides a textual “compare” view, which can be reached via the link at the top left of each page. This view compares measurements from two revisions of the compiler; by default it compares the most recently measured revision with one from a month ago. (It can also be used locally, which is very useful to evaluate changes that speed up the compiler.)

The screenshot above is of the “compare” view at the time of writing. Each line corresponds to a single graph from the graphical view. (If you visit the site and click on an individual entry it will expand and show all of the measurements. The resemblance between those measurements and this screenshot will of course diminish over time.) The “avg” column shows the average change across all the data series. The “min” and “max” columns show the minimum and maximum changes for any of the data series. The “serde” and “script-servo” lines are empty because those benchmarks were added to the suite less than a month ago, so no comparison can be made.

The table has many numbers, but the thing to take away is that they are almost all significantly negative, meaning that compile time has reduced. The “avg” numbers range from 6% to 38%; the “min” numbers (i.e. best result) go as high as 75%; the “max” numbers (i.e. worst result) go as high as 36%.

In conclusion: the Rust compiler has gotten significantly faster in the past month. Across a wide range of programs, and a wide range of build configurations, compile times have reduced by between 6% and 75%. To put it another way, the compiler has gotten between 1.06x and 4x faster.

These benefits are available right now to users of the Nightly channel. Users of the Release channel will see them more gradually, spread across one or two versions released over the next few months.

Categories
Performance Rust

How to speed up the Rust compiler in 2018

18 months ago I wrote about some work I did to speed up the Rust compiler (rustc). I’ve recently taken this work up again. Also, in the meantime rustc’s build system has been replaced and its benchmark suite has been overhauled. So it’s a good time for an update.

Getting the code

The steps for getting the rustc code haven’t changed. First, I fork the main Rust repository on GitHub. Then I make two local clones: a base clone that I won’t modify, which serves as a stable comparison point (rust0), and a second clone where I make my modifications (rust1). I use commands something like this:

user=nnethercote
for r in rust0 rust1 ; do
  git clone https://github.com/$user/rust $r
  cd $r
  git remote add upstream https://github.com/rust-lang/rust
  git remote set-url origin git@github.com:$user/rust
done

Building the Rust compiler

The compiler’s build system is complex with many possible invocations and configurations. I’ll cover the absolute minimum information required to understand how I’ve been using it.

(UPDATE, December 2019: I have updated this to account for config.toml   changes since this post was written.)

First, you need a config.toml file, which sits at the root of the repository and dictates the compiler’s configuration. I used the provided config.toml.example as a starting point, cut it down a lot, and ended up with the following.

# Last updated in December 2019
[llvm]
release-debuginfo = true
[rust]
debuginfo-level = 1

This configuration matches the compiler that ships (in particular, in terms of optimization levels), with the exception that it has maximal debug info present, which ensures that profiles are as detailed as possible.

Building rustc can be confusing, particularly because of the multiple compiler stages and the terminology around them. Here is the command I use.

(UPDATE, September 2020: I have updated this to account for the src directory being renamed compiler.)

./x.py build --stage 2 compiler/rustc

This produces a stage 2 compiler that can handle procedural macros and so is suitable for profiling the benchmark suite.

The benchmark suite

rustc’s benchmark suite is called rustc-perf. It consists of two parts:

  • collector: The 24 benchmark programs, 14 of which are “real” code (i.e. crates used in real applications), and 10 of which are toy programs or stress test microbenchmarks. Also, the harness code that runs and measures them.
  • site: Code for displaying measurements as a website.

The test harness is very thorough. For each benchmark, it measures Debug, Opt, and Check (no code generation) invocations. Furthermore, within each of those categories, it does five or more runs, including a normal build and various kinds of incremental builds. A full benchmarking run measures over 400 invocations of rustc. Note however that only the compilation of the final crate is measured in each benchmark; compilation of dependent crates is not included.

rustc-perf was created primarily for the perf.rust-lang.org site, which tracks rustc’s performance over time. I recently modified it so it could be used to compare two builds of rustc on a local machine, which is a fundamental operation when optimizing. This can be done by running the suite and site locally and navigating to the local “compare” page, which looks like this:

Screenshot of rustc-perf's compare page

Note that rustc-perf uses perf-stat for its measurements, so the benchmarking functionality currently only works on Linux.

I also extended rustc-perf so the benchmarks can be run under a profiler. I implemented support for perf-record, Cachegrind, and DHAT, because they are the profilers that I am most familiar with; it isn’t hard to add support for other profilers (including non-Linux ones). The advantage of integrating support for a profiler intto rustc-perf is that it gets the profiler invocations underneath the Cargo invocations, ensuring that the right rustc invocations are measured.

Wins

Here are the improvements I’ve made to rustc over the past few weeks.

#49993: Cachegrind’s output showed that derived methods for the Token type were taking up significant time. This PR changed the ‘#’ counts in raw Lit variants from usize to u16, which reduced the size of Token from 32 to 24 bytes, speeding up some of the runs for coercions and html5ever by 1%.

#50051: Rust’s Option::ok_or function transforms an Option<T> value into a Result<T, E>. It’s a bit of a footgun… as the docs say:

Arguments passed to ok_or are eagerly evaluated; if you are passing the result of a function call, it is recommended to use ok_or_else, which is lazily evaluated.

DHAT’s output showed that one hot allocation site involved the creation of a String while getting the value of the MIRI_BACKTRACE environment variable. This seemed to me like a strange thing to be happening frequently, and it turns out that it was at the end of a chain of calls that were only needed in the (rare) error case of an ok_or call. This PR changed the code to use a trivial closure with ok_or_else, speeding up runs for a lot of benchmarks, the best by 6%.

#50052: DHAT’s output showed that the char_lit function, which parses “\u{…}” literals, was doing a lot of allocations while stripping out ‘_’ chars. This PR avoided that allocation, speeding up various runs — particularly ones for regex, futures, clap, coercions, hyper, and encoding — the best by 6%.

#50106: Cachegrind’s output showed that the nearest_common_ancestor function, which computes the lowest common ancestor of two nodes in a scope tree, was very hot. The algorithm in use constructed the full scope chain for each node, and then worked backward from the end of the two scope chains until a difference was found. This is a reasonable algorithm in many circumstances, but some ad hoc instrumentation (eprintln! statements plus some simple post-processing) showed that the scope chains usually only differ by a handful of elements at the front and then have very long common tails, with dozens or even hundreds of elements. This PR switched to a different algorithm that looks for differences from the front of the scope chain, speeding up runs for many benchmarks, the best by 8%.

#50174: By default, Rust’s HashSet and HashMap use a hash function that is very high quality but also very slow. Therefore, the Rust compiler internally uses different types, FxHashSet and FxHashMap, which are identical to the standard ones except they use a much faster hash function. Unfortunately, it’s easy to forget about them and use the standard hash tables instead. Cachegrind’s output showed that the default hash function code (SipHash) was executed a lot, and that one particularly hot hash table (the symbol interner) was using HashMap. This PR (trivially) changed that table to an FxHashMap, speeding up runs for numerous benchmarks, the best by 5%.

#50240: Some of Rust’s standard containers, such as Vec, HashSet, and HashMap, have the nice property that by default they don’t allocate until an element is inserted. This is good because it’s surprising how often such containers are created but never inserted into. DHAT’s output showed that such behaviour would also help with a couple of the compiler’s uses of BTreeMap. I tried and failed to implement this behaviour directly in BTreeMap; according to Gankro, “BTreeMap is some of the most complex unsafe code in libstd” and “I just scared off a grizzled firefox dev explaining it“! Instead this PR introduced a thin wrapper type (LazyBTreeMap) around BTreeMap and used it in the handful of relevant places within the compiler, speeding up the runs for several benchmarks, the best by 3%. #50266 is open to do the general fix for BTreeMap, whereupon LazyBTreeMap will be able to be removed.

#50246: Cachegrind’s output showed that a function named dump_allocs was hot for some benchmarks. This sounded to me like a logging or debugging function of some kind, and investigation confirmed that it was traversing data structures in order to build up strings that went unused in the standard case where logging is disabled. This PR (trivially) changed this function and a couple of related ones to be no-ops if logging is disabled, speeding up runs for coercions, tuple-stress, html5ever, and encoding, the best by almost 15%! This shows how not doing unclever things is often as important as doing clever things when it comes to optimizing software.

Update: It’s worth noting that I also made three or four optimization attempts that didn’t work out — where I made a change that seemed like it should help, based on profiling data, but the effect was negligible. Success isn’t guaranteed!

Future work

All of the PRs mentioned above (except for the aborted BTreeMap change) involved small, simple changes to the Rust compiler’s code. I’m not a rustc expert, but I do know how to use a couple of profilers well, and I’ve been able to make a difference. I’m sure there are more improvements of this nature to be made, and I encourage other people to try profiling rustc with their favourite profilers to see what they can find. This is valuable because rustc’s speed is something that Rust users often complain about. And it’s fun, if you like that sort of thing 🙂  I’m happy to help people, and the members of the #rustc IRC channel are very friendly and helpful.

Having said that, in a lot of cases, especially for opt builds, the majority of execution time is within LLVM, which rustc uses for code generation. Speeding up LLVM itself may be difficult, but I hope/suspect there is room for improvement in the way that rustc interacts with LLVM. If anyone has ideas on that front I’d love to hear about them.

Categories
Performance Rust

How to speed up the Rust compiler some more

I recently wrote about some work I’ve done to speed up the Rust compiler. Since then I’ve done some more.

Heap allocations

My last post mentioned how heap allocations were frequent within rustc. This led to some wild speculation in some venues: about whether Rust should use heap allocation at all, about whether garbage collection was necessary, and so on. I have two comments about this.

The first is that rustc is a compiler, and like most compilers its execution is dominated by complex traversals of large tree structures: ASTs, IRs, etc. Tree structures typically require heap allocation. In particular, a lot of these tree structures contain Vec, HashMap and HashSet fields, all of which unavoidably use heap allocation.

The second is that although some heap allocation is unavoidable, the amount that rustc was doing was excessive. It is clear that nobody had (or not for a long time) made a concerted effort to minimize heap allocations. With the help of DHAT I’ve been able to greatly reduce the amount done. Any time you throw a new profiler at any large codebase that hasn’t been heavily optimized there’s a good chance you’ll be able to make some sizeable improvements.

Tools

As in my previous post, I focused almost entirely on the benchmarks present in rustc-benchmarks to guide my efforts.

Once again I mostly used Cachegrind and DHAT to profile these benchmarks. I also used Massif (plus the excellent massif-visualizer) to profile peak memory usage on one workload (see below).

I have also recently started using perf a bit more. Huon Wilson told me to add the --callgraph=dwarf flag to my perf record invocations. That improves things significantly, though I still find perf puzzling and frustrating at times, even after reading Brendan Gregg’s thorough examples page.

Wins

#37229: rustc spends a lot of time doing hash table lookups, enough that the cost of hashing is significant. In this PR I changed the hash function used by rustc (FNV) to one inspired by the hash function used within Firefox. The new function is faster because it can process an entire word at a time, rather than one byte at a time. The new hash function is slightly worse in terms of the number of collisions but the change sped up compilation of most workloads by 3–6%.

#37161 & #37318 & #37373: These three PRs removed a lot of unnecessary heap allocations (mostly due to clone()) in the macro parser. They sped up the compilation of html5ever by 20% and 7% and 2%, respectively.

#37267 & #37298: rustc uses “deflate” compression in a couple of places: crate metadata and LLVM bitcode. In the metadata case rustc was often compressing metadata and then throwing away the result! (Thanks to eddyb for diagnosing this and explaining to me how to fix it.) Avoiding this unnecessary work speed up compilation of syntex-incr by 6% and several others by 1–2%.

For the LLVM bitcode case I tweaked the deflate settings so that it ran almost twice as fast while the compression ratio was only slightly worse. This sped up compilation of syntex-incr by another 8% and a couple of others by 1–2%. It’s possible that switching to a different compression algorithm would help some more, thought that would be a much larger change.

#37108: This PR avoided interning values of the Substs type in cases where it was easy to tell that the value had previously been interned. It sped up compilation of several benchmarks by 1–4%.

#37705: This PR avoided some unnecessary calls to mk_ty. It sped up compilation of one benchmark by 5% and a few others by 1–2%.

#37083: This PR inlined various methods involved with uleb128 decoding, which is used when reading crate metadata. This sped up compilation of several benchmarks by 1%.

#36973: This PR fixed things so that a data structure that is only required for incremental compilation is not touched during non-incremental compilation. This sped up compilation of several non-incremental benchmarks by 1%.

#37445 & #37764: One unusual workload was found to make rustc consume excessive amounts of memory (4.5 GiB!) which made it OOM on some machines. I used Massif to identify ways to improve this.

The first PR reduced the size of the Expr enum by shrinking the outsized InlineAsm variant, which reduced peak memory usage by 9%. The second PR removed scope_auxiliary, a data structure used only during MIR dumping (and of marginal utility even then). This reduced peak memory usage by another 10%.

I have filed a PR to add a cut-down version of this workload to rustc-benchmarks.

#36993: This PR did some manual inlining and restructuring of several ObligationForest functions. It sped up compilation of inflate by 2%.

#37642: This PR reduced some excessive indirection present in the representation of HIR. It sped up compilation of some benchmarks by 1, 2 and 4%.

#37427: rustc uses Blake2b hashing to determine when a function’s code has changed. This PR reduced the number of bytes to be hashed by (a) avoiding hashing filenames twice for each span, and (b) pre-uleb128-encoding 32-bit and 64-bit integers, which are usually small. This sped up compilation of syntex-incr by 2%.

Future work

As the compiler front-end gets faster, the proportion of rustc execution time spent in the LLVM back-end increases. For some benchmarks it now exceeds 50% (when doing debug builds), though there is still plenty of variation. Thanks to mrhota there is a new –enable-llvm-release-debuginfo configure option that (unsurprisingly) enabled debuginfo within LLVM. This means that profilers can now give filenames and line numbers for LLVM. I’ve looked at a few places in LLVM that show up high in profiles, though I haven’t yet managed to make any useful changes to it.

Another interesting new development is pnkfelix’s -Zprint-type-sizes option, which should land soon, and will potentially be useful for any program written in Rust, not just rustc. This option will make it trivial to see how each type is laid out in memory, which will make it easy to see how types can be rearranged to be smaller. Up until now this has been a painful and imprecise exercise.

Finally, I want to encourage anyone else with the slightest knack and/or enthusiasm for optimizing code to take a look at rustc. You might be thinking that there isn’t that much low-hanging fruit left, but I am confident there is. It’s getting harder for me to find things to improve, but I am one just person with a particular background and a few preferred profiling tools. I am confident that other people with different backgrounds and tools will find plenty of stuff that I cannot. Rust compile speed still isn’t great, even after these improvements, but the more people who pitch in the faster they’ll improve. Don’t be shy, and if you have any questions please contact me or ask in the #rust or #rustc IRC channels.

Categories
Performance Rust

How to speed up the Rust compiler

Rust is a great language, and Mozilla plans to use it extensively in Firefox. However, the Rust compiler (rustc) is quite slow and compile times are a pain point for many Rust users. Recently I’ve been working on improving that. This post covers how I’ve done this, and should be of interest to anybody else who wants to help speed up the Rust compiler. Although I’ve done all this work on Linux it should be mostly applicable to other platforms as well.

Getting the code

The first step is to get the rustc code. First, I fork the main Rust repository on GitHub. Then I make two local clones: a base clone that I won’t modify, which serves as a stable comparison point (rust0), and a second clone where I make my modifications (rust1). I use commands something like this:

user=nnethercote
for r in rust0 rust1 ; do
  cd ~/moz
  git clone https://github.com/$user/rust $r
  cd $r
  git remote add upstream https://github.com/rust-lang/rust
  git remote set-url origin git@github.com:$user/rust
done

Building the Rust compiler

Within the two repositories, I first configure:

./configure --enable-optimize --enable-debuginfo

I configure with optimizations enabled because that matches release versions of rustc. And I configure with debug info enabled so that I get good information from profilers.

[Update: I now add –enable-llvm-release-debuginfo which builds the LLVM back-end with debug info too.]

Then I build:

RUSTFLAGS='' make -j8

[Update: I previously had -Ccodegen-units=8 in RUSTFLAGS because it speeds up compile times. But Lars Bergstrom informed me that it can slow down the resulting program significantly. I measured and he was right — the resulting rustc was about 5–10% slower. So I’ve stopped using it now.]

That does a full build, which does the following:

  • Downloads a stage0 compiler, which will be used to build the stage1 local compiler.
  • Builds LLVM, which will become part of the local compilers.
  • Builds the stage1 compiler with the stage0 compiler.
  • Builds the stage2 compiler with the stage1 compiler.

It can be mind-bending to grok all the stages, especially with regards to how libraries work. (One notable example: the stage1 compiler uses the system allocator, but the stage2 compiler uses jemalloc.) I’ve found that the stage1 and stage2 compilers have similar performance. Therefore, I mostly measure the stage1 compiler because it’s much faster to just build the stage1 compiler, which I do with the following command.

RUSTFLAGS='' make -j8 rustc-stage1

Building the compiler takes a while, which isn’t surprising. What is more surprising is that rebuilding the compiler after a small change also takes a while. That’s because a lot of code gets recompiled after any change. There are two reasons for this.

  • Rust’s unit of compilation is the crate. Each crate can consist of multiple files. If you modify a crate, the whole crate must be rebuilt. This isn’t surprising.
  • rustc’s dependency checking is very coarse. If you modify a crate, every other crate that depends on it will also be rebuilt, no matter how trivial the modification. This surprised me greatly. For example, any modification to the parser (which is in a crate called libsyntax) causes multiple other crates to be recompiled, a process which takes 6 minutes on my fast desktop machine. Almost any change to the compiler will result in a rebuild that takes at least 2 or 3 minutes.

Incremental compilation should greatly improve the dependency situation, but it’s still in an experimental state and I haven’t tried it yet.

To run all the tests I do this (after a full build):

ulimit -c 0 && make check

The checking aborts if you don’t do the ulimit, because the tests produces lots of core files and it doesn’t want to swamp your disk.

The build system is complex, with lots of options. This command gives a nice overview of some common invocations:

make tips

Basic profiling

The next step is to do some basic profiling. I like to be careful about which rustc I am invoking at any time, especially if there’s a system-wide version installed, so I avoid relying on PATH and instead define some environment variables like this:

export RUSTC01="$HOME/moz/rust0/x86_64-unknown-linux-gnu/stage1/bin/rustc"
export RUSTC02="$HOME/moz/rust0/x86_64-unknown-linux-gnu/stage2/bin/rustc"
export RUSTC11="$HOME/moz/rust1/x86_64-unknown-linux-gnu/stage1/bin/rustc"
export RUSTC12="$HOME/moz/rust1/x86_64-unknown-linux-gnu/stage2/bin/rustc"

In the examples that follow I will use $RUSTC01 as the version of rustc that I invoke.

rustc has the ability to produce some basic stats about the time and memory used by each compiler pass. It is enabled with the -Ztime-passes flag. If you are invoking rustc directly you’d do it like this:

$RUSTC01 -Ztime-passes a.rs

If you are building with Cargo you can instead do this:

RUSTC=$RUSTC01 cargo rustc -- -Ztime-passes

The RUSTC= part tells Cargo you want to use a non-default rustc, and the part after the -- is flags that will be passed to rustc when it builds the final crate. (A bit weird, but useful.)

Here is some sample output from -Ztime-passes:

time: 0.056; rss: 49MB parsing
time: 0.000; rss: 49MB recursion limit
time: 0.000; rss: 49MB crate injection
time: 0.000; rss: 49MB plugin loading
time: 0.000; rss: 49MB plugin registration
time: 0.103; rss: 87MB expansion
time: 0.000; rss: 87MB maybe building test harness
time: 0.002; rss: 87MB maybe creating a macro crate
time: 0.000; rss: 87MB checking for inline asm in case the target doesn't support it
time: 0.005; rss: 87MB complete gated feature checking
time: 0.008; rss: 87MB early lint checks
time: 0.003; rss: 87MB AST validation
time: 0.026; rss: 90MB name resolution
time: 0.019; rss: 103MB lowering ast -> hir
time: 0.004; rss: 105MB indexing hir
time: 0.003; rss: 105MB attribute checking
time: 0.003; rss: 105MB language item collection
time: 0.004; rss: 105MB lifetime resolution
time: 0.000; rss: 105MB looking for entry point
time: 0.000; rss: 105MB looking for plugin registrar
time: 0.015; rss: 109MB region resolution
time: 0.002; rss: 109MB loop checking
time: 0.002; rss: 109MB static item recursion checking
time: 0.060; rss: 109MB compute_incremental_hashes_map
time: 0.000; rss: 109MB load_dep_graph
time: 0.021; rss: 109MB type collecting
time: 0.000; rss: 109MB variance inference
time: 0.038; rss: 113MB coherence checking
time: 0.126; rss: 114MB wf checking
time: 0.219; rss: 118MB item-types checking
time: 1.158; rss: 125MB item-bodies checking
time: 0.000; rss: 125MB drop-impl checking
time: 0.092; rss: 127MB const checking
time: 0.015; rss: 127MB privacy checking
time: 0.002; rss: 127MB stability index
time: 0.011; rss: 127MB intrinsic checking
time: 0.007; rss: 127MB effect checking
time: 0.027; rss: 127MB match checking
time: 0.014; rss: 127MB liveness checking
time: 0.082; rss: 127MB rvalue checking
time: 0.145; rss: 161MB MIR dump
 time: 0.015; rss: 161MB SimplifyCfg
 time: 0.033; rss: 161MB QualifyAndPromoteConstants
 time: 0.034; rss: 161MB TypeckMir
 time: 0.001; rss: 161MB SimplifyBranches
 time: 0.006; rss: 161MB SimplifyCfg
time: 0.089; rss: 161MB MIR passes
time: 0.202; rss: 161MB borrow checking
time: 0.005; rss: 161MB reachability checking
time: 0.012; rss: 161MB death checking
time: 0.014; rss: 162MB stability checking
time: 0.000; rss: 162MB unused lib feature checking
time: 0.101; rss: 162MB lint checking
time: 0.000; rss: 162MB resolving dependency formats
 time: 0.001; rss: 162MB NoLandingPads
 time: 0.007; rss: 162MB SimplifyCfg
 time: 0.017; rss: 162MB EraseRegions
 time: 0.004; rss: 162MB AddCallGuards
 time: 0.126; rss: 164MB ElaborateDrops
 time: 0.001; rss: 164MB NoLandingPads
 time: 0.012; rss: 164MB SimplifyCfg
 time: 0.008; rss: 164MB InstCombine
 time: 0.003; rss: 164MB Deaggregator
 time: 0.001; rss: 164MB CopyPropagation
 time: 0.003; rss: 164MB AddCallGuards
 time: 0.001; rss: 164MB PreTrans
time: 0.182; rss: 164MB Prepare MIR codegen passes
 time: 0.081; rss: 167MB write metadata
 time: 0.590; rss: 177MB translation item collection
 time: 0.034; rss: 180MB codegen unit partitioning
 time: 0.032; rss: 300MB internalize symbols
time: 3.491; rss: 300MB translation
time: 0.000; rss: 300MB assert dep graph
time: 0.000; rss: 300MB serialize dep graph
 time: 0.216; rss: 292MB llvm function passes [0]
 time: 0.103; rss: 292MB llvm module passes [0]
 time: 4.497; rss: 308MB codegen passes [0]
 time: 0.004; rss: 308MB codegen passes [0]
time: 5.185; rss: 308MB LLVM passes
time: 0.000; rss: 308MB serialize work products
time: 0.257; rss: 297MB linking

As far as I can tell, the indented passes are sub-passes, and the parent pass is the first non-indented pass afterwards.

More serious profiling

The -Ztime-passes flag gives a good overview, but you really need a profiling tool that gives finer-grained information to get far. I’ve done most of my profiling with two Valgrind tools, Cachegrind and DHAT. I invoke Cachegrind like this:

valgrind \
 --tool=cachegrind --cache-sim=no --branch-sim=yes \
 --cachegrind-out-file=$OUTFILE $RUSTC01 ...

where $OUTFILE specifies an output filename. I find the instruction counts measured by Cachegrind to be highly useful; the branch simulation results are occasionally useful, and the cache simulation results are almost never useful.

The Cachegrind output looks like this:

--------------------------------------------------------------------------------
            Ir 
--------------------------------------------------------------------------------
22,153,170,953 PROGRAM TOTALS

--------------------------------------------------------------------------------
         Ir file:function
--------------------------------------------------------------------------------
923,519,467 /build/glibc-GKVZIf/glibc-2.23/malloc/malloc.c:_int_malloc
879,700,120 /home/njn/moz/rust0/src/rt/miniz.c:tdefl_compress
629,196,933 /build/glibc-GKVZIf/glibc-2.23/malloc/malloc.c:_int_free
394,687,991 ???:???
379,869,259 /home/njn/moz/rust0/src/libserialize/leb128.rs:serialize::leb128::read_unsigned_leb128
376,921,973 /build/glibc-GKVZIf/glibc-2.23/malloc/malloc.c:malloc
263,083,755 /build/glibc-GKVZIf/glibc-2.23/string/::/sysdeps/x86_64/multiarch/memcpy-avx-unaligned.S:__memcpy_avx_unaligned
257,219,281 /home/njn/moz/rust0/src/libserialize/opaque.rs:<serialize::opaque::Decoder<'a> as serialize::serialize::Decoder>::read_usize
217,838,379 /build/glibc-GKVZIf/glibc-2.23/malloc/malloc.c:free
217,006,132 /home/njn/moz/rust0/src/librustc_back/sha2.rs:rustc_back::sha2::Engine256State::process_block
211,098,567 ???:llvm::SelectionDAG::Combine(llvm::CombineLevel, llvm::AAResults&, llvm::CodeGenOpt::Level)
185,630,213 /home/njn/moz/rust0/src/libcore/hash/sip.rs:<rustc_incremental::calculate_svh::hasher::IchHasher as core::hash::Hasher>::write
171,360,754 /home/njn/moz/rust0/src/librustc_data_structures/fnv.rs:<rustc::ty::subst::Substs<'tcx> as core::hash::Hash>::hash
150,026,054 ???:llvm::SelectionDAGISel::SelectCodeCommon(llvm::SDNode*, unsigned char const*, unsigned int)

Here “Ir” is short for “I-cache reads”, which corresponds to the number of instructions executed. Cachegrind also gives line-by-line annotations of the source code.

The Cachegrind results indicate that malloc and free are usually the two hottest functions in the compiler. So I also use DHAT, which is a malloc profiler that tells you exactly where all your malloc calls are coming from.  I invoke DHAT like this:

/home/njn/grind/ws3/vg-in-place \
 --tool=exp-dhat --show-top-n=1000 --num-callers=4 \
 --sort-by=tot-blocks-allocd $RUSTC01 ... 2> $OUTFILE

I sometimes also use --sort-by=tot-bytes-allocd. DHAT’s output looks like this:

==16425== -------------------- 1 of 1000 --------------------
==16425== max-live: 30,240 in 378 blocks
==16425== tot-alloc: 20,866,160 in 260,827 blocks (avg size 80.00)
==16425== deaths: 260,827, at avg age 113,438 (0.00% of prog lifetime)
==16425== acc-ratios: 0.74 rd, 1.00 wr (15,498,021 b-read, 20,866,160 b-written)
==16425== at 0x4C2BFA6: malloc (vg_replace_malloc.c:299)
==16425== by 0x5AD392B: <syntax::ptr::P<T> as serialize::serialize::Decodable>::decode (heap.rs:59)
==16425== by 0x5AD4456: <core::iter::Map<I, F> as core::iter::iterator::Iterator>::next (serialize.rs:201)
==16425== by 0x5AE2A52: rustc_metadata::decoder::<impl rustc_metadata::cstore::CrateMetadata>::get_attributes (vec.rs:1556)
==16425== 
==16425== -------------------- 2 of 1000 --------------------
==16425== max-live: 1,360 in 17 blocks
==16425== tot-alloc: 10,378,160 in 129,727 blocks (avg size 80.00)
==16425== deaths: 129,727, at avg age 11,622 (0.00% of prog lifetime)
==16425== acc-ratios: 0.47 rd, 0.92 wr (4,929,626 b-read, 9,599,798 b-written)
==16425== at 0x4C2BFA6: malloc (vg_replace_malloc.c:299)
==16425== by 0x881136A: <syntax::ptr::P<T> as core::clone::Clone>::clone (heap.rs:59)
==16425== by 0x88233A7: syntax::ext::tt::macro_parser::parse (vec.rs:1105)
==16425== by 0x8812E66: syntax::tokenstream::TokenTree::parse (tokenstream.rs:230)

The “deaths” value here indicate the total number of calls to malloc for each call stack, which is usually the metric of most interest. The “acc-ratios” value can also be interesting, especially if the “rd” value is 0.00, because that indicates the allocated blocks are never read. (See below for example of problems that I found this way.)

For both profilers I also pipe $OUTFILE through eddyb’s rustfilt.sh script which demangles ugly Rust symbols like this:

_$LT$serialize..opaque..Decoder$LT$$u27$a$GT$$u20$as$u20$serialize..serialize..Decoder$GT$::read_usize::h87863ec7f9234810

to something much nicer, like this:

<serialize::opaque::Decoder<'a> as serialize::serialize::Decoder>::read_usize

[Update: native support for Rust demangling recently landed in Valgrind’s repo. I use a trunk version of Valgrind so I no longer need to use rustfilt.sh in combination with Valgrind.]

For programs that use Cargo, sometimes it’s useful to know the exact rustc invocations that Cargo uses. Find out with either of these commands:

RUSTC=$RUSTC01 cargo build -v
RUSTC=$RUSTC01 cargo rust -v

I also have done a decent amount of ad hoc println profiling, where I insert println! calls in hot parts of the code and then I use a script to post-process them. This can be very useful when I want to know exactly how many times particular code paths are hit.

I’ve also tried perf. It works, but I’ve never established much of a rapport with it. YMMV. In general, any profiler that works with C or C++ code should also work with Rust code.

Finding suitable benchmarks

Once you know how you’re going to profile you need some good workloads. You could use the compiler itself, but it’s big and complicated and reasoning about the various stages can be confusing, so I have avoided that myself.

Instead, I have focused entirely on rustc-benchmarks, a pre-existing rustc benchmark suite. It contains 13 benchmarks of various sizes. It has been used to track rustc’s performance at perf.rust-lang.org for some time, but it wasn’t easy to use locally until I wrote a script for that purpose. I invoke it something like this:

./compare.py \
  /home/njn/moz/rust0/x86_64-unknown-linux-gnu/stage1/bin/rustc \
  /home/njn/moz/rust1/x86_64-unknown-linux-gnu/stage1/bin/rustc

It compares the two given compilers, doing debug builds, on the benchmarks See the next section for example output. If you want to run a subset of the benchmarks you can specify them as additional arguments.

Each benchmark in rustc-benchmarks has a makefile with three targets. See the README for details on these targets, which can be helpful.

Wins

Here are the results if I compare the following two versions of rustc with compare.py.

  • The commit just before my first commit (on September 12).
  • A commit from October 13.
futures-rs-test  5.028s vs  4.433s --> 1.134x faster (variance: 1.020x, 1.030x)
helloworld       0.283s vs  0.235s --> 1.202x faster (variance: 1.012x, 1.025x)
html5ever-2016-  6.293s vs  5.652s --> 1.113x faster (variance: 1.011x, 1.008x)
hyper.0.5.0      6.182s vs  5.039s --> 1.227x faster (variance: 1.002x, 1.018x)
inflate-0.1.0    5.168s vs  4.935s --> 1.047x faster (variance: 1.001x, 1.002x)
issue-32062-equ  0.457s vs  0.347s --> 1.316x faster (variance: 1.010x, 1.007x)
issue-32278-big  2.046s vs  1.706s --> 1.199x faster (variance: 1.003x, 1.007x)
jld-day15-parse  1.793s vs  1.538s --> 1.166x faster (variance: 1.059x, 1.020x)
piston-image-0. 13.871s vs 11.885s --> 1.167x faster (variance: 1.005x, 1.005x)
regex.0.1.30     2.937s vs  2.516s --> 1.167x faster (variance: 1.010x, 1.002x)
rust-encoding-0  2.414s vs  2.078s --> 1.162x faster (variance: 1.006x, 1.005x)
syntex-0.42.2   36.526s vs 32.373s --> 1.128x faster (variance: 1.003x, 1.004x)
syntex-0.42.2-i 21.500s vs 17.916s --> 1.200x faster (variance: 1.007x, 1.013x)

Not all of the improvement is due to my changes, but I have managed a few nice wins, including the following.

#36592: There is an arena allocator called TypedArena. rustc creates many of these, mostly short-lived. On creation, each arena would allocate a 4096 byte chunk, in preparation for the first arena allocation request. But DHAT’s output showed me that the vast majority of arenas never received such a request! So I made TypedArena lazy — the first chunk is now only allocated when necessary. This reduced the number of calls to malloc greatly, which sped up compilation of several rustc-benchmarks by 2–6%.

#36734: This one was similar. Rust’s HashMap implementation is lazy — it doesn’t allocate any memory for elements until the first one is inserted. This is a good thing because it’s surprisingly common in large programs to create HashMaps that are never used. However, Rust’s HashSet implementation (which is just a layer on top of the HashMap) didn’t have this property, and guess what? rustc also creates large numbers of HashSets that are never used. (Again, DHAT’s output made this obvious.) So I fixed that, which sped up compilation of several rustc-benchmarks by 1–4%. Even better, because this change is to Rust’s stdlib, rather than rustc itself, it will speed up any program that creates HashSets without using them.

#36917: This one involved avoiding some useless data structure manipulation when a particular table was empty. Again, DHAT pointed out a table that was created but never read, which was the clue I needed to identify this improvement. This sped up two benchmarks by 16% and a couple of others by 3–5%.

#37064: This one changed a hot function in serialization code to return a Cow<str> instead of a String, which avoided a lot of allocations.

Future work

Profiles indicate that the following parts of the compiler account for a lot of its runtime.

  • malloc and free are still the two hottest functions in most benchmarks. Avoiding heap allocations can be a win.
  • Compression is used for crate metadata and LLVM bitcode. (This shows up in profiles under a function called tdefl_compress.)  There is an issue open about this.
  • Hash table operations are hot. A lot of this comes from the interning of various values during type checking; see the CtxtInterners type for details.
  • Crate metadata decoding is also costly.
  • LLVM execution is a big chunk, especially when doing optimized builds. So far I have treated LLVM as a black box and haven’t tried to change it, at least partly because I don’t know how to build it with debug info, which is necessary to get source files and line numbers in profiles. [Update: there is a new –enable-llvm-release-debuginfo configure option that causes LLVM to be build with debug info.]

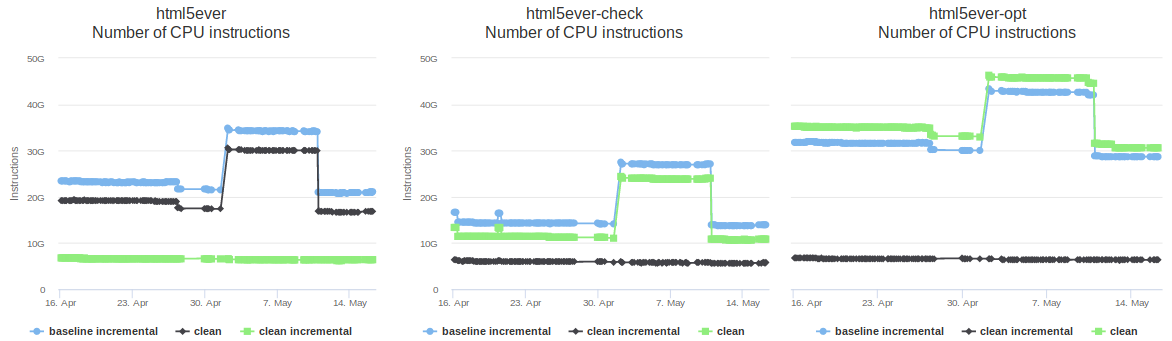
A lot of programs have broadly similar profiles, but occasionally you get an odd one that stresses a different part of the compiler. For example, in rustc-benchmarks, inflate-0.1.0 is dominated by operations involving the (delighfully named) ObligationsForest (see #36993), and html5ever-2016-08-25 is dominated by what I think is macro processing. So it’s worth profiling the compiler on new codebases.

Caveat lector

I’m still a newcomer to Rust development. Although I’ve had lots of help on the #rustc IRC channel — big thanks to eddyb and simulacrum in particular — there may be things I am doing wrong or sub-optimally. Nonetheless, I hope this is a useful starting point for newcomers who want to speed up the Rust compiler.

Categories
about:memory Firefox Memory consumption Rust Servo

Measuring data structure sizes: Firefox (C++) vs. Servo (Rust)

Firefox’s about:memory page presents fine-grained measurements of memory usage. Here’s a short example.

725.84 MB (100.0%) -- explicit
├──504.36 MB (69.49%) -- window-objects
│ ├──115.84 MB (15.96%) -- top(https://treeherder.mozilla.org/#/jobs?repo=mozilla-inbound, id=2147483655)
│ │ ├───85.30 MB (11.75%) -- active
│ │ │ ├──84.75 MB (11.68%) -- window(https://treeherder.mozilla.org/#/jobs?repo=mozilla-inbound)
│ │ │ │ ├──36.51 MB (05.03%) -- dom
│ │ │ │ │ ├──16.46 MB (02.27%) ── element-nodes
│ │ │ │ │ ├──13.08 MB (01.80%) ── orphan-nodes
│ │ │ │ │ └───6.97 MB (00.96%) ++ (4 tiny)
│ │ │ │ ├──25.17 MB (03.47%) -- js-compartment(https://treeherder.mozilla.org/#/jobs?repo=mozilla-inbound)
│ │ │ │ │ ├──23.29 MB (03.21%) ++ classes
│ │ │ │ │ └───1.87 MB (00.26%) ++ (7 tiny)
│ │ │ │ ├──21.69 MB (02.99%) ++ layout
│ │ │ │ └───1.39 MB (00.19%) ++ (2 tiny)
│ │ │ └───0.55 MB (00.08%) ++ window(https://login.persona.org/communication_iframe)
│ │ └───30.54 MB (04.21%) ++ js-zone(0x7f131ed6e000)

A typical about:memory invocation contains many thousands of measurements. Although they can be hard for non-experts to interpret, they are immensely useful to Firefox developers. For this reason, I’m currently implementing a similar system in Servo, which is a next-generation browser engine that’s implemented in Rust. Although the implementation in Servo is heavily based on the Firefox implementation, Rust has some features that make the Servo implementation a lot nicer than the Firefox implementation, which is written in C++. This blog post is a deep dive that explains how and why.

Measuring data structures in Firefox

A lot of the measurements done for about:memory are of heterogeneous data structures that live on the heap and contain pointers. We want such data structures to be able to measure themselves. Consider the following simple example.

struct CookieDomainTuple
{
  nsCookieKey key;
  nsRefPtr<nsCookie> cookie;
 
  size_t SizeOfExcludingThis(mozilla::MallocSizeOf aMallocSizeOf) const;
};

The things to immediately note about this type are as follows.

  • The details of nsCookieKey and nsCookie don’t matter here.
  • nsRefPtr is a smart pointer type.
  • There is a method, called SizeOfExcludingThis, for measuring the size of a CookieDomainTuple.

That measurement method has the following form.

size_t
CookieDomainTuple::SizeOfExcludingThis(MallocSizeOf aMallocSizeOf) const
{
  size_t amount = 0;
  amount += key.SizeOfExcludingThis(aMallocSizeOf);
  amount += cookie->SizeOfIncludingThis(aMallocSizeOf);
  return amount;
}

Things to note here are as follows.

  • aMallocSizeOf is a pointer to a function that takes a pointer to a heap block and returns the size of that block in bytes. Under the covers it’s implemented with a function like malloc_usable_size. Using a function like this is superior to computing the size analytically, because (a) it’s less error-prone and (b) it measures the actual size of heap blocks, which is often larger than the requested size because heap allocators round up some request sizes. It will also naturally measure any padding between members.
  • The two data members are measured by invocations to size measurement methods that they provide.
  • The first of these is called SizeOfExcludingThis. The “excluding this” here is necessary because key is an nsCookieKey that sits within a CookieDomainTuple. We don’t want to measure the nsCookieKey struct itself, just any additional heap blocks that it has pointers to.
  • The second of these is called SizeOfIncludingThis. The “including this” here is necessary because cookie is just a pointer to an nsCookie struct, which we do want to measure, along with any additional heap blocks it has pointers to.
  • We need to be careful with these calls. If we call SizeOfIncludingThis when we should call SizeOfExcludingThis, we’ll likely get a crash due to calling aMallocSizeOf on a non-heap pointer. And if we call SizeOfExcludingThis when we should call SizeOfIncludingThis, we’ll miss measuring the struct.
  • If this struct had a pointer to a raw heap buffer — e.g. a char* member — it would measure it by calling aMallocSizeOf directly on the pointer.

With that in mind, you can see that this method is itself a SizeOfExcludingThis method, and indeed, it doesn’t measure the memory used by the struct instance itself. A method that did include that memory would look like the following.

size_t
CookieDomainTuple::SizeOfIncludingThis(MallocSizeOf aMallocSizeOf)
{ 
  return aMallocSizeOf(this) + SizeOfExcludingThis(aMallocSizeOf);
}

All it does is measure the CookieDomainTuple struct itself — i.e. this — and then call the SizeOfExcludingThis method, which measures all child structures.

There are a few other wrinkles.

  • Often we want to ignore a data member. Perhaps it’s a scalar value, such as an integer. Perhaps it’s a non-owning pointer to something and that thing would be better measured as part of the measurement of another data structure. Perhaps it’s something small that isn’t worth measuring. In these cases we generally use comments in the measurement method to explain why a field isn’t measured, but it’s easy for these comments to fall out-of-date. It’s also easy to forget to update the measurement method when a new data member is added.
  • Every SizeOfIncludingThis method body looks the same: return aMallocSizeOf(this) + SizeOfExcludingThis(aMallocSizeOf);
  • Reference-counting complicates things, because you end up with pointers that conceptually own a fraction of another structure.
  • Inheritance complicates things.

(The full documentation goes into more detail.)

Even with all the wrinkles, it all works fairly well. Having said that, there are a lot of SizeOfExcludingThis and SizeOfIncludingThis methods that are boilerplate-y and tedious to write.

Measuring data structures in SERVO

When I started implementing a similar system in Servo, I naturally followed a similar design. But I soon found I was able to improve upon it.

With the same functions defined for lots of types, it was natural to define a Rust trait, like the following.

pub trait HeapSizeOf { 
  fn size_of_including_self(&self) -> usize;
  fn size_of_excluding_self(&self) -> usize; 
}

Having to repeatedly define size_of_including_self when its definition always looks the same is a pain. But heap pointers in Rust are handled via the parameterized Box type, and it’s possible to implement traits for this type. This means we can implement size_of_excluding_this for all Box types — thus removing the need for size_of_including_this — in one fell swoop, as the following code shows.

impl<T: HeapSizeOf> HeapSizeOf for Box<T> {
  fn size_of_excluding_self(&self) -> usize {
    heap_size_of(&**self as *const T as *const c_void) + (**self).size_of_excluding_self()
  }
}

The pointer manipulations are hairy, but basically it says that if T implements the HeapSizeOf trait, then we can measure Box<T> by measuring the T struct itself (via heap_size_of, which is similar to the aMallocSizeOf function in the Firefox example), and then measuring the things hanging off T (via the size_of_excluding_self call). Excellent!

With the including/excluding distinction gone, I renamed size_of_excluding_self as heap_size_of_children, which I thought communicated the same idea more clearly; it seems better for the name to describe what it is measuring rather than what it is not measuring.

But there was still a need for a lot of tedious boilerplate code, as this example shows.

pub struct DisplayList {
  pub background_and_borders: LinkedList<DisplayItem>,
  pub block_backgrounds_and_borders: LinkedList<DisplayItem>,
  pub floats: LinkedList<DisplayItem>,
  pub content: LinkedList<DisplayItem>,
  pub positioned_content: LinkedList<DisplayItem>,
  pub outlines: LinkedList<DisplayItem>,
  pub children: LinkedList<Arc<StackingContext>>,
}

impl HeapSizeOf for DisplayList {
  fn heap_size_of_children(&self) -> usize {
    self.background_and_borders.heap_size_of_children() +
    self.block_backgrounds_and_borders.heap_size_of_children() +
    self.floats.heap_size_of_children() +
    self.content.heap_size_of_children() +
    self.positioned_content.heap_size_of_children() +
    self.outlines.heap_size_of_children() +
    self.children.heap_size_of_children()
  }
}

However, the Rust compiler has the ability to automatically derive implementations for some built-in traits. Even better, the compiler lets you write plug-ins that do arbitrary transformations of the syntax tree, which makes it possible to write a plug-in that does the same for non-built-in traits on request. And the delightful Manish Goregaokar has done exactly that. This allows the example above to be reduced to the following.

#[derive(HeapSizeOf)]
pub struct DisplayList {
  pub background_and_borders: LinkedList<DisplayItem>,
  pub block_backgrounds_and_borders: LinkedList<DisplayItem>,
  pub floats: LinkedList<DisplayItem>,
  pub content: LinkedList<DisplayItem>,
  pub positioned_content: LinkedList<DisplayItem>,
  pub outlines: LinkedList<DisplayItem>,
  pub children: LinkedList<Arc<StackingContext>>,
}

The first line is an annotation that triggers the plug-in to do the obvious thing: generate a heap_size_of_children definition that just calls heap_size_of_children on all the struct fields. Wonderful!

But you may remember that I mentioned that sometimes in Firefox’s C++ code we want to ignore a particular member. This is also true in Servo’s Rust code, so the plug-in supports an ignore_heap_size annotation which can be applied to any field in the struct definition; the plug-in will duly ignore any such field.

If a new field is added which has a type for which HeapSizeOf has not been implemented, the compiler will complain. This means that we can’t add a new field to a struct and forget to measure it. The ignore_heap_size_of annotation also requires a string argument, which (by convention) holds a brief explanation why the member is ignored, as the following example shows.

#[ignore_heap_size_of = "Because it is a non-owning reference."]
pub image: Arc<Image>,

(An aside: the best way to handle Arc is an open question. If one of the references is clearly the owner, it probably makes sense to count the full size for that one reference. Otherwise, it is probably best to divide the size equally among all the references.)

The plug-in also has a known_heap_size_of! macro that lets us easily dictate the heap size of built-in types (such as integral types, whose heap size is zero). This works because Rust allows implementations of custom traits for built-in types. It provides additional uniformity because built-in types don’t need special treatment. The following line says that all the built-in signed integer types have a heap_size_of_children value of zero.

known_heap_size_of!(0, i8, i16, i32, i64, isize);

Finally, if there is a type for which the measurement needs to do something more complicated, we can still implement heap_size_of_children manually.

Conclusion

The Servo implementation is much nicer than the Firefox implementation, in the following ways.

  •  There is no need for an including/excluding split thanks to trait implementations on Box. This avoids boilerplate some code and makes it impossible to accidentally call the wrong method.
  • Struct fields that use built-in types are handled the same way as all others, because Rust trait implementations can be defined for built-in types.
  • Even more boilerplate is avoided thanks to the compiler plug-in that auto-derives HeapSizeOf implementations; it can even ignore fields.
  • For ignored fields, the required string parameter makes it impossible to forget to explain why the field is ignored.

These are possible due to several powerful language and compiler features of Rust that C++ lacks. There may be some C++ features that could improve the Firefox code — and I’d love to hear suggestions — but it’s never going to be as nice as the Rust code.

Categories
Rust Servo

Dipping my toes in the Servo waters

I’m very interested in Rust and Servo, and have been following their development closely. I wanted to actually do some coding in Rust, so I decided to start making small contributions to Servo.

At this point I have landed two changes in the tree — one to add very basic memory measurements for Linux, and the other for Mac — and I thought it might be interesting for people to hear about the basics of contributing. So here’s a collection of impressions and thoughts in no particular order.

Getting the code and building Servo was amazingly easy. The instructions actually worked first time on both Ubuntu and Mac! Basically it’s just apt-get install (on Ubuntu) or port install (on Mac), git clone, configure, and make. The configure step takes a while because it downloads an appropriate version of Rust, but that’s fine; I was expecting to have to install the appropriate version of Rust first so I was pleasantly surprised.

Once you build it, Servo is very bare-boned. Here’s a screenshot.

Servo

There is no address bar, or menu bar, or chrome of any kind. You simply choose which page you want to display from the command line when you start Servo. The memory profiling I implemented is enabled by using the -m option, which causes memory measurements to be periodically printed to the console.

Programming in Rust is interesting. I’m not the first person to observe that, compared to C++, it takes longer to get your code past the compiler, but it’s more likely to to work once you do. It reminds me a bit of my years programming in Mercury (imagine Haskell, but strict, and with a Prolog ancestry). Discriminated unions, pattern matching, etc. In particular, you have to provide code to handle all the error cases in place. Good stuff, in my opinion.

One thing I didn’t expect but makes sense in hindsight: Servo has seg faulted for me a few times. Rust is memory-safe, and so shouldn’t crash like this. But Servo relies on numerous libraries written in C and/or C++, and that’s where the crashes originated.

The Rust docs are a mixed bag. Libraries are pretty well-documented, but I haven’t seen a general language guide that really leaves me feeling like I understand a decent fraction of the language. (Most recently I read Rust By Example.) This is meant to be an observation rather than a complaint; I know that it’s a pre-1.0 language, and I’m aware that Steve Klabnik is now being paid by Mozilla to actively improve the docs, and I look forward to those improvements.

The spotty documentation isn’t such a problem, though, because the people in the #rust and #servo IRC channels are fantastic. When I learned Python last year I found that simply typing “how to do X in Python” into Google almost always leads to a Stack Overflow page with a good answer. That’s not the case for Rust, because it’s too new, but the IRC channels are almost as good.

The code is hosted on GitHub, and the project uses a typical pull request model. I’m not a particularly big fan of git — to me it feels like a Swiss Army light-sabre with a thousand buttons on the handle, and I’m confident using about ten of those buttons. And I’m also not a fan of major Mozilla projects being hosted on GitHub… but that’s a discussion for another time. Nonetheless, I’m sufficiently used to the GitHub workflow from working on pdf.js that this side of things has been quite straightforward.

Overall, it’s been quite a pleasant experience, and I look forward to gradually helping build up the memory profiling infrastructure over time.