Developers got their first glimpse at detailed statistics for their add-ons in early 2008 when we launched the Developer Statistics Dashboard for every add-on hosted on AMO. Since then, we’ve made incremental improvements to this tool, such as adding grouping and comparison options, data tables, locale usage stats, contributions, and most recently download sources.
In July, we asked developers to take a survey about how they use the Statistics Dashboard, and as part of our AMO rewrite currently underway, we’ll be revamping the dashboard.
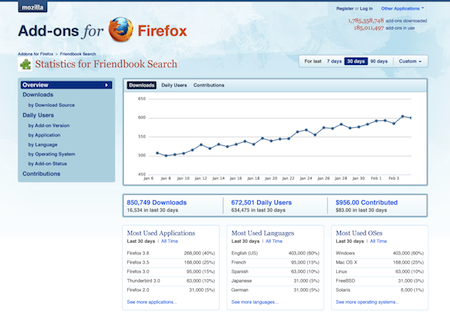
Here’s a mockup from our designer, Chris Howse, of the overview page of the new dashboard:
A few comments on the new design:
- Our main goal was to simplify the dashboard and present the most common things developers are looking for up front, answering questions like “which application versions is my add-on used with?” and “how many people use my add-on on Mac?”
- Each of the breakdown pages will have its own URL and be linked to directly, eliminating the annoying dropdown menu currently used
- We’ll be replacing the Timeplot graphs with nicer, less buggy graphs using Highcharts
- Most of the features of the new dashboard exist in the current dashboard, but this will create a much better platform and layout for us to add additional features after the rewrite. We already have some great ideas to implement at that time.
You can see the rest of the mockups and design discussion in bug 540885 and implementation in bug 543548.

Antonin Hildebrand wrote on
Axel Grude wrote on
Norman wrote on