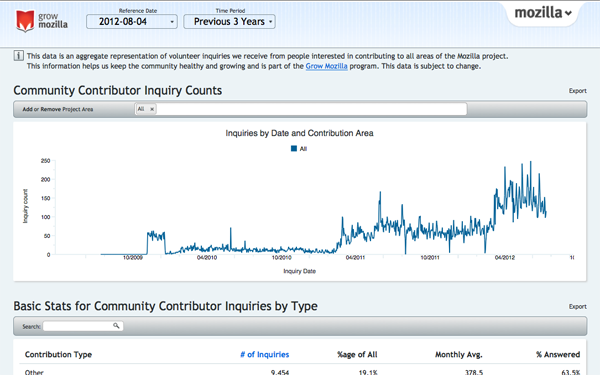
We recently launched a dashboard at arewegrowingyet.com that provides information from the Get Involved page about people who want to contribute to Mozilla. Each day around 200 people express interest in contributing.
This is useful information, but getting visibility into how many people want to get involved and what they want to contribute to is just part of the data we need about the growth and health of the community.
To make sure we’re able to bring new contributors in and have them become core members of teams, we also need data about what happens after someone starts to get involved. For that, we’re mapping out contribution paths for different project areas.
For instance, this is the path for how to get involved with coding projects. These paths will help us create additional dashboards, such as the patch map and patch trends dashboards.
Measuring participation will let us identify and fix roadblocks throughout a contributor’s life cycle and will let Mozilla do more by bringing more people in and allowing them to be more effective.
Thanks to the Metrics team for creating arewegrowingyet.com. Stay tuned for more information about other community data projects in the works.

