(“This Week in Glean” is a series of blog posts that the Glean Team at Mozilla is using to try to communicate better about our work. They could be release notes, documentation, hopes, dreams, or whatever: so long as it is inspired by Glean.)
All “This Week in Glean” blog posts are listed in the TWiG index (and on the Mozilla Data blog).
Every Monday the Glean has its weekly Glean SDK meeting. This meeting is used for 2 main parts: First discussing the features and bugs the team is currently investigating or that were requested by outside stakeholders. And second bug triage & monitoring of data that Glean reports in the wild.
Most of the time looking at our monitoring is boring and that’s a good thing.
From the beginning the Glean SDK supported extensive error reporting on data collected by the framework inside end-user applications. Errors are produced when the application tries to record invalid values. That could be a negative value for a counter that should only ever go up or stopping a timer that was never started. Sometimes this comes down to a simple bug in the code logic and should be fixed in the implementation. But often this is due to unexpected and surprising behavior of the application the developers definitely didn’t think about. Do you know all the ways that your Android application can be started? There’s a whole lot of events that can launch it, even in the background, and you might miss instrumenting all the right parts sometimes. Of course this should then also be fixed in the implementation.
Monitoring Firefox for Android
For our weekly monitoring we look at one application in particular: Firefox for Android. Because errors are reported in the same way as other metrics we are able to query our database, aggregate the data by specific metrics and errors, generate graphs from it and create dashboards on our instance of Redash.

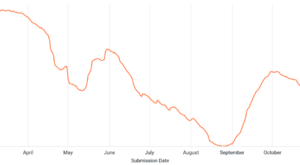
The above graph displays error counts for different metrics. Each line is a specific metric and error (such as Invalid Value or Invalid State). The exact numbers are not important. What we’re interested in is the general trend. Are the errors per metrics stable or are there sudden jumps? Upward jumps indicate a problem, downward jumps probably means the underlying bug got fixed and is finally rolled out in an update to users.

We have another graph that doesn’t take the raw number of errors, but averages it across the entire population. A sharp increase in error counts sometimes comes from a small number of clients, whereas the errors for others stay at the same low-level. That’s still a concern for us, but knowing that a potential bug is limited to a small number of clients may help with finding and fixing it. And sometimes it’s really just bogus client data we get and can dismiss fully.
Most of the time these graphs stay rather flat and boring and we can quickly continue with other work. Sometimes though we can catch potential issues in the first days after a rollout.

In this graph from the nightly release of Firefox for Android two metrics started reporting a number of errors that’s far above any other error we see. We can then quickly find the implementation of these metrics and report that to the responsible team (Filed bug, and the remediation PR).
But can’t that be automated?
It probably can! But it requires more work than throwing together a dashboard with graphs. It’s also not as easy to define thresholds on these changes and when to report them. There’s work underway that hopefully enables us to more quickly build up these dashboards for any product using the Glean SDK, which we can then also extend to do more reporting automated. The final goal should be that the product teams themselves are responsible for monitoring their data.


