In our last post we delved into the rudimentary dynamics of the “browser session,” defined as a continuous period of user activity in the browser, where successive events are separated by no more than 30 minutes.
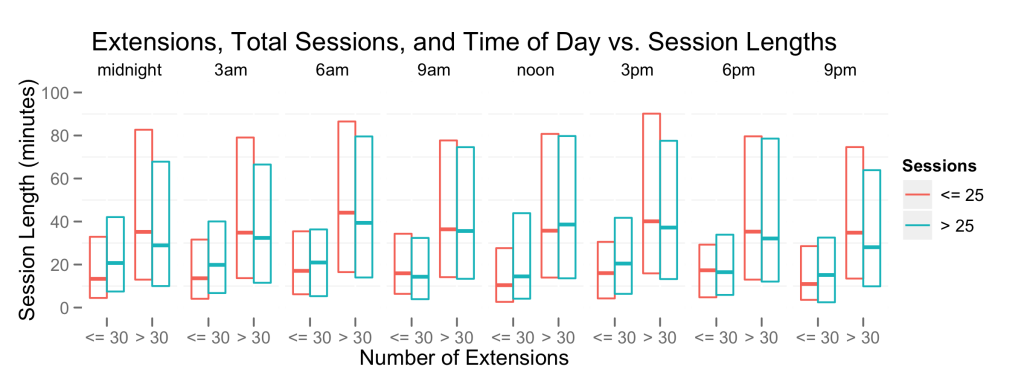
In this short post we’ll discuss another way of cutting the data. Below is the plot. For reference, each crossbar contains the 1st and 3rd quartile, along with the median.
A few insights regarding the plot:
- Users with more extensions have longer and more varied session times than those with fewer.
- Extensions in general do a better job of discriminating user behavior than the number of sessions.
- These trends tend to hold over the course of the day, with only minor fluctuations.

Donnie Berkholz wrote on
: