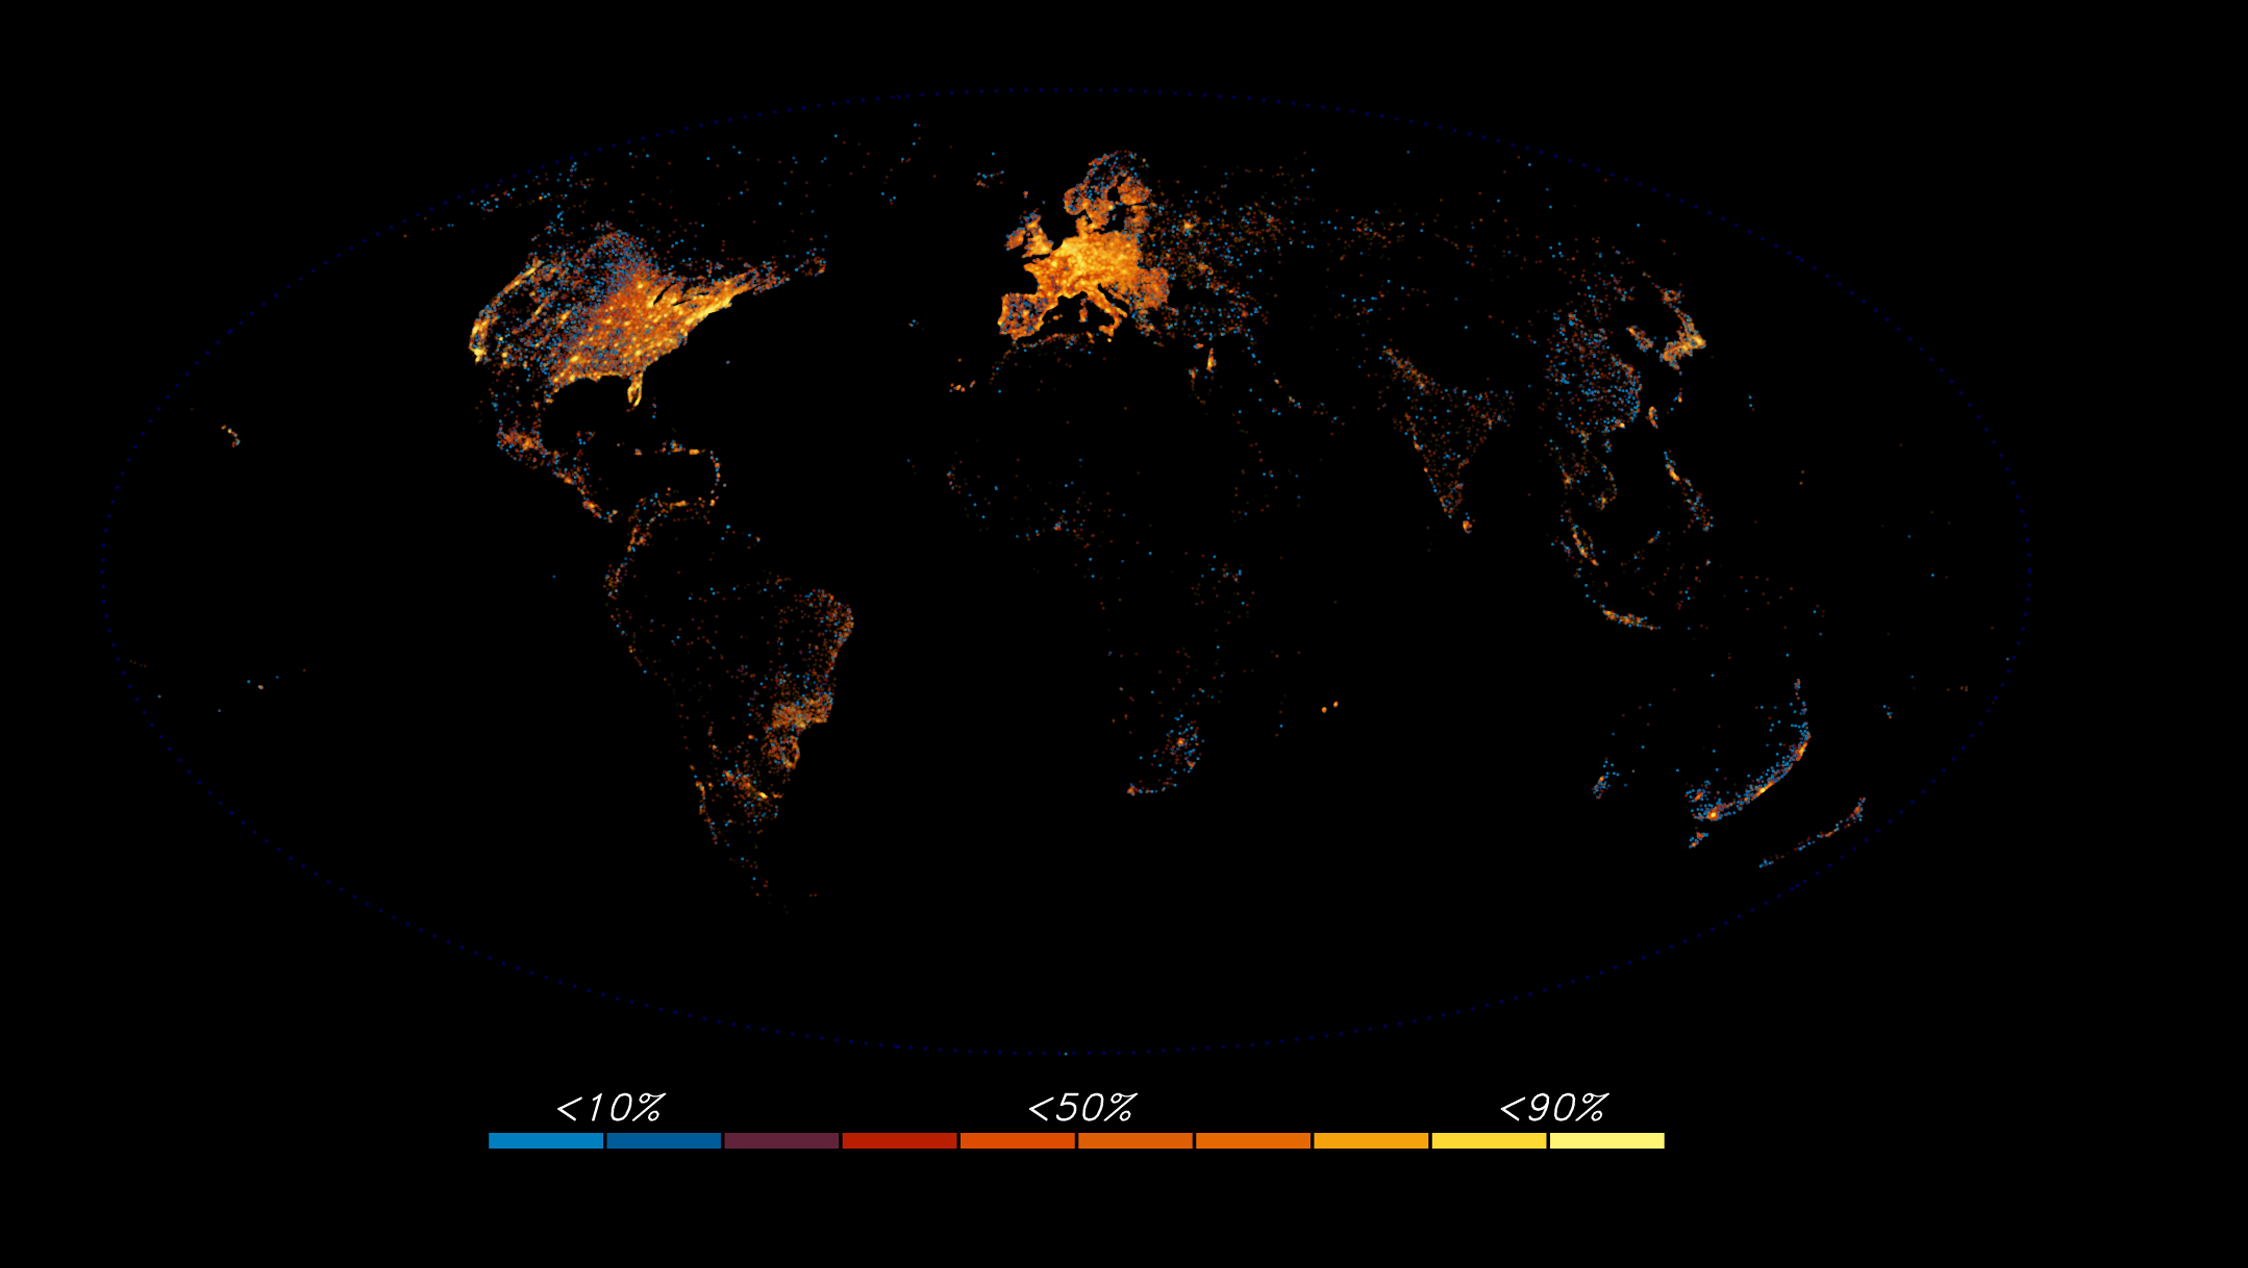
After a marathon Firefox 4 download ( 15.85 MM, see http://blog.mozilla.org/blog/2011/03/25/the-first-48-hours-of-mozilla-firefox-4/ ) we prepared a location intensity graph. Figure 1 displays the cities by frequency of download (independent of how many downloads though the two are strongly related). Blue is infrequent to very few (bottom 10%), bright yellow is many (top 10%).

Figure 1. Location intensity of cities. Blue is rare, bright yellow is high.
Though the above picture is heartwarming at the same time it is disappointing. There are swaths of the world pitch black. The location information is constrained by the accuracy of the geo-location service but that is also related to internet penetration. With Internet access rapidly becoming (in the not too distant future) a public utility, it is sad that the ‘have not’s have one more item on the list.
Based on reader input I’ve attached a large (2248 × 1268, 1.1MB) PNG file.Click here to download.
Sam wrote on
:
wrote on
:
Adam Harvey wrote on
:
wrote on
:
Axel Hecht wrote on
:
wrote on
:
Sam wrote on
:
wrote on
:
James John Malcolm wrote on
:
wrote on
:
Mike Ratcliffe wrote on
:
wrote on
:
Michael Gaigg wrote on
:
wrote on
:
Saptarshi Guha wrote on
:
wrote on
:
Marco Seiz wrote on
:
wrote on
:
UAE Web Design wrote on
:
wrote on
: