Categories
Performance Rust

How to speed up the Rust compiler one last time in 2019

I last wrote in October about my work on speeding up the Rust compiler. With the year’s end approaching, it’s time for an update.

Doc comments

#65750: Normal comments are stripped out during parsing and not represented in the AST. But doc comments have semantic meaning (`/// blah` is equivalent to the attribute #[doc="blah"]) and so must be represented explicitly in the AST. Furthermore:

  • In a multi-line doc comment using /// or //! comment markers every separate line is treated as a separate attribute;
  • Multi-line doc comments using /// and //! markers are very common, much more so than those using /** */ or /*! */ markers, particularly in the standard library where doc comment lines often outnumber code lines;
  • The AST representation of attributes is quite expensive, partly because it retains the original tokens for complex reasons involving procedural macros.

As a result, doc comments had a surprisingly high cost. This PR introduced a special, cheaper representation for doc comments, giving wins on many benchmarks, some in excess of 10%.

Token streams

#65455: This PR avoided some unnecessary conversions from TokenTree type to the closely related TokenStream type, avoiding allocations and giving wins on many benchmarks of up to 5%. It included one of the most satisfying commits I’ve made to rustc.

Screenshot of the satisfying commit, as viewed on GitHub

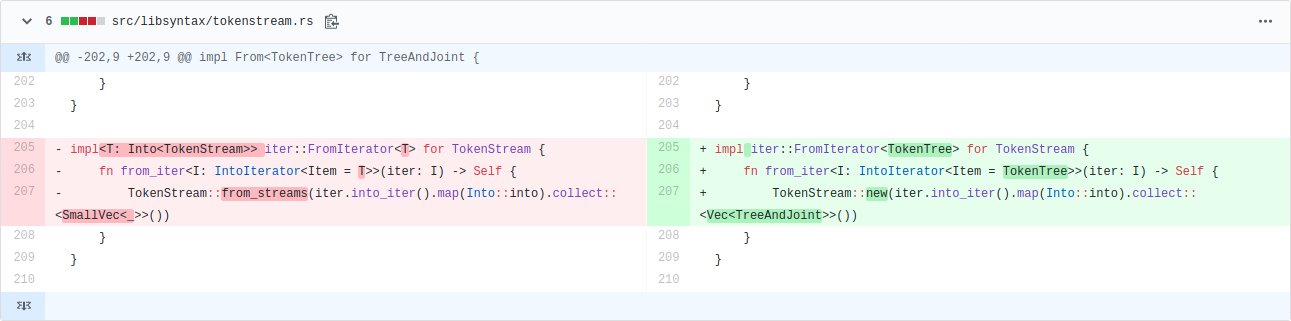
Up to 5% wins by changing only three lines. But what intricate lines they are! There is a lot going on, and they’re probably incomprehensible to anyone not deeply familiar with the relevant types. My eyes used to just bounce off those lines. As is typical for this kind of change, the commit message is substantially longer than the commit itself.

It’s satisfying partly because it shows my knowledge of Rust has improved, particularly Into and iterators. (One thing I worked out along the way: collect is just another name for FromIterator::from_iter.) Having said that, now that a couple of months have passed, it still takes me effort to remember how those lines work.

But even more so, it’s satisfying because it wouldn’t have happened had I not repeatedly simplified the types involved over the past year. They used to look like this:

pub struct TokenStream { kind: TokenStreamKind };
pub enum TokenStreamKind {
    Empty,
    Tree(TokenTree),
    JointTree(TokenTree),
    Stream(RcVec<TokenStream>),
}

(Note the recursion!)

After multiple simplifying PRs (#56737, #57004, #57486, #58476, #65261), they now look like this:

pub struct TokenStream(pub Lrc<Vec<TreeAndJoint>>);
pub type TreeAndJoint = (TokenTree, IsJoint);
pub enum IsJoint { Joint, NonJoint }

(Note the lack of recursion!)

I didn’t set out to simplify the type for speed, I just found it ugly and confusing. But now it’s simple enough that understanding and optimizing intricate uses is much easier. When those three lines appeared in a profile, I could finally understand them. Refactoring FTW!

(A third reason for satisfaction: I found the inefficiency using the improved DHAT I worked on earlier this year. Hooray for nice tools!)

#65641: This was a nice follow-on from the previous PR. TokenStream had custom impls of the RustcEncodable/RustcDecodable traits. These were necessary when TokenStream was more complicated, but now that it’s much simpler the derived impls suffice. As well as simplifying the code, the PR won up to 3% on some benchmarks because the custom impls created some now-unnecessary intermediate structures.

#65198: David Tolnay reported that basic concatenation of tokens, as done by many procedural macros, could be exceedingly slow, and that operating directly on strings could be 100x faster. This PR removed quadratic behaviour in two places, both of which duplicated a token vector when appending a new token. (Raise a glass to the excellent Rc::make_mut function, which I used in both cases.) The PR gave some very small (< 1%) speed-ups on the standard benchmarks but sped up a microbenchmark that exhibited the problem by over 1000x, and made it practical for procedural benchmarks to use tokens. I also added David’s microbenchmark to rustc-perf to avoid future regressions.

unicode_normalization

#65260: This PR added a special-case check to skip an expensive function call in a hot function, giving a 7% win on the unicode_normalization benchmark.

#65480: LexicalResolver::iterate_until_fixed_point() was a hot function that iterated over some constraints, gradually removing them until none remain. The constraints were stored in a SmallVec and retain was used to remove the elements. This PR (a) changed the function so it stored the constraints in an immutable Vec and then used a BitSet to record which which constraints were still live, and (b) inlined the function at its only call site. These changes won another 7% on unicode_normalization, but only after I had sped up BitSet iteration with some micro-optimizations in #65425.

#66537: This PR moved an expensive function call after a test and early return that is almost always taken, giving a 2% win on unicode_normalization.

Miscellanous

#66408: The ObligationForest type has a vector of obligations that it processes in a fixpoint manner. Each fixpoint iteration involves running an operation on every obligation, which can cause new obligations to be appended to the vector. Previously, newly-added obligations would not be considered until the next fixpoint iteration. This PR changed the code so it would consider those new obligations in the iteration in which they were added, reducing the number of iterations required to reach a fixpoint, and winning up to 8% on a few benchmarks.

#66013: The Rust compiler is designed around a demand-driven query system. Query execution is memoized: when a query is first invoked the compiler will perform the computation and store the result in a hash table, and on subsequent invocations the compiler will return the result from the hash table. For the parallel configuration of rustc this hash table experiences a lot of contention, and so it is sharded; each query lookup has two parts, one to get the shard, and one within the shard. This PR changed things so that the key was only hashed once and the hash value reused for both parts of the lookup, winning up to 3% on the single-threaded configuration of parallel compiler. (It had no benefit for the non-parallel compiler, which is what currently ships, because it does not use sharding.)

#66012: This PR removed the trivial_dropck_outlives query from the query system because the underlying computation is so simple that it is faster to redo it whenever necessary than to look up the result in the query hash table. This won up to 1% on some benchmarks, and possibly more for the parallel compiler, due to the abovementioned contention over the query hash table.

#65463: The function expand_pattern() caused many arena allocations where a 4 KiB arena chunk was allocated that only ever held a single small and short-lived allocation. This PR avoided these, reducing the number of bytes allocated by up to 2% for various benchmarks, though the effect on runtime was minimal.

#66540 – This PR changed a Vec to a SmallVec in Candidate::match_pairs, reducing allocation rates for a tiny speed win.

symbols

The compiler has an interned string type called Symbol that is widely used to represent identifiers and other strings. The compiler also had two variants of that type, confusingly called InternedString and LocalInternedString. In a series of PRs (#65426, #65545, #65657, #65776) I removed InternedString and minimized the functionality and uses of LocalInternedString (and also renamed it as SymbolStr). This was made possible by Matthew Jasper’s work  eliminating gensyms. The changes won up to 1% on various benchmarks, but the real benefit was code simplicity, as issue #60869 described. Like the TokenStream type I mentioned above, these types had annoyed me for some time, so it was good to get them into a nicer state.

Progress

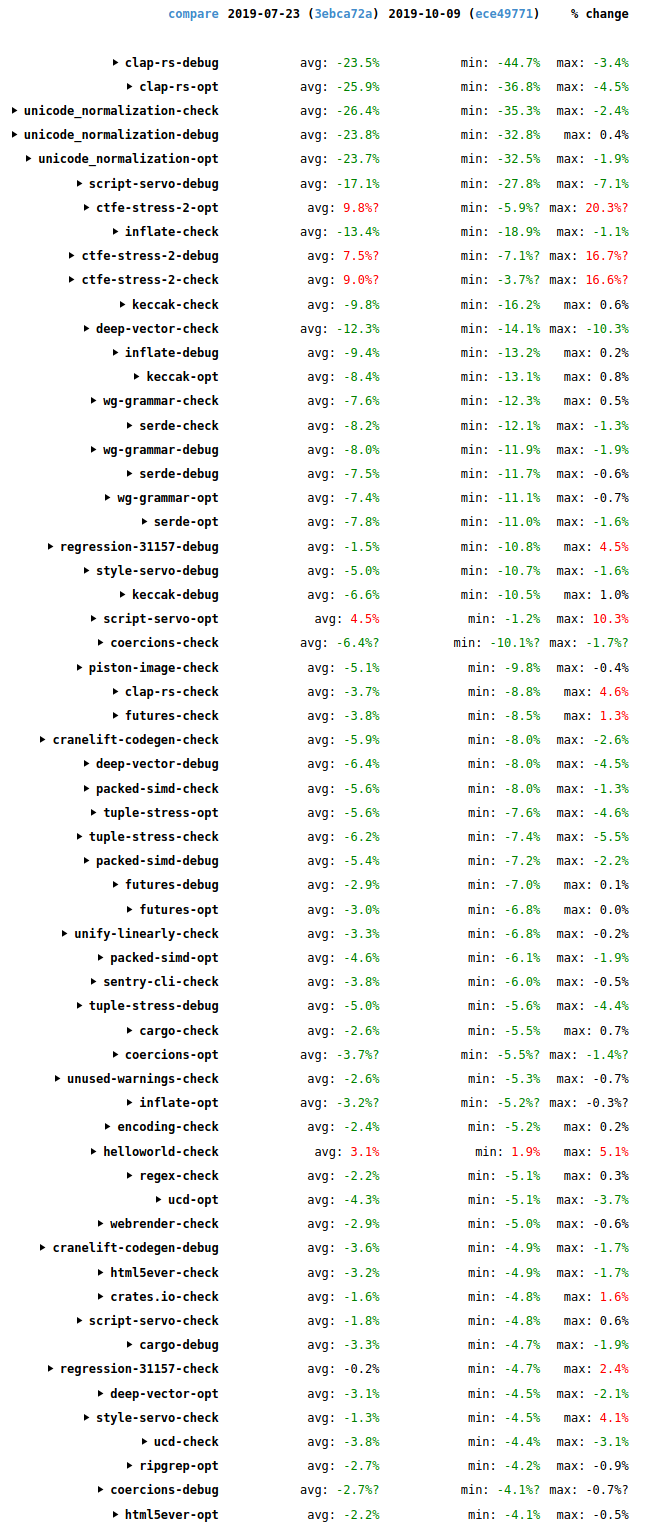
The storage of historical benchmark data changed recently, which (as far as I can tell) makes comparisons to versions earlier than early November difficult. Nonetheless, wall-time results for the past month (2019-11-07 to 2019-12-08) cover the second half of that period, and they are generally good, as the following screenshot shows.

Walltime results from perf.rust-lang.org showing lots of benchmark improvements

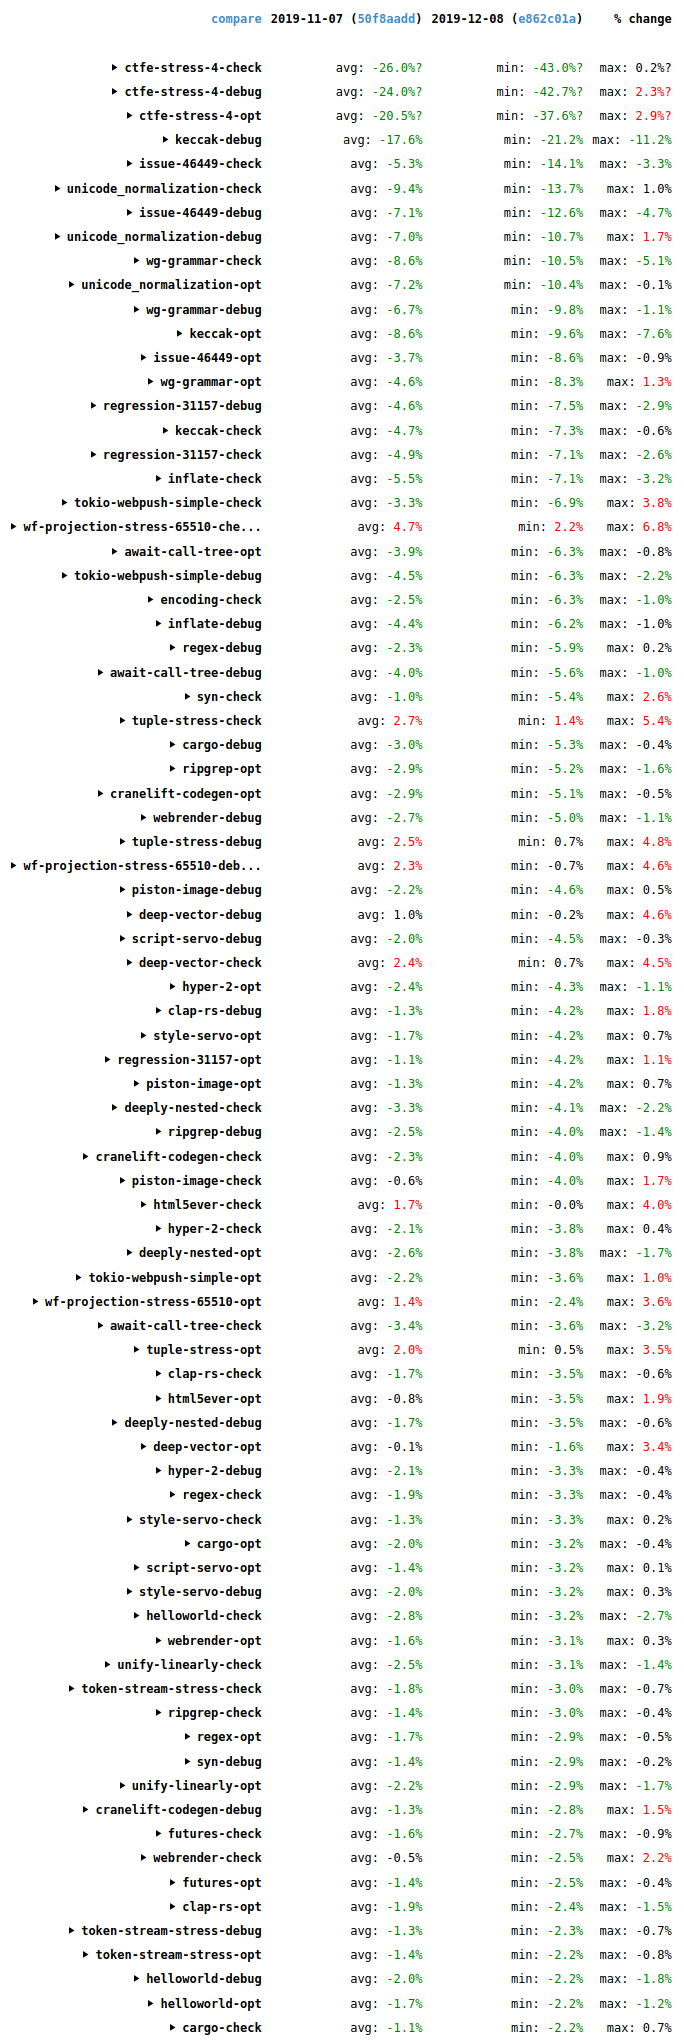
Overall, lots of improvements (green), some in the double digits, and only a small number of regressions (red). It’s a good trend, and it’s not just due to the PRs mentioned above.  For example, MIR constant propagation won 2-10% in a lot of cases. It duplicates an optimization that LLVM also does, but performs it earlier in the pipeline when there’s less code. This saves time because it makes LLVM’s job easier, and it also helps the code quality of debug builds where the LLVM constant propagation isn’t run.

Final words

All of the above improvements (and most of the ones in my previous posts) I found by profiling with Cachegrind, Callgrind, DHAT, and counts, but there are plenty of other profilers out there. I encourage anyone who has interest and even slight familiarity with profiling (or a willingness to learn) to give it a try. The Rust compiler is an easy target, profiling-wise, because it’s a batch program that is mostly single-threaded and almost deterministic. (Compare it to Firefox, for example, which is interactive, multi-threaded, and highly non-deterministic.) Give it a go!

Categories
Performance Rust

How to speed up the Rust compiler some more in 2019

In July I wrote about my efforts to speed up the Rust compiler in 2019. I also described how the Rust compiler has gotten faster in 2019, with compile time reductions of 20-50% on most benchmarks. Now that Q3 is finished it’s a good time to see how things have changed since then.

Speed improvements in Q3 2019

The following image shows changes in time taken to compile many of the standard benchmarks used on the Rust performance tracker. It compares a revision of the the compiler from 2019-07-23 with a revision of the compiler from 2019-10-09.

Screenshot of Rust compiler benchmark improvements for Q3

These are the wall-time results. There are three different build kinds measured for each one: a debug build, an optimized build, and a check build (which detects errors but doesn’t generate code). For each build kind there is a mix of incremental and non-incremental runs done. The numbers for the individual runs aren’t shown here but you can see them if you view the results directly on the site and click around. (Note that the site has had some reliability issues lately. Apologies if you have difficulty with that link.) The “avg” column shows the average change for those runs. The “min” and “max” columns show the minimum and maximum changes among those same runs.

There are a few regressions, mostly notably for the ctfe-stress-2 benchmark, which is an artificial stress test of compile-time function evaluation and so isn’t too much of a concern. But there are many more improvements, including double-digit improvements for clap-rs, inflate, unicode_normalization, keccak, wg-grammar, serde, deep-vector, script-servo, and style-servo. There have been many interesting things going on.

memcpy

For a long time, profilers like Cachegrind and Callgrind have shown that 2-6% of the instructions executed by the Rust compiler occur in calls to memcpy. This seems high! Curious about this, I modified DHAT to track calls to memcpy, much in the way it normally tracks calls to malloc.

The results showed that most of the memcpy calls come from a relatively small number of code locations. Also, all the memcpy calls involved values that exceed 128 bytes. It turns out that LLVM will use inline code for copies of values that are 128 bytes or smaller. (Inline code will generally be faster, but memcpy calls will be more compact above a certain copy size.)

I was able to eliminate some of these memcpy calls in the following PRs.

#64302: This PR shrank the ObligationCauseCode type from 56 bytes to 32 bytes by boxing two of its variants, speeding up many benchmarks by up to 2.6%. The benefit mostly came because the PredicateObligation type (which contains an ObligationCauseCode) shrank from 136 bytes to 112 bytes, which dropped it below the 128 byte memcpy threshold. I also tried reducing the size of ObligationCauseCode to 24 bytes by boxing two additional variants, but this had worse performance because more allocations were required.

#64374: The compiler’s parser has this type:

pub type PResult<'a, T> = Result<T, DiagnosticBuilder<'a>

It’s used as the return type for a lot of parsing functions. The T value is always small, but DiagnosticBuilder was 176 bytes, so PResult had a minimum size of  184 bytes. And DiagnosticBuilder is only needed when there is a parsing error, so this was egregiously inefficient. This PR boxed DiagnosticBuilder so that PResult has a minimum size of 16 bytes, speeding up a number of benchmarks by up to 2.6%.

#64394: This PR reduced the size of the SubregionOrigin type from 120 bytes to 32 bytes by boxing its largest variant, which sped up many benchmarks slightly (by less than 1%). If you are wondering why this type caused memcpy calls despite being less than 128 bytes, it’s because it is used in a BTreeMap and the tree nodes exceeded 128 bytes.

ObligationForest

One of the biggest causes of memcpy calls is within a data structure called ObligationForest, which represents a bunch of constraints (relating to type checking and trait resolution, I think) that take the form of a collection of N-ary trees. ObligationForest uses a single vector to store the tree nodes, and links between nodes are represented as numeric indices into that vector.

Nodes are regularly removed from this vector by a function called ObligationForest::compress. This operation is challenging to implement efficiently because the vector can contain thousands of nodes and nodes are removed only a few at a time, and order must be preserved, so there is a lot of node shuffling that occurs. (The numeric indices of all remaining nodes must be updated appropriately afterwards, which further constrains things.) The shuffling requires lots of  swap calls, and each one of those does three memcpy calls (let tmp = a; a = b; b = tmp, more or less). And each node is 176 bytes! While trying to get rid of these memcpy calls, I got very deep into ObligationForest and made the following PRs that aren’t related to the copying.

#64420: This PR inlined a hot function, speeding up a few benchmarks by up to 2.8%. The function in question is indirectly recursive, and LLVM will normally refuse to inline such functions. But I was able to work around this by using a trick: creating two variants of the function, one marked with #[inline(always)] (for the hot call sites) and one marked with #[inline(never)] (for the cold call sites).

#64500: This PR did a bunch of code clean-ups, some of which helped performance to the tune of up to 1.7%. The improvements came from factoring out some repeated expressions, and using iterators and retain instead of while loops in some places.

#64545: This PR did various things, improving performance by up to 13.8%. The performance wins came from: combining a split parent/descendants representation to avoid frequent chaining of iterators (chained iterators are inherently slower than non-chained iterators); adding a variant of the shallow_resolve function specialized for the calling pattern at a hot call site; and using explicit iteration instead of Iterator::all. (More about that last one below.)

#64627: This PR also did various things, improving performance by up to 18.4%. The biggest improvements came from: changing some code that dealt with a vector to special-case the 0-element and 1-element cases, which dominated; and inlining an extremely hot function (using a variant of the abovementioned #[inline(always)]#[inline(never)] trick).

These PRs account for most of the improvements to the following benchmarks: inflatekeccak, cranelift-codegen, and serde. Parts of the ObligationForest code was so hot for these benchmarks (especially inflate and keccak) that it was worth micro-optimizing them to the nth degree. When I find hot code like this, there are always two approaches: (a) try to speed it up, or (b) try to avoid calling it. In this case I did (a), but I do wonder if the users of ObligationForest could be more efficient in how they use it.

The above PRs are a nice success story, but I should also mention that I tried a ton of other micro-optimizations that didn’t work.

  • I tried drain_filter in compress. It was slower.
  • I tried several invasive changes to the data representation, all of which ended up slowing things down.
  • I tried using swap_and_remove instead of swap in compress, This gave speed-ups, but changed the order that predicates are processed in, which changed the order and/or contents of error messages produced in lots of tests. I was unable to tell if these error message changes were legitimate — some were simple, but some were not — so I abandoned all approaches that altered predicate order.
  • I tried boxing ObligationForest nodes, to reduce the number of bytes copied in compress. It reduced the amount of copying, but was a net slowdown because it increased the number of allocations performed.
  • I tried inlining some other functions, for no benefit.
  • I used unsafe code to remove the swap calls, but the speed-up was only 1% in the best case and I wasn’t confident that my code was panic-safe, so I abandoned that effort.
  • There were even a number of seemingly innocuous code clean-ups that I had to abandon because they hurt performance measurably. I think this is because the code is so hot in some benchmarks that even tiny changes can affect code generation adversely. (I generally use instruction counts rather than wall time to make these evaluations, because instruction counts have very low variance.)

Amusingly enough, the memcpy calls in compress were what started all this, and despite the big wins, I didn’t manage to get rid of them!

Inlining and code bloat

I mentioned above that in #64545 I got an improvement by replacing a hot call to Iterator::all with explicit iteration. The reason I tried this was that I looked at the implementation of Iterator::all and saw that it was surprisingly complicated: it wrapped the given predicate in a closure that
returned a LoopState, passed that closure to try_for_each which
wrapped the first closure in a second closure, and passed that second closure
to try_fold which did the actual iteration using the second
closure. Phew!

Just for kicks I tried replacing this complex implementation with the obvious, simple implementation, and got a small speed-up on keccak, which I was using for most of my performance testing. So I did the same thing for three similar Iterator methods (any, find and find_map), submitted #64572, and did a CI perf run. The results were surprising and extraordinary: 1-5% reductions for many benchmarks, but double-digits for some, and 20-50% reductions for some clap-rs runs. Uh, what? Investigation showed that the reduction came from LLVM doing less work during code generation. These functions are all marked with #[inline] and so the simpler versions result in less code for LLVM to process. Sure enough, the big wins all came in debug and opt builds, with little effect on check builds.

This surprised me greatly. There’s been a long-running theory that the LLVM IR produced by the Rust compiler’s front end is low quality, that LLVM takes a long time to optimize it, and more front-end optimization could speed up LLVM’s code generation. #64572 demonstrates a related, but much simpler prospect: we can speed up compilation by making commonly inlined library functions smaller. In hindsight, it makes sense that this would have an effect, but the size of the effect is nonetheless astounding to me.

But there’s a trade-off. Sometimes a simpler, smaller function is slower. For the iterator methods there are some cases where that is true, so the library experts were unwilling to land #64572 as is. Fortunately, it was possible to obtain much of the potential compile time improvements without compromising runtime.

  • In #64600, scottmcm removed an aggressive specialization of try_fold  for slices that had an unrolled loop that called the given closure four times. This got about 60% of the improvements of #64572.
  • In #64885, andjo403 simplified the four Iterator methods to call try_fold directly, removing one closure layer. This got about another 15% of the improvements of #64572.

I had a related idea, which was to use simpler versions for debug builds and complex versions for opt builds. I tried three different ways of doing this.

  • Use if cfg!(debug_assertions) within the method bodies.
  • Have two versions of each method, one marked with #[cfg(debug_assertions)], the other marked with #[cfg(not(debug_assertions))].
  • Mark each method with #[cfg_attr(debug_assertions, inline)] so that the methods are inlined only in optimized builds.

None of these worked; they either had little effect or made things worse. I’m hazy on the details of how library functions get incorporated; maybe there’s another way to make this idea work.

In a similar vein, Alex Crichton opened #64846, which changes hashbrown (Rust’s hash table implementation) so it is less aggressive about inlining. This got some sizeable improvements on some benchmarks (up to 18% on opt builds of cargo) but also caused small regressions for a lot of other benchmarks. In this case, the balance between “slower hash tables” and “less code to compile” is delicate, and a final decision is yet to be made.

Overall, this is an exciting new area of investigation for improving Rust compile times. We definitely want new tooling to help identify which library functions are causing the most code bloat. Hopefully these functions can be tweaked so that compile times improve without hurting runtime performance much.

Miscellaneous

As well as all the above stuff, which all arose due to my investigations into memcpy calls, I had a few miscellaneous improvements that arose from normal profiling.

#65089: In #64673, simulacrum got up to 30% wins on the unicode_normalization benchmark by special-casing a type size computation that is extremely hot. (That benchmark is dominated by large match expressions containing many integral patterns.) Inspired by this, in this PR I made a few changes that moved the special case to a slightly earlier point that avoided even more unnecessary operations, for wins of up to 11% on that same benchmark.

#64949: The following pattern occurs in a few places in the compiler.

let v = self.iter().map(|p| p.fold_with(folder)).collect::<SmallVec<[_; 8]>>()

I.e. we map some values into a SmallVec. A few of these places are very hot, and in most cases the number of elements produced is 0, 1, or 2. This PR changed those hot locations to handle one or more of the 0/1/2 cases directly without using iteration and SmallVec::collect, speeding up numerous benchmarks by up to 7.8%.

#64801: This PR avoided a chained iterator in a hot location, speeding up the wg-grammar benchmark by up to 1.9%.

Finally, in #64112 I tried making pipelinined compilation more aggressive by moving crate metadata writing before type checking and borrow checking. Unfortunately, it wasn’t much of a win, and it would slightly delay error message emission when compiling code with errors, so I abandoned the effort.

Categories
Performance Rust

Visualizing Rust compilation

Speeding up the Rust compiler isn’t the only way to make a Rust project build faster. Changing the crate structure of a project can also make a big difference. The good news here is that Eric Huss has implemented an amazing tool for visualizing Rust compilation, which can be used to identify inefficient crate structures in Rust projects.

The tool extremely easy to use. First, update to the latest Nightly:

rustup update nightly

Then just add -Ztimings to your build command, e.g.:

cargo +nightly build -Ztimings

At the end of the build it will print the name of an HTML file containing the data. Here’s part of the visualization for the Rust compiler itself:

Screenshot of -Ztimings output when compiling the Rust compiler

Full data is available here. (I recommend moving the “Scale” slider to 7 or 8 so that horizontal scrolling isn’t necessary.)

Two things leap out from this visualization.

  • The rustc crate takes about twice as long as any other crate to compile. It is the “long pole” of the build, and its presence serializes the build significantly. Breaking it up could improve compilation time quite a bit. I filed #65031 about this.
  • Pipelined compilation (released in Rust 1.38) is a huge win for the compiler itself. Pipelining allows a dependent crate to start building as soon as metadata is produced. In the visualization, this corresponds to point where the bar for a graph changes colour from light blue to purple. Imagine if the rustc crate had to finish before all the crates below it could even start! It used to take about 45 minutes for an optimized stage 2 build on my fast Linux desktop machine; thanks to pipelining it now takes about 26 minutes.

I also filed #65088 to add -Ztimings support to the Rust compiler’s own build system. (Enabling the visualization isn’t as simple for the compiler as it is for most Rust projects. The compiler’s build system is complicated by the fact that it’s a bootstrapping compiler that has to be built multiple times.)

We have already heard from multiple people that they used it fix inefficiencies in their crate structure, speeding up their builds significantly. Anyone who works on a sizeable Rust project should try out this tool.

Categories
Performance Rust

The Rust compiler is still getting faster

A key theme of the Rust 2019 roadmap is maturity. This covers a variety of topics, but a crucial one is compile times. For example, the roadmap itself has the following as the first main theme for the compiler team.

Improving “core strength” by lowering raw compilation times and also generating better code (which in turn can help with compilation times)

The roadmap explainer post has a “polish” section that has the following as the first example.

Compile times and IDE support

I previously wrote about one period of improvement in Rust compiler speed. How are things going in 2019?

Speed improvements in 2019

The following image shows changes in time taken to compile the standard benchmarks used on the Rust performance tracker. It compares the compiler from 2019-01-01 with the compiler from 2019-07-24 (the most recent data at the time of writing).

Table showing Rust compiler speedups between 2019-01-01 and 2019-07-24

These are the wall-time results for 29 benchmarks. There are three different build kinds measured for each one: a debug build, an optimized build, and a check build (which detects errors but doesn’t generate code). For each build kind there is a mix of incremental and non-incremental runs done. The numbers for the individual runs aren’t shown here but you can see them if you view the results directly on the site and click around. The “avg” column shows the average change for those runs. The “min” and “max” columns show the minimum and maximum changes among those same runs.

The table has 261 numbers. The thing to take away is that 258 of them are negative, representing a decrease in compile time. Most of the “avg” values are in the range -20% to -40%. The “min” values (representing the best time reduction for each build kind) range from -12.4% to -51.3%. Even the “max” values (representing the worst time reduction for each build kind) are mostly better than -10%. These are pleasing results.

speed improvements since late 2017

What happens if we look further back? The image below compares the compiler from 2017-11-12 (the earliest date for which I could get data from the site) against the compiler from 2019-07-24, a period of just over 20 months.

Table showing Rust compiler speedups between 2017-11-12 and 2019-07-24

These are the wall-time results for only 18 benchmarks, because the benchmark suite was smaller in late 2017. Check builds were also not measured then. You can view the results directly on the site.

My initial thought from looking at the “avg” results was “the compiler is twice as fast” but closer inspection shows that’s not quite true; the average “avg” result is 42%. (I know that averaging averages is statistically dubious, I did it just to get a rough feel.) Overall, the results are significantly better than those for 2019: the “avg” values range from -19.9% to -61.3%, and the “min” values are mostly better than -60%.

(And don’t forget that time reduction percentages can be misleading when they get large. A 50% time reduction means the compiler is twice as fast; a 75% time reduction means the compiler is four times as fast; a 90% time reduction means the compiler is ten times as fast.)

All this is good news. The Rust compiler has long had a reputation for being slow. I still wouldn’t describe it as fast, but it is clearly a lot faster than it used to be. Many thanks to all those who made this happen, and I would be happy to hear from anyone who wants to help continue the trend!

Thanks to theZcuber for a Reddit post that was the starting point for this article.

Categories
Performance Rust

How to speed up the Rust compiler in 2019

I have written previously about my efforts to speed up the Rust compiler in 2016 (part 1, part 2) and 2018 (part 1, part 2, NLL edition). It’s time for an update on the first half of 2019.

Faster globals

libsyntax has three tables in a global data structure, called Globals, storing information about spans (code locations), symbols, and hygiene data (which relates to macro expansion). Accessing these tables is moderately expensive, so I found various ways to improve things.

#59693: Every element in the AST has a span, which describes its position in the original source code. Each span consists of an offset, a length, and a third value that is related to macro expansion. The three fields are 12 bytes in total, which is a lot to attach to every AST element, and much of the time the three fields can fit in much less space. So the compiler used a 4 byte compressed form with a fallback to a hash table stored in Globals for spans that didn’t fit in 4 bytes. This PR changed that to 8 bytes. This increased memory usage and traffic slightly, but reduced the fallback rate from roughly 10-20% to less than 1%, speeding up many workloads, the best by an amazing 14%.

#61253: There are numerous operations that accessed the hygiene data, and often these were called in pairs or trios, thus repeating the hygiene data lookup. This PR introduced compound operations that avoid the repeated lookups. This won 10% on packed-simd, up to 3% on numerous other workloads.

#61484: Similar to #61253, this won up to 2% on many benchmarks.

#60630: The compiler has an interned string type, called symbol. It used this inconsistently. As a result, lots of comparisons were made between symbols and ordinary strings, which required a lookup of the string in the symbols table and then a char-by-char comparison. A symbol-to-symbol comparison is much cheaper, requiring just an integer comparison. This PR removed the symbol-to-string comparison operations, forcing more widespread use of the symbol type. (Fortunately, most of the introduced symbol uses involved statically-known, pre-interned strings, so there weren’t additional interning costs.) This won up to 1% on various benchmarks, and made the use of symbols more consistent.

#60815: Similar to #60630, this also won up to 1% on various benchmarks.

#60467, #60910, #61035, #60973: These PRs avoiding some more unnecessary symbol interning, for sub-1% wins.

Miscellaneous

The following improvements didn’t have any common theme.

#57719: This PR inlined a very hot function, for a 4% win on one workload.

#58210: This PR changed a hot assertion to run only in debug builds, for a 20%(!) win on one workload.

#58207: I mentioned string interning earlier. The Rust compiler also uses interning for a variety of other types where duplicate values are common, including a type called LazyConst. However, the intern_lazy_const function was buggy and didn’t actually do any interning — it just allocated a new LazyConst without first checking if it had been seen before! This PR fixed that problem, reducing peak memory usage and page faults by 59% on one benchmark.

#59507: The pretty-printer was calling write! for every space of
indentation, and on some workloads the indentation level can exceed 100. This PR reduced it to a single write! call in the vast majority of cases, for up to a
7% win on a few benchmarks.

#59626: This PR changed the preallocated size of one data structure to better match what was needed in practice, reducing peak memory usage by 20 MiB on some workloads.

#61612: This PR optimized a hot path within the parser, whereby constant tokens were uselessly subjected to repeated “is it a keyword?” tests, for up to a 7% win on programs with large constants.

Profiling improvements

The following changes involved improvements to our profiling tools.

#59899: I modified the output of -Zprint-type-sizes so that enum variants are listed from largest to smallest. This makes it much easier to see outsized variants, especially for enums with many variants.

#62110: I improved the output of the -Ztime-passes flag by removing some uninteresting entries that bloated the output and adding a measurement for the total compilation time.

Also, I improved the profiling support within the rustc-perf benchmark suite. First, I added support for profiling with OProfile. I admit I haven’t used it enough yet to gain any wins. It seg faults about half the time when I run it, which isn’t encouraging.

Second, I added support for profiling with the new version of DHAT. This blog post is about 2019, but it’s worth mentioning some improvements I made with the new DHAT’s help in Q4 of 2018, since I didn’t write a blog post about that period: #55167, #55346, #55383, #55384, #55501, #55525, #55556, #55574, #55604, #55777, #55558, #55745, #55778, #55905, #55906, #56268, #56090, #56269, #56336, #56369, #56737, and (ena crate) #14.

Finally, I wrote up brief descriptions for all the benchmarks in rustc-perf.

pipelined compilation

The improvements above (and all the improvements I’ve done before that) can be described as micro-optimizations, where I used profiling data to optimize a small piece of code.

But it’s also worth thinking about larger, systemic improvements to Rust compiler speed. In this vein, I worked in Q2 with Alex Crichton on pipelined compilation, a feature that increases the amount of parallelism available when building a multi-crate Rust project by overlapping the compilation of dependent crates. In diagram form, a compilation without pipelining looks like this:

         metadata            metadata
[-libA----|--------][-libB----|--------][-binary-----------]
0s        5s       10s       15s       20s                30s

With pipelined compilation, it looks like this:

[-libA----|--------]
          [-libB----|--------]
                             [-binary-----------]
0s        5s       10s       15s                25s

I did the work on the Rust compiler side, and Alex did the work on the Cargo side.

For more details on how it works, how to use it, and lots of measurements, see this thread. The effects are highly dependent on a project’s crate structure and the compiling machine’s configuration. We have seen speed-ups as high as 1.84x, while some projects see no speed-up at all. At worst, it should make things only negligibly slower, because it’s not causing any additional work, just changing the order in which certain things happen.

Pipelined compilation is currently a Nightly-only feature. There is a tracking issue for stabilizing the feature here.

Future work

I have a list of things I want to investigate in Q3.

  • For pipelined compilation, I want to try pushing metadata creation even earlier in the compiler front-end, which may increase the speed-ups some more.
  • The compiler uses memcpy a lot; not directly, but the generated code uses it for value moves and possibly other reasons. In “check” builds that don’t do any code generation, typically 2-8% of all instructions executed occur within memcpy. I want to understand why this is and see if it can be improved. One possibility is moves of excessively large types within the compiler; another possibility is poor code generation. The former would be easier to fix. The latter would be harder to fix, but would benefit many Rust programs.
  • Incremental compilation sometimes isn’t very effective. On some workloads, if you make a tiny change and recompile incrementally it takes about the same time as a full non-incremental compilation. Perhaps a small change to the incremental implementation could result in some big wins.
  • I want to see if there are other hot paths within the parser that could be improved, like in #61612.

I also have various pieces of Firefox work that I need to do in Q3, so I might not get to all of these. If you are interested in working on these ideas, or anything else relating to Rust compiler speed, please get in touch.

Categories
Memory allocation Memory consumption Performance Valgrind

A better DHAT

DHAT is a heap profiler that comes with Valgrind. (The name is short for “Dynamic Heap Analysis Tool”.) It tells your where all your heap allocations come from, and can help you find the following: places that cause excessive numbers of allocations; leaks; unused and under-used allocations; short-lived allocations; and allocations with inefficient data layouts. This old blog post goes into some detail.

In the new Valgrind 3.15 release I have given DHAT a thorough overhaul.

The old DHAT was very useful and I have used it a lot while profiling the Rust compiler. But it had some rather annoying limitations, which the new DHAT overcomes.

First, the old DHAT dumped its data as text at program termination. The new DHAT collects its data in a file which is read by a graphical viewer that runs in a web browser. This gives several advantages.

  • The separation of data collection and data presentation means you can run a program once under DHAT and then sort and filter the data in various ways, instead of having to choose a particular sort order in advance. Also, full data is in the output file, and the graphical viewer chooses what to omit.
  • The data can be sorted in more ways than previously. Some of these sorts involve useful filters such as “short-lived” and “zero reads or zero writes”.
  • The graphical viewer allows parts of the data to be hidden and unhidden as necessary.

Second, the old DHAT divided its output into records, where each record consisted of all the heap allocations that have the same allocation stack trace. The choice of stack trace depth could greatly affect the output.

In contrast, the new DHAT is based around trees of stack traces that avoid the need to choose stack trace depth. This avoids both the problem of not enough depth (when records that should be distinct are combined, and may not contain enough information to be actionable) and the problem of too much depth (when records that should be combined are separated, making them seem less important than they really are).

Third, the new DHAT also collects and/or shows data that the old DHAT did not.

  • Byte and block measurements are shown with a percentage relative to the global measurements, which helps gauge relative significance of different parts of the profile.
  • Byte and block measurements are also shown with an allocation rate (bytes and blocks per million instructions), which enables comparisons across multiple profiles, even if those profiles represent different workloads.
  • Both global and per-node measurements are taken at the global heap peak, which gives Massif-like insight into the point of peak memory use.
  • The final/lifetimes stats are a bit more useful than the old deaths stats. (E.g. the old deaths stats didn’t take into account lifetimes of unfreed blocks.)

Finally, the new DHAT has a better handling of realloc. The sequence p = malloc(100); realloc(p, 200); now increases the total block count by 2 and the total byte count by 300. In the old DHAT it increased them by 1 and 200. The new handling is a more operational view that better reflects the effect of allocations on performance. It makes a significant difference in the results, giving paths involving reallocation (e.g. repeated pushing to a growing vector) more prominence.

Overall these changes make DHAT more powerful and easier to use.

The following screenshot gives an idea of what the new graphical viewer looks like.

Sample output from DHAT's viewer

The new DHAT can be run using the --tool=dhat flag, in contrast with the old DHAT, which was an “experimental” tool and so used the --tool=exp-dhat flag. For more details see the documentation.