Categories
add-ons Firefox Memory consumption MemShrink

Update to GreaseMonkey 1.0 to avoid leaks in Firefox 15

Firefox 15 will be released tomorrow, and it features a fantastic change that prevents most memory leaks in add-ons, which have been a big problem for a long time.

However, recently we discovered that the change is causing some GreaseMonkey scripts to leak badly.  The scripts we know that leak are “YousableTubeFix” and “Textarea backup with expiry”, but others might have the same problem.  Fortunately, Anthony Lieuallen and Kyle Huey worked together to fix the problem, and version 1.0 of GreaseMonkey contains the fix.  If you have GreaseMonkey installed you can open the Add-ons Manager to see which version you have.  If it’s older than 1.0 (e.g. 0.9.22), you can update by visiting the GreaseMonkey page and clicking on the big green “Add to Firefox” button.

This is the only add-on we know that is adversely affected by the change in Firefox 15.  Hopefully we won’t find any more!

Categories
add-ons Firefox Memory consumption MemShrink

MemShrink progress, week 61–62

It’s been a quiet fortnight for MemShrink.

The biggest news is that Kyle Huey made a change so that Firefox discards images that have been removed from the DOM.  This might sound boring, but it’s important because (among other things) it can greatly reduce the amount of memory used for photo slideshows on Facebook.  Kyle first started working on this patch nearly a year ago, and had to overcome numerous hurdles along the way.  This is a nice improvement to our foreground tab image handling, which is the #1 remaining MemShrink problem.  But there’s still lots of room to improve on that front.

The following add-ons had memory leaks fixed: 1Password, Web Developer, CoKnown Research & Webpage Clipping Toolbar, aaQQin.  The latter three were zombie compartments, a problem that Firefox 15 (due for release next week) should make impossible.  Still, it was nice of the authors to fix the problem early rather than waiting for it to be fixed for them!

Gian-Carlo Pascutto finished a huge overhaul of the SafeBrowsing implementation.  I won’t pretend to understand the changes, but it was marked as a MemShrink:P2 change and so hopefully reduced memory consumption in some notable fashion 🙂

Here are the current bug counts.

  • P1: 24 (-0/+1)
  • P2: 89 (-3/+3)
  • P3: 98 (-8/+1)
  • Unprioritized: 2 (-1/+2)

A small reduction.

Categories
add-ons Firefox Garbage Collection Memory consumption MemShrink

MemShrink progress, week 57–60

I’ve been on vacation for two weeks, so this report covers the past four weeks.  I still have a mountain of unread emails, bug reports and blog posts to get through, but hopefully I haven’t missed much.

Hueyfix

I wrote about Firefox 15 and how it contains the “Hueyfix” that prevents most memory leaks caused by add-ons.  It got lots of attention.

Relatedly, a regression caused by the Hueyfix was discovered:  it caused some Greasemonkey scripts to leak badly, such as “YousableTubeFix” and “Textarea backup with expiry”.  A change was made to Firefox to allow this to be prevented (which has been backported to Firefox 15 Beta), and Greasemonkey 0.9.22 should fix the problem, although that hasn’t yet been confirmed.  If you have had problems with Firefox 15 and you are using Greasemonkey, this is a likely cause.  I’m not aware of any other regressions caused by the Hueyfix.

Also relatedly, Gabor Krizsanits made a change inspired by the Hueyfix that cuts references to sandboxes once they should no longer be used.  This prevents a whole class of possible leaks in add-ons using the Add-on SDK.

Miscellaneous

Gregor Wagner tweaked the JS engine’s garbage collection heuristics to greatly reduce the peak memory consumption in certain cases.  Gregor previously tweaked the GC heuristics in Firefox 7 with great success.

Tim Taubert fixed a leak caused by opening and closing the bookmarks sidebar.  This was a precursor to a more important change from Tim, which adds automated checking of the cycle collection logs to check for leaks during testing.  This should allow a whole class of memory leaks to be detected automatically, thus preventing regressions.

Benoit Jacob made a change that prevents the number of WebGL contexts growing excessively.  This can greatly improve memory consumption on certain sites that use WebGL.

Nick Cameron fixed a problem that caused huge memory consumption (multiple GB) on pages using canvas in conjunction with certain Intel graphics cards and/or drivers.  I don’t understand the details, but it sounds like some cards and/or drivers might still have problems.

Bug Counts

Here are the current bug counts.

  • P1: 23 (-0/+3)
  • P2: 89 (-9/+8)
  • P3: 105 (-2/+5)
  • Unprioritized: 1 (-2/+1)

Nothing spectacular there.

Categories
add-ons Firefox Memory consumption MemShrink

Firefox 15 plugs the add-on leaks

TL;DR

Firefox 15 prevents most memory leaks caused by add-ons, including Firebug.  For many users with add-ons installed this will significantly reduce Firefox’s memory consumption, without requiring upgrades to those add-ons.

For those users, Firefox 15 is likely to be faster (sometimes drastically so) and less likely to crash, especially if they have multiple add-ons installed and/or keep Firefox running for a long time between restarts.

The Problem

A memory leak occurs when a program allocates some memory but then fails to free it.  There are multiple causes of memory leaks, but they all have the same effect:  an increase in memory consumption, which often grows as the program runs. This can cause poor performance, and even lead to crashes or aborts due to the exhaustion of available memory.

Many Add-ons Leak

I’ve lost count of the number of times I’ve seen (and participated in) variants of the following conversation during the past year.

Alice: Firefox is slow and using 2GB of memory.  WTF?
Bob:   Do you have any add-ons installed?
Alice: Yes.  Why?
Bob:   Try disabling them all and restart Firefox.
Alice: Ok... Oh wow.  That's much better.
Bob:   Now you have to disable them one at a time to work
       out which one(s) are at fault.
Alice: Really?  Hmm, that sucks.
Bob:   Yeah.  Sorry about that.

Although Firefox itself isn’t immune to memory consumption problems, Mozilla’s MemShrink project has fixed enough problems in Firefox itself that in January of this year I declared that the #1 way to improve memory consumption in Firefox would be with “Better Detection and Notification of Leaky Add-ons“.

I said this because many add-ons have memory leaks.

Happily, most of the leaks in the mentioned add-ons have been fixed by their developers.  But by now it should be clear that (a) memory leaks are common, and (b) no add-ons are immune, no matter how simple they are, or how good their developers are.

The other thing to note is that these add-ons each exhibited a particular kind of leak that we call a zombie compartment.  The gory details of zombie compartments are beyond the scope of this blog post;  the important thing is that they are common, accounting for 90% or more of the add-on leaks we’ve seen.

Leaky Add-ons Make Firefox Slow and Crashy

So, leaky add-ons are common.  What effect do they have?

Not all leaks are created equal.  Some add-ons leak a small amount of memory; some add-ons leak an unbounded amount of memory.  Users with multiple add-ons are more likely to suffer problems. Certain browsing patterns may exacerbate leaks.  Overall, it’s very hard to characterize.

Nonetheless, affected users may experience high memory consumption, which has the following visible effects.

  • Long freezes, caused by garbage collection and cycle collection.
  • General sluggishness during basic operations, like scrolling and switching tabs.
  • Occasional drastic slowdowns — particularly on machines with small amounts of RAM such as netbooks — due to the paging of data to and from the hard disk.
  • Out-of-memory crashes or aborts, particularly on Windows and ARM machines.

For example, one user who disabled a leaky version of 1Password experienced a much leaner and faster Firefox as a result.

I only use a handful of extensions and honestly never suspected 1P, however after disabling it I noticed my FireFox performance increased very noticibly. I’ve been running for 48 hours now without the 1P extension in Firefox and wow what a difference. Browsing is faster, switching is faster, memory usage is way down.

(My emphasis.)

We’ve heard this kind of story many times, and this one is typical because the user never suspected that an add-on was the cause of the problem.  Leaks in add-ons are not Mozilla’s fault, but they are Mozilla’s problem — Firefox gets blamed for the sins of its add-ons.  This isn’t surprising, because Firefox hasn’t provided tools that would let users understand when add-ons are causing problems.

What has Mozilla done about this before now?

For a long time, we lacked memory profiling tools that were (a) powerful enough to detect add-on leaks, and (b) simple enough to be used by users who weren’t also Firefox developers.  This meant that we didn’t appreciate how many problems were caused by leaky add-ons.

That changed last year.  The infrastructure with which we detect zombie compartments was implemented in two parts:  the segmentation of the JavaScript heap into compartments (which happened in Firefox 4, released in March 2011), and the addition of per-compartment memory reporting in Firefox’s about:memory page (which was added in Firefox 7, released in September 2011).

Once these tools were in place, the reports of leaky add-ons started rolling in, and it only took a few months to realize the magnitude of the problems they were causing.  We started tracking them, we helped authors fix them, and tightened the AMO review guidelines so that any add-on that was found to cause zombie compartments would have its status downgraded.

As a result, dozens of leaky add-ons were fixed.  But there are literally thousands of Firefox add-ons in existence, many of which aren’t hosted on AMO and so aren’t subject to the AMO review policies.  And although many add-on authors were responsive, some weren’t.  It was a tedious game of whack-a-mole, and something better was needed.

The Fix

Leaky add-ons usually cause zombie compartments by holding references to DOM structures within a web page even after the page has been closed or navigated away from.  This prevents Firefox from garbage-collecting the page’s compartment.

Mozilla engineer Kyle Huey had the radical idea of simply detecting these kinds of references and cutting them.  This would eradicate this entire class of memory leaks for good, without requiring any changes to individual add-ons.

However, it wasn’t at all obvious that this would work.  In particular, it was possible that code within Firefox and/or add-ons might be broken by this change.  But it turned out, once some bumps were cleared, that almost no code was broken and the leaks were prevented exactly as predicted.  This fix is present in Firefox 15.

Confirmation via in-house testing

I did some early testing on a number of add-ons that were known to leak:  Firebug 1.9.1, McAfee SiteAdvisor 3.4.1, PicPasso 1.0.1, LoL 1.5, YouTube Ratings Preview 1.03, Enter Selects 7, HttpFox 0.8.10, and Link Resolve 0.7.  In every case, Firefox 15 prevents the leaks.

We’ve subsequently confirmed that a number of other leaking add-ons have been fixed by this change.  Although add-ons can still cause zombie compartments in obscure cases, we are yet to encounter such a case in practice.

Confirmation from real-world users

Firefox users can enable telemetry, which is a feature that periodically sends anonymous performance-related data to Mozilla.  This allows us to analyze how people use Firefox in the real world.

We don’t track zombie compartments via telemetry, but we do track something called ghost windows.  The gory details of ghost windows are also beyond the scope of this blog post;  the important thing to know is that they correlate strongly with zombie compartments — a high ghost window count very likely indicates the presence of zombie compartment, and thus memory leaks.

The following graph shows the ghost windows telemetry measurements for users of Firefox Nightly builds on Windows during April and May 2012.  The line marked with a 1 shows when Kyle’s patch landed, and the lines marked with 2 and 3 show when some related follow-up patches landed.

Ghost Windows telemetry results

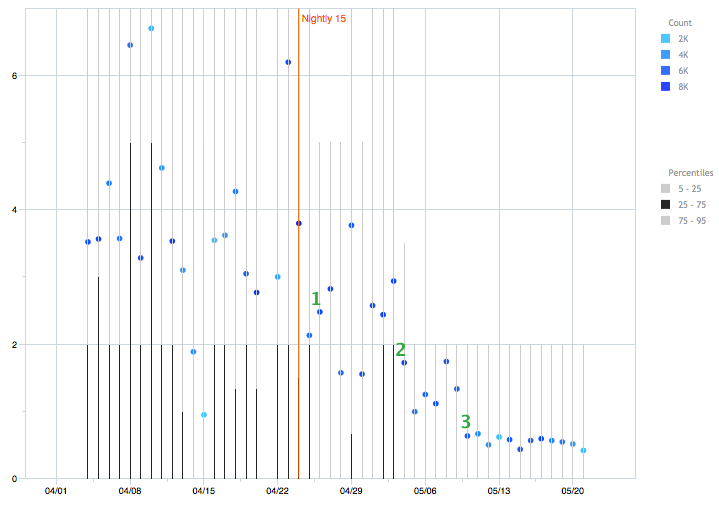
Telemetry data tends to be very noisy, and this graph is no exception, but the effect is clear.  The mean number of ghost windows (shown by the blue dots) dropped from typically between three and four to typically less than one.  (As for why it’s not zero, one reason is that ghost windows can be false positives — i.e. they don’t always correspond to actual leaks.)  Furthermore, the variance has dropped greatly.  Previously, the hardest-hit 5% of measurements would typically have at least 15 or 20 ghost windows, and the next hardest-hit 20% would typically have at least two.  After the fix, the hardest-hit 5% of measurements typically have only two or more ghost windows, and the remaining 95% typically have zero.  This graph is a few weeks old now, but the measurements for Firefox 15 since then have remained steady.

In other words, ghost windows have changed from something that many users experience to something that few users experience.  Furthermore, those users who are still affected experience many fewer than before.  This graph also provides further evidence that add-ons are responsible for a large fraction of the memory leaks encountered by Firefox users.

The Benefits of the Fix

Our testing

I compared pre-release versions of Firefox 14 and Firefox 15 with McAfee SiteAdvisor 3.4.1 installed.  SiteAdvisor is a very popular add-on that rates the safety of web sites, and version 3.4.1 had an unbounded memory leak that leaked significant amounts of memory on every page that Firefox visited.  (That leak has since been fixed and version 3.4.1 is no longer available from McAfee.)

I did the testing on a fast desktop machine with Windows 7 installed.  I ran MemBench, which is a memory test benchmark that opens 150 popular websites, one per tab, and then closes them all.  This test is a reasonable facsimile of several hours of web browsing.

I used about:memory to measure memory consumption (a) with the 150 tabs open (plus one more tab for about:memory itself), and then (b) after closing those 150 tabs.  The metric I measured was resident memory consumption, which is the amount of physical memory used by Firefox.  It is measured by the operating system.  Firefox 14’s two measurements are on the left, and Firefox 15’s two measurements are on the right.

Resident Memory Consumption (MB) on MemBench of Firefox 14 & 15 with SiteAdvisor 3.4.1 add-on

The graph tells a clear story.  The leak in SiteAdvisor 3.4.1 prevents Firefox 14 from releasing most of the memory used by the 150 MemBench tabs, even after those tabs are closed.  In contrast, Firefox 15 prevents the leak.  As a result, after closing 150 tabs, Firefox 15’s resident memory consumption is 4.8x smaller than Firefox 14’s (compare the red bars) without any change to the add-on.

Feedback from users

The feedback from users of the pre-release Nightly and Aurora versions of Firefox has been overwhelmingly positive.  Here are some notable examples.

One user experienced a 4x reduction in memory consumption at the end of the day.

I seem to be seeing really significant improvements from this. Normally Fx would start at 170MB and by the end of the day that would often be creeping up to 800 or 900 MB. Today using latest nightly I again started at 170, but now at the end of the day I’m only at 230MB!

I knew that my addons were the culprit, yet the list I have at the moment is a tenured list of addons I wish to keep. This fix allows me to continue being an addon junkie without the pernicious side effects. Thank you so much!

Another user reported via email that a 1.5GB per hour leak — which caused 10+ second pauses and necessitated frequent restarts — disappeared.

Firefox was leaking about 1.5GB per hour for me. It started with Firefox 3. I tracked it down to Ghostery and NoScript, but even without those addons it leaked about 500MB per hour of browsing.

GC and CC times got up into the 10 second range. Ugly. Really really ugly! And this is on top of the line massively overclocked hardware, too. I had to install a new addon to add a restart button to Firefox, because Firefox froze solid after hitting 2GB of memory usage…

Then your patch comes along and solves it all… totally awesome!

Another user experienced faster painting, scrolling, and input operations.

Certainly, before this fix I would find that Firefox often became sluggish (input lag, slow paint operations, less than silky smooth scroll animations) as the memory usage built up… I haven’t noticed the same symptoms since… the signs certainly seem to be good.

These quotes nicely highlight the potential benefits:  greatly reduced memory consumption, which leads to fewer pauses, faster overall performance, and no need to restart Firefox to restore optimum performance.

YMMV

Based on the evidence above, we are confident that Firefox 15 fixes the vast majority of add-on memory leaks, and that as a result, many users will see drastic improvements in Firefox’s performance and stability.  However, predicting the exact effects of this fix on the hundreds of millions of Firefox users is essentially impossible, due to the huge number of different add-ons that are available, and the great variety of add-on and browsing usage patterns.

Nonetheless, if you are a heavy add-on user and you have noticed Firefox’s performance degrade during long browsing sessions, there is a good chance you will see large improvements.  Firebug users may notice improvements as well.  But, as they say:  your mileage may vary.

CONCLUSION

Over the past year, Mozilla has made great progress in reducing Firefox’s memory consumption.  However, the excessive memory consumption caused by add-ons with memory leaks has remained an ongoing problem.

Firefox 15 fixes that problem.  We have confirmed, via in-house testing and from real-world telemetry data, that it prevents the vast majority of leaks that occur in existing add-ons.

Users who upgrade to Firefox 15 won’t have to upgrade their add-ons to see the benefits.  While it is hard to predict the effect of this improvement on any individual user, many users should experience greatly reduced memory consumption, particularly on long browsing sessions.  This should result in better performance, fewer pauses, and fewer crashes.

Mozilla’s MemShrink efforts are ongoing.  We have various projects in the pipeline that aim to further reduce Firefox’s memory consumption, and help users understand better how Firefox is using memory.  Hopefully these changes will make it into Firefox releases not far from now!

Categories
Firefox

Firefox update discussion

Jono Xia ( DiCarlo), a former Mozilla employee, recently garnered a great deal of attention for making some critical remarks about Firefox’s update system.  He has subsequently made two follow-up posts, which have garnered much less attention.

The first of these concludes the following statement.

The Firefox update mechanism is a lot better now, as is the add-on compatibility situation. If you’ve left Firefox, I hope you’ll consider giving it another try.

The second of these includes this statement.

This has taught me something very sad and frustrating about how communication goes wrong on the internet. I posted something that was close to a lot of peoples’ hot buttons. So it “went viral” and appeared to generate a lot of discussion. But most of the people “discussing” don’t even care what I said. They just wanted a thread to re-state their favorite rants about Firefox memory consumption or whatever. My post was just used as fodder for a pre-existing flame war. The point I wanted to talk about got lost in the noise.

Both follow-up posts are worth reading.

Categories
about:memory add-ons Firefox Garbage Collection Memory consumption MemShrink

MemShrink progress, week 55-56

Memory Reporting

I changed things so that JavaScript memory consumption for web content is reported on a per-tab basis, as the following example shows.

│  ├────4,472,568 B (00.50%) -- top(http://www.mozilla.org/en-US/firefox/fx/, id=236)/active
│  │    ├──4,192,640 B (00.47%) -- window(http://www.mozilla.org/en-US/firefox/fx/)
│  │    │  ├──1,979,112 B (00.22%) ++ js/compartment(http://www.mozilla.org/en-US/firefox/fx/)
│  │    │  ├──1,607,216 B (00.18%) ++ layout
│  │    │  ├────352,520 B (00.04%) ── style-sheets
│  │    │  ├────253,312 B (00.03%) ++ dom
│  │    │  └────────480 B (00.00%) ── property-tables

All the major components of each tab’s memory consumption — JS, layout, style sheets, and DOM — are now reported on a per-tab basis.  This is great, because it’s something that people have been requesting for  years.  However, the presentation is still intimidating.  Consider the following excerpt from about:memory.

├───18,288,696 B (16.43%) -- window-objects
│   ├───6,263,208 B (05.62%) ++ top(about:memory?verbose, id=6)/active
│   ├───5,090,352 B (04.57%) ++ top(chrome://browser/content/browser.xul, id=1)/active
│   ├───3,422,280 B (03.07%) ++ top(http://www.mozilla.org/en-US/firefox/fx/, id=17)/active/window(http://www.mozilla.org/en-US/firefox/fx/)
│   ├───3,178,432 B (02.85%) ++ top(chrome://global/content/console.xul, id=21)/active
│   └─────334,424 B (00.30%) ++ top(resource://gre-resources/hiddenWindow.html, id=3)/active/window(resource://gre-resources/hiddenWindow.html)

Among those top(...) entries are two browser tabs (one for www.mozilla.org, one for about:memory), two browser chrome windows (browser.xul is the main browser window, and console.xul is the error console window), and the hidden window which is always present.  Firefox developers can easily understand this, and technically-inclined users may be able to guess what’s going on, but the average user will struggle.

From a user’s point of view, the visible things they have control over (i.e. windows and tabs) should be better distinguished from everything else, and be shown with nicer names than “browser.xul”.  But the architecture of Firefox’s internals doesn’t make this easy.  I’ve made one not-very-successful attempt to improve this, and I’d love to hear suggestions from other Firefox devs on how to present this information better.

(The step after that one is to present some kind of “tab manager” — a massively stripped-down variant of about:memory that ordinary users can understand.  This would also require localization for all the languages that Firefox supports.  One step at a time!)

Finally, another memory reporting improvement happened:  Andrew McCreight and I added measurement of orphan DOM nodes.  These are DOM nodes that have been discarded by a page but are still accessible from JavaScript objects.   They were the biggest single remaining contributor to “heap-unclassified”.  For example, when I hit the “update” button on about:memory I get 5MB of them (don’t worry, they go away when the garbage collector runs).  Also, badly coded sites can create large numbers of them.  So it’s a good thing to be able to measure, for both users and web developers.

Miscellaneous

Mihai Sucan fixed a bad leak involving pages that use window.console.  Multiple people reported that this caused Firefox’s memory consumption to balloon to multiple GB.  This leak was introduced during the Firefox 15 development cycle, and the fix has been backported to the Aurora channel, which is where Firefox 15 currently resides.  One notable thing about this fix is that the problem was quite easy to diagnose because about:memory clearly indicated that the ConsoleAPI.js compartment was responsible for most of the memory consumption.  Without the fine-grained memory reporting that was enabled by compartment-per-global, that memory would have been reported in a generic “System Principal” compartment which would have made diagnosis much harder.

Wladimir Palant fixed an issue in AdBlock Plus that causes its memory consumption to slowly grow when viewing sites that repeatedly reset the src property of images, such as Mibbit.  (The fine-grained memory reporting enabled by compartment-per-global also made this diagnosis much easier.)  This fix is in Adblock Plus 2.1.

Alexandre Poirot fixed a minor leak in the Add-on SDK.

I wrote about the difficulties of cross-browser memory comparisons.

Bug Counts

Here are the current bug counts.

  • P1: 20 (-3/+0)
  • P2: 90 (-3/+6)
  • P3: 102 (-6/+2)
  • Unprioritized: 2 (-0/+0)

A net reduction of seven bugs!

Update on The big ticket Items

In January, I described six “big ticket items” that needed tackling to improve Firefox’s memory consumption.  Let’s look at how they’ve progressed since then.

#6: Better Script Handling

This had two parts.  The first part was to only generate bytecode for a function once it is run.  I’ve made a good chunk of progress towards and have it working on very simple examples.  This has required a great deal of refactoring of the SpiderMonkey front-end.  (The front-end is a hairy piece of code, so this is virtuous in and of itself.)  There are still a couple of other bugs blocking it from further progress.  I intend to return to continue on this once they are done.

The second part was to share immutable parts of scripts between web pages.  No progress has been made on this.

So, overall, this item is about 25% done, and progress is still ticking along slowly.

#5: Better Memory Reporting

This one also had two parts.  The first part was to reduce about:memory’s “heap-unclassified” number (a.k.a “dark matter”) to typically 10%.  People such as Nathan Froyd and I have made good progress on this.  It’s now occasionally below 10% (my current session shows 7.5%) but often is around 15%.  That’s much better than the 20–25% we typically were getting at the start of the year, and it’s low enough that people rarely complain about it now.  And we’re very much into the long tail now, so it’ll be hard to improve things much further.  For the most part I don’t think we need to.

The second part was to report memory in a per-tab fashion.  As mentioned above, I just completed this, although the presentation is not as user-friendly as it could be.

The per-tab reporting was enabled by compartment-per-global.  Compartment-per-global also gives us much more insight into the memory consumption of Firefox’s own JavaScript code, and even some idea about add-on memory consumption, which was (to me) an unexpected bonus.  Indeed, its usefulness was demonstrated by the two leak fixes mentioned above.

So, overall, this item is about 80% done.  Although there is still some work to be done, it has progressed enough that I will remove it from the “big ticket items” list.

#4: Better Memory Consumption Tracking

We can cross this item off the list, thanks to areweslimyet.com.  In January I also mentioned the idea of using telemetry for this, but we’ve found that telemetry results are so noisy that little (with rare exceptions) can be gleaned from it, so there’s not really anything to be done on that front.

#3: Compacting Generational GC

This is one of the two key SpiderMonkey performance features under development (the other being IonMonkey), and so people such as Terrence Cole, Steve Fink, Brian Hackett, and Bill McCloskey and actively working on it.  Unfortunately, it’s a huge undertaking that requires rewriting many of SpiderMonkey’s internal and external APIs.  If I had to guess I’d say it’s 25% complete, but that really is just a wild guess.  I’ll be pleased if it is finished before the end of the year.

#2: Better Foreground Tab Image Handling

This is the big ticket item for which the least progress has been made. There’s a single bug that is blocking all the follow-on work.  Both Timothy Nikkel and Jet Villegas have spent time working on it, but it has been a difficult nut to crack.  Justin Lebar had a recent suggestion for narrowing its scope slightly.  I hope it’s a good suggestion, because I’m out of ideas on this one.

#1: Better Detection and Notification of Leaky Add-ons

This is the most satisfying item of the lot.  I expected to make only grudging, piecemeal progress, but Kyle Huey’s fix to prevent zombie compartments prevents the vast majority of add-on leaks, enough to declare victory and cross this item off the list.  I’ll be writing more about this next week.

Summary

Three items (#1, #4, #5) have progressed enough that they can be removed from the list.  Only one of these directly improved Firefox’s memory consumption;  the other two were about better measuring and monitoring of memory consumption.

The remaining items are about reducing memory consumption.  Two of them (#3, #6) have a long way to go, but progress has been made and is ongoing.  One item (#2) has made little progress and has stalled.

The New big ticket Items

Here’s my updated list of the most important things.

#5: Better Script Handling

As mentioned above, this has two parts: lazy bytecode generation, and the  sharing of immutable parts of scripts.  I intend to continue working on the first part.  Once that’s done, it may turn out that the second part isn’t necessary;  we’ll see.

#4: Regain compartment-per-global losses

The measurements on areweslimyet.com have been creeping up for the past two months.  The major cause is compartment-per-global, which has lots of benefits (as mentioned above) but also increases memory consumption by a small-to-moderate amount across the board.  This is because there are many more compartments than there used to be, and there’s a certain amount of overhead and waste in each compartment.

Generational GC will help, but there are some other things that can be done more quickly that will help.  See the tracking bug for one example.

#3: Boot2Gecko

Boot2Gecko (now officially known as “Firefox OS”) is going to be running on low-end phones without much physical memory, so that’ll require care.  The first step is to get about:memory working on B2G.  The next step is to find a way to copy the data from about:memory somewhere else, because B2G doesn’t have cut and paste!  Beyond that, it’s unclear;  but once about:memory is working it’s very likely it will identify some sub-optimal B2G-specific behaviour.

#2: Compacting Generational GC

Let me quote myself to explain the memory consumption benefits of compacting, generational GC.

Virtual memory consumption drops in two ways.  First, the compaction minimizes waste due to fragmentation.  Second, the heap grows more slowly.  Physical memory consumption drops for the same two reasons.

The performance benefits are also significant.

Performance improves for three reasons.  First, paging is reduced because of the generational behaviour:  much of the JS engine activity occurs in the nursery, which is small;  in other words, the memory activity is concentrated within a smaller part of the working set.  Second, paging is further reduced because of the compaction: this reduces fragmentation within pages in the tenured heap, reducing the total working set size.  Third, the tenured heap grows more slowly because of the generational behaviour… which means that structure traversals done by the garbage collector (during full-heap collections) and cycle collector are faster.

Important stuff.

#1: Better Foreground Tab Image Handling

On image-heavy pages, Firefox uses much more memory than other browsers.  This includes things like Facebook image slideshows.  One commenter said the following.

On behalf of Facebook Inc, let me just say that we are prepared to give over one thousand free “pokes” to anyone who fixes this bug or alternatively https://bugzilla.mozilla.org/show_bug.cgi?id=683290. I will also gladly show you Mark Zuckerberg’s desk and give you free dinner and cookies as part of a complementary tour of Facebook HQ in Menlo Park.

I have no idea if this person is really from Facebook, but it’s certainly suggestive.  Also, I’ve heard from B2G people that they are having to work around this problem in their Gallery app.

To repeat myself from week 32:  there are three MemShrink:P1 bugs relating to this:  one about not decoding all images immediately, one about discarding non-visible decoded images after some time, and one about some infrastructure work that is required for the first two.  (See this discussion on the dev-platform mailing list for more details about this topic.)

Summary

There are three repeat items, and two new items, but there are fewer items than last time;  this reflects the fact that we are in a better position than we were in January.  If you think I’ve overestimated or underestimated the importance of any of these, or omitted anything, I’d be interested to hear.

One final thing:  last time, several people suggested “better reporting of add-on memory consumption”.  If I knew of any ideas on how to do this better than about:memory currently does, I’d gladly put it on the list.  But I don’t, and there doesn’t seem to be much point to put an item on the list that we don’t know how to implement.

Vacation

I’m taking the next two weeks as vacation, so there won’t be a MemShrink report on July 24.  I’ll be back with the next MemShrink round-up on August 8th.  See you then.

Categories
Firefox Garbage Collection Google Chrome Memory consumption MemShrink Opera Performance

How to Compare the Memory Efficiency of Web Browsers

TL;DR: Cross-browser comparisons of memory consumption should be avoided.  If you want to evaluate how efficiently browsers use memory, you should do cross-browser comparisons of performance across several machines featuring a range of memory configurations.

Cross-browser Memory Comparisons are Bad

Various tech sites periodically compare the performance of browsers.  These often involve some cross-browser comparisons of memory efficiency.  A typical one would be this:  open a bunch of pages in tabs, measure memory consumption, then close all of them except one and wait two minutes, and then measure memory consumption again.  Users sometimes do similar testing.

I think comparisons of memory consumption like these are (a) very difficult to make correctly, and (b) very difficult to interpret meaningfully.  I have suggestions below for alternative ways to measure memory efficiency of browsers, but first I’ll explain why I think these comparisons are a bad idea.

Cross-browser Memory Comparisons are Difficult to Make

Getting apples-to-apples comparisons are really difficult.

  1. Browser memory measurements aren’t easy.  In particular, all browsers use multiple processes, and accounting for shared memory is difficult.
  2. Browsers are non-deterministic programs, and this can cause wide variation in memory consumption results.  In particular, whether or not the JavaScript garbage collector runs can greatly reduce memory consumption.  If you get unlucky and the garbage collector runs just after you measure, you’ll get an unfairly high number.
  3. Browsers can exhibit adaptive memory behaviour.  If running on a machine with lots of free RAM, a browser may choose to take advantage of it;  if running on a machine with little free RAM, a browser may choose to discard regenerable data more aggressively.

If you are comparing two versions of the same browser, problems (1) and (3) are avoided, and so if you are careful with problem (2) you can get reasonable results.  But comparing different browsers hits all three problems.

Indeed, Tom’s Hardware de-emphasized memory consumption measurements in their latest Web Browser Grand Prix due to problem (3).  Kudos to them!

Cross-browser Memory Comparisons are Difficult to Interpret

Even if you could get the measurements right, memory consumption is still not a good thing to compare.  Before I can explain why, I’ll introduce a couple of terms.

  • A primary metric is one a user can directly perceive.  Metrics that measure performance and crash rate are good examples.
  • A secondary metric is one that a user can only indirectly perceive via some kind of tool.  Memory consumption is one example.  The L2 cache miss rate is another example.

(I made up these terms, I don’t know if there are existing terms for these concepts.)

Primary metrics are obviously important, precisely because user can detect them.  They measure things that users notice:  “this browser is fast/slow”, “this browser crashes all the time”, etc.

Secondary metrics are important because they can affect primary metrics:  memory consumption can affect performance and crash rate;  the L2 cache miss rate can affect performance.

Secondary metrics are also difficult to interpret.  They can certainly be suggestive, but there are lots of secondary metrics that affect each primary metric of interest, so focusing too strongly on any single secondary metric is not a good idea.  For example, if browser A has a higher L2 cache miss rate than browser B, that’s suggestive, but you’d be unwise to draw any strong conclusions from it.

Furthermore, memory consumption is harder to interpret than many other secondary metrics.  If all else is equal, a higher L2 cache miss rate is worse than a lower one.  But that’s not true for memory consumption.  There are all sorts of time/space trade-offs that can be made, and there are many cases where using more memory can make browsers faster;  JavaScript JITs are a great example.

And I haven’t even discussed which memory consumption metric you should use.  Physical memory consumption is an obvious choice, but I’ll discuss this more below.

A Better Methodology

So, I’ve explained why I think you shouldn’t do cross-browser memory comparisons.  That doesn’t mean that efficient usage of memory isn’t important! However, instead of directly measuring memory consumption — a secondary metric — it’s far better to measure the effect of memory consumption on primary metrics such as performance.

In particular, I think people often use memory consumption measurements as a proxy for performance on machines that don’t have much RAM.  If you care about performance on machines that don’t have much RAM, you should measure performance on a machine that doesn’t have much RAM instead of trying to infer it from another measurement.

Experimental Setup

I did exactly this by doing something I call memory sensitivity testing, which involves measuring browser performance across a range of memory configurations.  My test machine had the following characteristics.

  • CPU: Intel i7-2600 3.4GHz (quad core with hyperthreading)
  • RAM: 16GB DDR3
  • OS: Ubuntu 11.10, Linux kernel version 3.0.0.

I used a Linux machine because Linux has a feature called cgroups that allows you to restrict the machine resources available to one or more processes.  I followed Justin Lebar’s instructions to create the following configurations that limited the amount of physical memory available: 1024MiB, 768MiB, 512MiB, 448MiB, 384MiB, 320MiB, 256MiB, 192MiB, 160MiB, 128MiB, 96MiB, 64MiB, 48MiB, 32MiB.

(The more obvious way to do this is to use ulimit, but as far as I can tell it doesn’t work on recent versions of Linux or on Mac.  And I don’t know of any way to do this on Windows.  So my experiments had to be on Linux.)

I used the following browsers.

  • Firefox 12 Nightly, from 2012-01-10 (64-bit)
  • Firefox 9.0.1 (64-bit)
  • Chrome 16.0.912.75 (64-bit)
  • Opera 11.60 (64-bit)

IE and Safari aren’t represented because they don’t run on Linux.  Firefox is over-represented because that’s the browser I work on and care about the most 🙂  The versions are a bit old because I did this testing about six months ago.

I used the following benchmark suites:  Sunspider v0.9.1, V8 v6, Kraken v1.1.  These are all JavaScript benchmarks and are all awful for gauging a browser’s memory efficiency;  but they have the key advantage that they run quite quickly.  I thought about using Dromaeo and Peacekeeper to benchmark other aspects of browser performance, but they take several minutes each to run and I didn’t have the patience to run them a large number of times.  This isn’t ideal, but I did this exercise to test-drive a benchmarking methodology, not make a definitive statement about each browser’s memory efficiency, so please forgive me.

Experimental Results

The following graph shows the Sunspider results.  (Click on it to get a larger version.)

sunspider results graph

As the lines move from right to left, the amount of physical memory available drops.  Firefox was clearly the fastest in most configurations, with only minor differences between Firefox 9 and Firefox 12pre, but it slowed down drastically below 160MiB;  this is exactly the kind of curve I was expecting.  Opera was next fastest in most configurations, and then Chrome, and both of them didn’t show any noticeable degradation at any memory size, which was surprising and impressive.

All the browsers crashed/aborted if memory was reduced enough.  The point at which the graphs stop on the left-hand side indicate the lowest size that each browser successfully handled.  None of the browsers ran Sunspider with 48MiB available, and FF12pre failed to run it with 64MiB available.

The next graph shows the V8 results.

v8 results graph

The curves go the opposite way because V8 produces a score rather than a time, and bigger is better.  Chrome easily got the best scores.  Both Firefox versions degraded significantly.  Chrome and Opera degraded somewhat, and only at lower sizes.  Oddly enough, FF9 was the only browser that managed to run V8 with 128MiB available;  the other three only ran it with 160MiB or more available.

I don’t particularly like V8 as a benchmark.  I’ve always found that it doesn’t give consistent results if you run it multiple times, and these results concur with that observation.  Furthermore, I don’t like that it gives a score rather than a time or inverse-time (such as runs per second), because it’s unclear how different scores relate.

The final graph shows the Kraken results.

kraken results graph

As with Sunspider, Chrome barely degraded and both Firefoxes degraded significantly.  Opera was easily the slowest to begin with and degraded massively;  nonetheless, it managed to run with 128MiB available (as did Chrome), which neither Firefox managed.

Experimental Conclusions

Overall, Chrome did well, and Opera and the two Firefoxes had mixed results. But I did this experiment to test a methodology, not to crown a winner.  (And don’t forget that these experiments were done with browser versions that are now over six months old.)  My main conclusion is that Sunspider, V8 and Kraken are not good benchmarks when it comes to gauging how efficiently browsers use memory.  For example, none of the browsers slowed down on Sunspider until memory was restricted to 128MiB, which is a ridiculously small amount of memory for a desktop or laptop machine;  it’s small even for a smartphone.  V8 is clearly stresses memory consumption more, but it’s still not great.

What would a better benchmark look like?  I’m not completely sure, but it would certainly involve opening multiple tabs and simulate real-world browsing. Something like Membench (see here and here) might be a reasonable starting point.  To test the impact of memory consumption on performance, a clear performance measure would be required, because Membench lacks one currently.  To test the impact of memory consumption on crash rate, Membench could be modified to just keep opening pages until the browser crashes.  (The trouble with that is that you’d lose your count when the browser crashed!  You’d need to log the current count to a file or something like that.)

BTW, if you are thinking “you’ve just measured the working set size“, you’re exactly right! I think working set size is probably the best metric to use when evaluating memory consumption of a browser.  Unfortunately it’s hard to measure (as we’ve seen) and it is best measured via a  curve rather than a single number.

 A Simpler Methodology

I think memory sensitivity testing is an excellent way to gauge the memory efficiency of different browsers.  (In fact, the same methodology can be used for any kind of program, not just browsers.)

But the above experiment wasn’t easy:  it required a Linux machine, some non-trivial configuration of that machine that took me a while to get working, and at least 13 runs of each benchmark suite for each browser.  I understand that tech sites would be reluctant to do this kind of testing, especially when longer-running benchmark suites such as Dromaeo and Peacekeeper are involved.

A simpler alternative that would still be quite good would be to perform all the performance tests on several machines with different memory configurations.  For example, a good experimental setup might involve the following machines.

  • A fast desktop with 8GB or 16GB of RAM.
  • A mid-range laptop with 4GB of RAM.
  • A low-end netbook with 1GB or even 512MB of RAM.

This wouldn’t require nearly as many runs as full-scale memory sensitivity testing would.  It would avoid all the problems of cross-browser memory consumption comparisons:  difficult measurements, non-determinism, and adaptive behaviour.  It would avoid secondary metrics in favour of primary metrics.  And it would give results that are easy for anyone to understand.

(In some ways it’s even better than memory sensitivity testing because it involves real machines — a machine with a 3.4GHz i7-2600 CPU and only 128MiB of RAM isn’t a realistic configuration!)

I’d love it if tech sites started doing this.

Categories
about:memory Firefox Memory consumption MemShrink

MemShrink progress, week 53-54

Week 53-54?  We’ve been going for over a year!  To celebrate MemShrink’s 1st birthday, I wrote about the major achievements we’ve made in the past year.

Memory Reporting

I overhauled the cross-cutting “Other Measurements” shown for JavaScript in about:memory.  It’s now in two parts.  The first part is a functional breakdown of the memory consumption of the main JavaScript runtime, i.e. all JavaScript memory usage outside of web worker threads.  Here’s an example.

194,179,064 B (100.0%) -- js-main-runtime
├──159,064,360 B (81.92%) -- compartments
│  ├───73,850,880 B (38.03%) -- gc-heap
│  │   ├──22,014,080 B (11.34%) -- objects
│  │   │  ├──14,119,616 B (07.27%) ── non-function
│  │   │  └───7,894,464 B (04.07%) ── function
│  │   ├──19,553,168 B (10.07%) ── unused-gc-things
│  │   ├──14,014,208 B (07.22%) -- shapes
│  │   │  ├───6,747,240 B (03.47%) ── tree
│  │   │  ├───4,926,000 B (02.54%) ── dict
│  │   │  └───2,340,968 B (01.21%) ── base
│  │   ├──10,204,960 B (05.26%) ── strings
│  │   ├───5,338,816 B (02.75%) ── scripts
│  │   ├───1,493,472 B (00.77%) ── type-objects
│  │   ├───1,229,456 B (00.63%) ── arena-admin
│  │   └───────2,720 B (00.00%) ── sundries
│  ├───29,459,680 B (15.17%) ── analysis-temporary
│  ├───14,484,704 B (07.46%) ── script-data
│  ├───13,062,744 B (06.73%) ── string-chars
│  ├────9,300,704 B (04.79%) -- shapes-extra
│  │    ├──3,325,952 B (01.71%) ── compartment-tables
│  │    ├──2,845,984 B (01.47%) ── tree-tables
│  │    ├──2,125,056 B (01.09%) ── dict-tables
│  │    └──1,003,712 B (00.52%) ── tree-shape-kids
│  ├────7,688,912 B (03.96%) -- type-inference
│  │    ├──5,750,576 B (02.96%) ── script-main
│  │    ├──1,368,560 B (00.70%) ── object-main
│  │    └────569,776 B (00.29%) ── tables
│  ├────6,232,272 B (03.21%) -- objects
│  │    ├──4,406,720 B (02.27%) ── slots
│  │    ├──1,726,640 B (00.89%) ── elements
│  │    └─────98,912 B (00.05%) ── misc
│  ├────4,256,768 B (02.19%) ── cross-compartment-wrappers
│  └──────727,696 B (00.37%) ── mjit-data
├───19,472,384 B (10.03%) -- gc-heap
│   ├──18,006,016 B (09.27%) ── unused-arenas
│   ├───1,458,176 B (00.75%) ── chunk-admin
│   ├───────8,192 B (00.00%) ── decommitted-arenas
│   └───────────0 B (00.00%) ── unused-chunks
└───15,642,320 B (08.06%) ── runtime

The contents of the “js-main-runtime/compartments” sub-tree is the sum of all the individual compartment entries in the “explicit/js” sub-tree, and the “js-main-runtime” total is the same as the “explicit/js” total.  This new view will become more important when per-tab memory reporting is implemented which will cause each tab’s JavaScript memory consumption to be reported separately.

The second part is designed to show the utilization of the garbage-collected heap.  The new measurements and presentation are more detailed and easier to understand than the old version.  Here’s an example.

93,315,072 B (100.0%) -- js-main-runtime-gc-heap-committed
├──55,755,888 B (59.75%) -- used
│  ├──53,068,256 B (56.87%) ── gc-things
│  ├───1,458,176 B (01.56%) ── chunk-admin
│  └───1,229,456 B (01.32%) ── arena-admin
└──37,559,184 B (40.25%) -- unused
   ├──19,553,168 B (20.95%) ── gc-things
   ├──18,006,016 B (19.30%) ── arenas
   └───────────0 B (00.00%) ── chunks

One thing this makes clear is that our “unused” fraction is often very high.  We’ll need a compacting generation garbage collector to really fix that.  This is being actively worked on, but it’s a large task.

Nathan Froyd had a productive couple of weeks.

These four reporters don’t cover a great deal of memory, but that’s inevitable these days;  all the low-handing “heap-unclassified” fruit is gone, and the remaining improvements will necessarily be small.  We’re gradually closing in on the target of 10%, though I’m not sure we’ll ever get there.

Nils Maier added some more identifying information to JavaScript sandboxes, which will help identify them in about:memory.

Bas Schouten added a memory reporter for VRAM used by Azure.

Fixed Leaks

Robert O’Callahan fixed a leak involving canvas, which I won’t pretend to understand.  This also fixed bug  757749.

Cervantes Yu fixed a B2G memory leak that would leak about 1MB of memory per day.  This was found by Valgrind, under the operation of Julian Seward.

Quote of the Week

A Hacker News thread contained the following comment.

Mozilla needs to focus on making its browser consume less memory and CPU when idle. These are the things that are killing its marketshare and leading users to switch to alternatives. Every time I see initiatives like the password account manager, iOS apps that use web view, a browser based editor and what not I just scratch my head because Firefox marketshare is plummeting and the old refrain “just wait until the next version” was tired since 3.0. Instead the general response is to get defensive and list new features. Yeah and are those new features stopping the user drain? Nope. Firefox is a sluggish memory sucking heap of software that drains resources even when it isn’t being used.

I love and cherish Firefox as a product and a brand, because you have achieved a lot in your past. But now you are failing and it is depressing to see this happen.

That’s not the quote of the week, BTW;  I’ve heard variations of that many times before, and while it had some truth to it 18 months ago, that piece of conventional wisdom is now well past its use-by date.  Pleasingly, there was quite a bit of push-back in response.  My favourite comment, which is the quote of the week, was the following.

Firefox is to Ford what Chrome is to Toyota. Even if Firefox is as reliable and efficient as Chrome these days, some people still see it as being the gas-guzzling unreliable Ford vehicle of yesteryear.

A bad reputation is a difficult thing to lose.

Bug Counts

Here are the current bug counts.

  • P1: 23 (-2/+0)
  • P2: 87 (-10/+9)
  • P3: 106 (-3/+3)
  • Unprioritized: 2 (-2/+2)

A net change of -2 P1 bugs, and -1 P2 bugs.  Not bad!

Categories
about:memory compartments Firefox Memory consumption MemShrink

MemShrink’s 1st Birthday

A year ago today, the first meeting of the MemShrink project took place.  The project had been announced almost three months earlier, but until that first meeting it was basically just me working on it and there wasn’t much momentum.  So I now think of those three months as something of a gestation period, and the first meeting as the true birth of the project.

So, happy birthday, MemShrink!  I’ll take this opportunity to go over some of the accomplishments we’ve made in the past year.

Big Win #1: Better Javascript Heap Management

There have been two huge MemShrink improvements that stand out in my mind.  The first one happened very early on, and it consisted of two related changes, both implemented by Gregor Wagner.

In Firefox 4, the implementation of the JavaScript heap was totally overhauled.  In particular, it was segregated into compartments, each of which held (roughly speaking) the memory for a single domain.  System compartments, i.e. those for JavaScript code that implements parts of Firefox (such as the UI), tend to be long-lived.  In contrast, user compartments, i.e. those for JavaScript code in web pages, tend to be short-lived.  But memory from both system and user compartments was being co-located in 1MB chunks.  What tended to happen is that if you browsed for a long time and then closed many tabs, you’d end up with lots of 1MB chunks that were kept alive by a small amount of memory from system compartments.  This is a form of fragmentation, and it prevented Firefox from releasing lots of memory back to the operating system that it should have been able to.

Fortunately, Gregor came up with a simple fix:  don’t allow system and user compartments to share the same 1MB chunks.  To see just how effective this was, consider this visualization of the JavaScript heap after closing many tabs, without Gregor’s change.

badly fragmented JavaScript heap

Each horizontal line is a 1MB chunk, and each square is a 4KB arena.  White squares are unused arenas, and coloured squares are in use.  Arenas belong to a particular compartment all have the same colour;  there are three compartments alive, all of which are system compartments.  You can see that many 1MB chunks are kept alive by a small number of arenas.

After Gregor’s change, in this scenario the heap ended up looking like this.

non-fragmented JavaScript heap

Much better.

Gregor’s second change related to garbage collection scheduling.  In Firefox 4 the garbage collection heuristics were poorly tuned, and the garbage collector simply didn’t run frequently enough.  Many people who left Firefox open for a while came back to find that JavaScript memory consumption had ballooned, and the machine was unusable due to paging, for seconds or minutes, until the garbage collector kicked in and paging finished.  The fix was simple:  run the garbage collector occasionally, using a timer.

These two fixes of Gregor were the main reason why the first item in the Firefox 7 release notes was “drastically improved memory handling for certain use cases”.  More specifically, Firefox 7 used less memory than Firefox 6 (and 5 and 4): often 20% to 30% less, and sometimes as much as 50% less.

Big Win #2: Fewer add-on Leaks

The second huge MemShrink improvement is much more recent.  In fact it hasn’t even made it into a released version of Firefox yet.  And the path towards it was much more circuitous.

I first revamped about:memory in May of last year, and those changes made it into Firefox 6. This started giving us insight into Firefox’s memory consumption, but it wasn’t until I broke up the reporting of JS memory consumption on a per-compartment basis that it really started to make a difference.  (This change made it into Firefox 7, another reason why that release was so good from a memory consumption point of view.)

Per-compartment reporters made some blatant inefficiencies obvious, which were quickly fixed.  More importantly, people quickly noticed that sometimes compartments were present for sites that had been closed long ago.  This is a kind of memory leak that became known as a zombie compartment, and hunting them became a popular enough sport that  more than 100 zombie compartment bug reports have been filed.

Some of the zombie compartments were due to defects in Firefox itself, and these were generally fixed fairly quickly.  However, it soon became clear that the majority of them are due to add-ons.  It’s quite easy to unintentionally create zombie compartments in add-ons.  In the worst case, add-ons could leak the compartment of every single site visited.

This led to some lively discussion about how best to handle these leaks, because they are defects in third-party code that is largely out of Mozilla’s control, and yet they make Firefox look bad.  Fortunately, this discussion became mostly moot when Kyle Huey took advantage of an 8,000 mile trip from home to implement a crazy idea he’d had six months earlier —  when a tab is closed, simply cut the references from other compartments that would keep the compartment of the tab’s page alive.  This turns out to work tremendously well and prevents most of the cases where add-ons can create zombie compartments.  This change is scheduled to ship in Firefox 15, which is due for release in late August, and should more or less fix what I six months ago ranked as the single worst problem affecting Firefox’s memory consumption.

The Key Tool: Memory Reporters and About:memory

I mentioned about:memory above.  It’s worth discussing in more detail, because it’s the single most important tool we’ve created, and has driven a lot of the MemShrink improvements.

Let’s look at about:memory as it was in Firefox 6, which was released about 10 months ago.about:memory screenshot from Firefox 6

Even these early versions had several key properties.

  • about:memory doesn’t need a special build to run;  it works even in released versions.
  • It is trivially easy to use — you just type “about:memory” in the address bar.
  • Because it’s all text you can cut and paste the output, and unlike many web pages it is carefully constructed so that it reproduces beautifully when you do so.  No screenshots are necessary.

These properties massively expand the number of people who are able to detect and report problems relating to memory consumption.  Any Firefox user can potentially do it;  if the user doesn’t already know how, they can be taught in 10 seconds.

Having said that, this old version is almost laughably primitive compared to what we have now.  First, let’s consider the state of the memory reporting infrastructure, which about:memory completely relies on, as it was at that time.

  • There were a fixed number of measurements, which meant there were no individual measurements for variable-numbered entities such as compartments, window objects, or SQLite connections.  Such measurements were only possible once I added support for memory multi-reporters.  We now have dozens of measurements per variable-numbered entity, and thousands of measurements in total.
  • Even once per-compartment reporters were added, we still didn’t have much insight into the memory consumption of the JavaScript code used by Firefox itself (and its add-ons).  But compartment-per-global landed recently and gave us much finer-grained measurements, which (a) gives us some idea of how much memory is being used by JavaScript-based add-ons, and (b) gets us very close to being able to report memory consumption for each tab.  Users have been requesting both of these things for years.
  • Early memory reporters had lots of defects that caused them to report incorrect numbers, but these were obvious only when the numbers were ridiculously large or negative (both of which happened on occasion).  The first of two major improvements in correctness came about as we learned how to structure memory reporters to avoid common defects.  In particular, it’s best to write reporters that are traversal-based rather than counter-based, and to measure heap blocks with malloc_usable_size rather than computing the sizes.  Reporters that use malloc_usable_size also measure slop bytes, which are caused by the heap allocator rounding up allocation requests and can account for 5–10% of the heap.  Early reporters didn’t have these characteristics, but most of them have been converted now.
  • Reporters with these characteristics are doubly-virtuous, because they also integrate well with DMD, a tool I wrote that dynamically checks memory reports.  DMD provided the second major improvement in memory reporter correctness, because it identifies heap blocks that are counted twice, which is a mistake that’s easy to make.
  • DMD also identifies unreported heap blocks, and was crucial in getting the “heap-unclassified” number down.  In the example above it was 68.82%(!), whereas now it’s typically around 15%, which is low enough that people have mostly stopped complaining about it.  Prior to DMD, identifying this “dark matter” was much harder and less systematic.
  • The only tree shown in the above example is “explicit”.  On Linux, Justin Lebar added code to summarize the information in the /proc/<pid>/smaps file in “size”, “rss”, “pss” and “swap” trees.
  • The reporters back then could only report byte measurements.  They can now report unitless counts and percentages, both of which are useful.

Now consider the about:memory page itself, as it was back then.

  • Insignificant measurements were simply omitted, and you had to reload in verbose mode to see them (and the measurements would be re-taken when that happened, potentially losing any interesting measurements).  Now it is possible to expand and collapse arbitrary parts of the trees on the fly.
  • The “Other Measurements” section contained a flat list of measurements.  Trees are now possible, which makes that section more flexible and easier to understand.
  • about:memory’s has been carefully streamlined to consume as little memory as possible, so that it doesn’t perturb what it’s measuring.  This is really important now that we report so many measurements.
  • about:memory now has a companion page, about:compartments, that just lists compartments (and ghost windows).  about:compartments shares a lot of code with about:memory, and it is better than about:memory for certain tasks such as spotting zombie compartments.

All this stuff is important because you make what you measure.  Just about every time we’ve started measuring some new thing, we’ve found and fixed problems as a result.

Smaller Things

The following smaller accomplishments were also made in the past year.

  • John Schoenick used the MozMill endurance tests to build areweslimyet.com, which helps identify regressions in memory consumption.
  • I removed a lot of unnecessary memory waste caused by “clownshoes” allocations.
  • Olli Pettay wrote about:cc and Jan Honza Odvarko wrote about:ccdump.  These closely related tools have been used to find various cycle collector leaks.
  • I wrote 41 progress reports.  I had/have two goals with these:  to keep interested people informed of what it happening, and to provide evidence that Mozilla actually does care about memory consumption in Firefox.

This is only the tip of the iceberg, though.  As I am writing this, there have been 314 MemShrink-tagged bugs marked FIXED in Bugzilla.  In comparison, there are only 221 MemShrink-tagged bugs currently open.  Breaking them down by priority we get the following.

  • P1: 52 fixed, 25 open
  • P2: 135 fixed, 88 open
  • P3: 53 fixed, 106 open
  • Unprioritized: 74 fixed, 2 open

Over 75 people were responsible for these fixes.  I give many thanks to all those people, plus everybody who contributed in any other way to fixes, such as bug reporters and patch reviewers.  And I’d like to give extra thanks to the MemShrink regulars:  Justin Lebar, Kyle Huey, Andrew McCreight, Johnny Stenback, and Jet Villegas.

What’s Next?

There’s no real secret to MemShrink.  So far it’s basically been a long, steady grind, gradually improving tools, fixing leaks, slimming down data structures, and responding to user’s problems.  There are no plans to change that, and we’ll continue our recently-lowered pace of fortnightly meetings for the foreseeable future.  And if we’re lucky, I might be writing a report on MemShrink’s second birthday a year from now!

Categories
about:compartments about:memory add-ons Firefox Garbage Collection Memory consumption MemShrink Performance

MemShrink progress, week 51-52

Memory Reporting

Nathan Froyd added much more detail to the DOM and layout memory reporters, as the following example shows.

├──3,268,944 B (03.76%) -- window(http://www.reddit.com/)
│  ├──1,419,280 B (01.63%) -- layout
│  │  ├────403,904 B (00.46%) ── style-sets
│  │  ├────285,856 B (00.33%) -- frames
│  │  │    ├───90,000 B (00.10%) ── nsInlineFrame
│  │  │    ├───72,656 B (00.08%) ── nsBlockFrame
│  │  │    ├───62,496 B (00.07%) ── nsTextFrame
│  │  │    ├───42,672 B (00.05%) ── nsHTMLScrollFrame
│  │  │    └───18,032 B (00.02%) ── sundries
│  │  ├────259,392 B (00.30%) ── pres-shell
│  │  ├────168,480 B (00.19%) ── style-contexts
│  │  ├────160,176 B (00.18%) ── pres-contexts
│  │  ├─────55,424 B (00.06%) ── text-runs
│  │  ├─────45,792 B (00.05%) ── rule-nodes
│  │  └─────40,256 B (00.05%) ── line-boxes
│  ├────986,240 B (01.13%) -- dom
│  │    ├──780,056 B (00.90%) ── element-nodes
│  │    ├──156,184 B (00.18%) ── text-nodes
│  │    ├───39,936 B (00.05%) ── other [2]
│  │    └───10,064 B (00.01%) ── comment-nodes
│  └────863,424 B (00.99%) ── style-sheets

Although these changes slightly improved the coverage of the reporters (i.e. they reduce “heap-unclassified” a bit), the more important effect is that they give greater insight into DOM and layout memory consumption.  [Update:  Nathan blogged about these changes.]

I modified the memory reporter infrastructure and about:memory to allow trees of measurements to be shown in the “Other Measurements” section of about:memory.  The following excerpt shows two sets of measurements that were previously shown in a flat list.

108 (100.0%) -- js-compartments
├──102 (94.44%) ── system
└────6 (05.56%) ── user

3,900,832 B (100.0%) -- window-objects
├──2,047,712 B (52.49%) -- layout
│  ├──1,436,464 B (36.82%) ── style-sets
│  ├────402,056 B (10.31%) ── pres-shell
│  ├────100,440 B (02.57%) ── rule-nodes
│  ├─────62,400 B (01.60%) ── style-contexts
│  ├─────30,464 B (00.78%) ── pres-contexts
│  ├─────10,400 B (00.27%) ── frames
│  ├──────2,816 B (00.07%) ── line-boxes
│  └──────2,672 B (00.07%) ── text-runs
├──1,399,904 B (35.89%) ── style-sheets
└────453,216 B (11.62%) -- dom
     ├──319,648 B (08.19%) ── element-nodes
     ├──123,088 B (03.16%) ── other
     ├────8,880 B (00.23%) ── text-nodes
     ├────1,600 B (00.04%) ── comment-nodes
     └────────0 B (00.00%) ── cdata-nodes

This change improves the presentation of measurements that cross-cut those in the “explicit” tree.  I intend to modify a number of the JS engine memory reports to take advantage of this change.

One interesting bug was this one, where various people were seeing multiple compartments for the same site in about:compartments, as the following excerpt shows.

https://bugzilla.mozilla.org/
https://bugzilla.mozilla.org/, about:blank

It turns out this is not a bug.  The sites in question contain an empty iframe that doesn’t specify a URL, and so the memory reporters are doing exactly the right thing.  Still, a useful case to know about when reading about:compartments.

Add-ons

Justin Lebar fixed the FUEL API, which is used by numerous add-ons including Test Pilot and PDF.js, so that it doesn’t leak most of the objects it creates.  This leak caused 10+ minute shut-down times(!) for one user, so it’s a good one to have fixed.

Kyle Huey briefly broke his own Hueyfix, and then fixed it.  You had us worried for a bit there, Kyle!

asgerklasker fixed a leak in the HttpFox add-on that caused zombie compartments.

Miscellaneous

I restricted the amount of context that is shown in JavaScript error messages.  This fixed a longstanding bug where if you had enabled the javascript.options.strict option in about:config, and you had the error console open or Firebug installed, memory consumption would spike dramatically when viewing pages that contain JavaScript code that triggered many strict warnings.  This bug manifested rarely, but would bring Firefox to its knees when it did.

Asaf Romano fixed a leak that caused a zombie compartment if you used the “Highlight All” checkbox when doing a text search in a page.

Mike Hommey finished importing the new version of jemalloc into the Mozilla codebase, and then wrote about it.  The new version is currently disabled, but we hope to turn it on soon.  Preliminary experiments indicate that the new version is unlikely to affect performance or memory consumption much.  However, it will be good to be on a version that is in sync with the upstream version, instead of having a highly hacked Mozilla-specific version.

Justin Lebar wrote a nice blog post explaining what “ghost windows” are, and how we’ve used them to gauge some recent leak fixes.

Till Schneidereit fixed a garbage collection defect that could cause memory usage to spike in certain cases involving Firefox Sync.

LifeHacker published a new browser performance comparison which looked at Firefox 13, Chrome 19, IE9, and Opera 11.64.  Firefox did the best overall and also won both the memory consumption tests.  I personally take these kinds of comparisons with a huge bucket of salt.  Indeed, quoting from the article:

Our tests aren’t the most scientific on the planet, but they do reflect a relatively accurate view of the kind of experience you’d get from each browser, speed-wise.

If you ask me, the text before the “but” contradicts the rest of the sentence.  What I found more interesting was the distinct lack of “lolwut everyone knows Chrome is faster than Firefox” comments, which I’m used to seeing when Firefox does well in these kinds of articles.

Bug Counts

Here are the current bug counts.

  • P1: 25 (-1/+3)
  • P2: 88 (-3/+6)
  • P3: 106 (-0/+4)
  • Unprioritized: 2 (-2/+2)

Nothing too exciting there.