So you’ve used OWASP ZAP to scan your web application, and its taking far too long 🙁
Is that it, do you have to lump it or leave it?
There are actually many things you can do, but the first thing you have to do is work out why its taking a long time.
How Scanners work
It helps to understand how scanners like ZAP work.
Typically they explore the application using a spider (also known as a crawler). This identifies all of the URLs that make up the application, all of the forms and all of the parameters.
They then usually attack every parameter on every page.
The time a scan takes is therefore based on:
[Number pages] x [number parameters] x [number attacks] x [how long a request takes] / [number of threads]
There will be a practical limit to the number of threads that will actually be useful – you will always be limited by the network and the amount of processing power on both the target application and the attacking machine (especially if they are the same!).
So if you have a very large application with lots of pages and parameters running on a relatively slow machine then with a default configuration any scanner will take a long time to complete!
However most scanners are very configurable, so even if you do have a massive application there are lots of approaches you can use.
When investigating performance issues with ZAP I recommend running it with the UI even if you want to run it in headless mode in the end – it will allow you to see whats going on much more effectively.
How to identify the bottlenecks
The most important thing is to identify the underlying causes, and there are many possibilities, any or all of which could be the culprits:
- Target application/machine overloaded
- Attacking machine overloaded
- Network overloaded
- Firewall throttling connections
- Spider looping
- Too many pages + params + tests
- Inappropriate tests
- Badly written tests
- Unnecessary / duplicated tests
Hardware and networks
It is worth identifying hardware and network related issues first.
Have a look at the CPU usage on both the target and attacking (the one with your scanner) machines – are either of them excessively high? If either machine is underpowered or with low memory then you may need to look at using more powerful machines.
Check the target application logs – ZAP has a tendency to overwhelm applications that are not designed with high performance in mind 😉
Crucially you should look at the number of requests that ZAP is making.
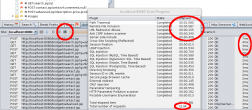
Both the Spider and Active Scanner dynamically report the URLs that they have accessed. The Spider shows a count of URIs it has found on its toolbar – you can expect this to rise quickly at the start and then tail off as the Spider progresses:
(Click on any of the screenshots to see larger versions)
The Active Scanner has a “Scan Progress Detail” popup accessible from its toolbar that shows the time each rule has taken, the total number of requests and the time each request took:
How fast requests can be made will depend on many factors, but if each request is taking over a second then you are likely to have a hardware or network problem that is outside of the scope of this blog post!
If requests are taking an excessively long time then check to see if there is something on your network that might be throttling the connection, having identified ZAP as a potentially malicious tool 🙂
The spider
If the spider never completes then have a look at the requests it is making. If it appears to be making very similar requests then it might have got stuck in a loop.
This shouldnt happen – there is code to prevent that – but if it does then you should report the problem and in the meantime you can use regex excludes to prevent the spider accessing the links that cause it problems.
The scanner rules
Have a look at the “Scan Progress Detail” popup after the scan has completed – this will show you which rules were run and how long they each took.
If one rule is taking significantly longer than the other then there may be a problem with it – report it and we’ll look into it. This is more likely with the alpha and beta scan rules than the release quality ones.
Also have a good look at which rules are being run – if you know your application is definitely not using an SQL database then there is no point running those rules. You can configure which rules are run via the Policy dialog which is also linked off the Active Scan toolbar:
ZAP configuration
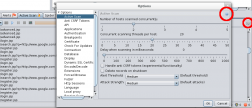
There are also various spider and active scanner options which you should double check – the defaults are good for most cases but may have been changed or may not be suitable for your environment. These are accessible via the top level “Tools/Options…” menu or from the relevant toolbar:
Check that they are set to sensible values – click on the blue ‘?’ help icon in the top right hand corner as this gives much more information about the parameters.
Be especially aware of the active scanner “Delay when scanning in milliseconds” – this should usually be set to zero, particularly if the scan is taking too long.
The “Attack Strength” is also important – this is roughly the number of requests you can expect each rule to make on every parameter on every page. All rules are unique and some only ever use a very small number of requests, but in general assume:
- Low – to be up to 6 requests
- Medium – to be up to 12 requests
- High- to be up to 24 requests
- Insane- to be over 24 requests, potentially hundreds
The default is Medium – you should not go higher than this if you are having performance problems. In a future release we are planning on allowing the Attack Strength to be configured on a per rule basis.
Also be aware that while the the “Handle anti CSRF tokens” option is very useful if your application uses anti CSRF tokens, it can significantly impact performance as it forces the scanner to run single threaded.
The application structure
The final recommendation can potentially have the biggest effect – it’s always worth saving the best until last 🙂
Have a look at the structure of your application in the Sites tree – are there a very large number of nodes anywhere in the application?
I have been working with the Mozilla QA team to get ZAP security tests included in their Selenium service.
One particular site was taking so long that they thought ZAP had hung – it hadnt, but in the end took 13 hours to complete the scan!
When I looked at the Sites tree I found that one node had many thousands of children. It turned out that this part of the application was data driven, and there were a very large number of records which all ‘generated’ multiple pages. So ZAP was attacking the same code in the same way thousands of times, which was pointless – the important thing is to attack the code, not to worry about all of the data held in the db.
We fixed this by adding a “Exclude from scanner” rule. We could have excluded the whole subtree, but we wanted to scan the code at least once, so we came up with a regex expression similar to:
".*/bigsubtree/(?!justincthispart).*"
which excluded everything apart from a relatively small subset of the child nodes, ie the “justincthispart” subtree under “bigsubtree”.
This had a dramatic effect – the spider and active scanner now complete in 40 minutes!
Online help
And if none of that helps then get in touch!
ZAP user group: https://groups.google.com/group/zaproxy-users
ZAP developer group:https://groups.google.com/group/zaproxy-develop
IRC: #websectools on irc.mozilla.org (https://irc.lc/mozilla/websectools/zapuser???)
Simon Bennetts (Mozilla Security Team and ZAP Project Lead)


Itay wrote on