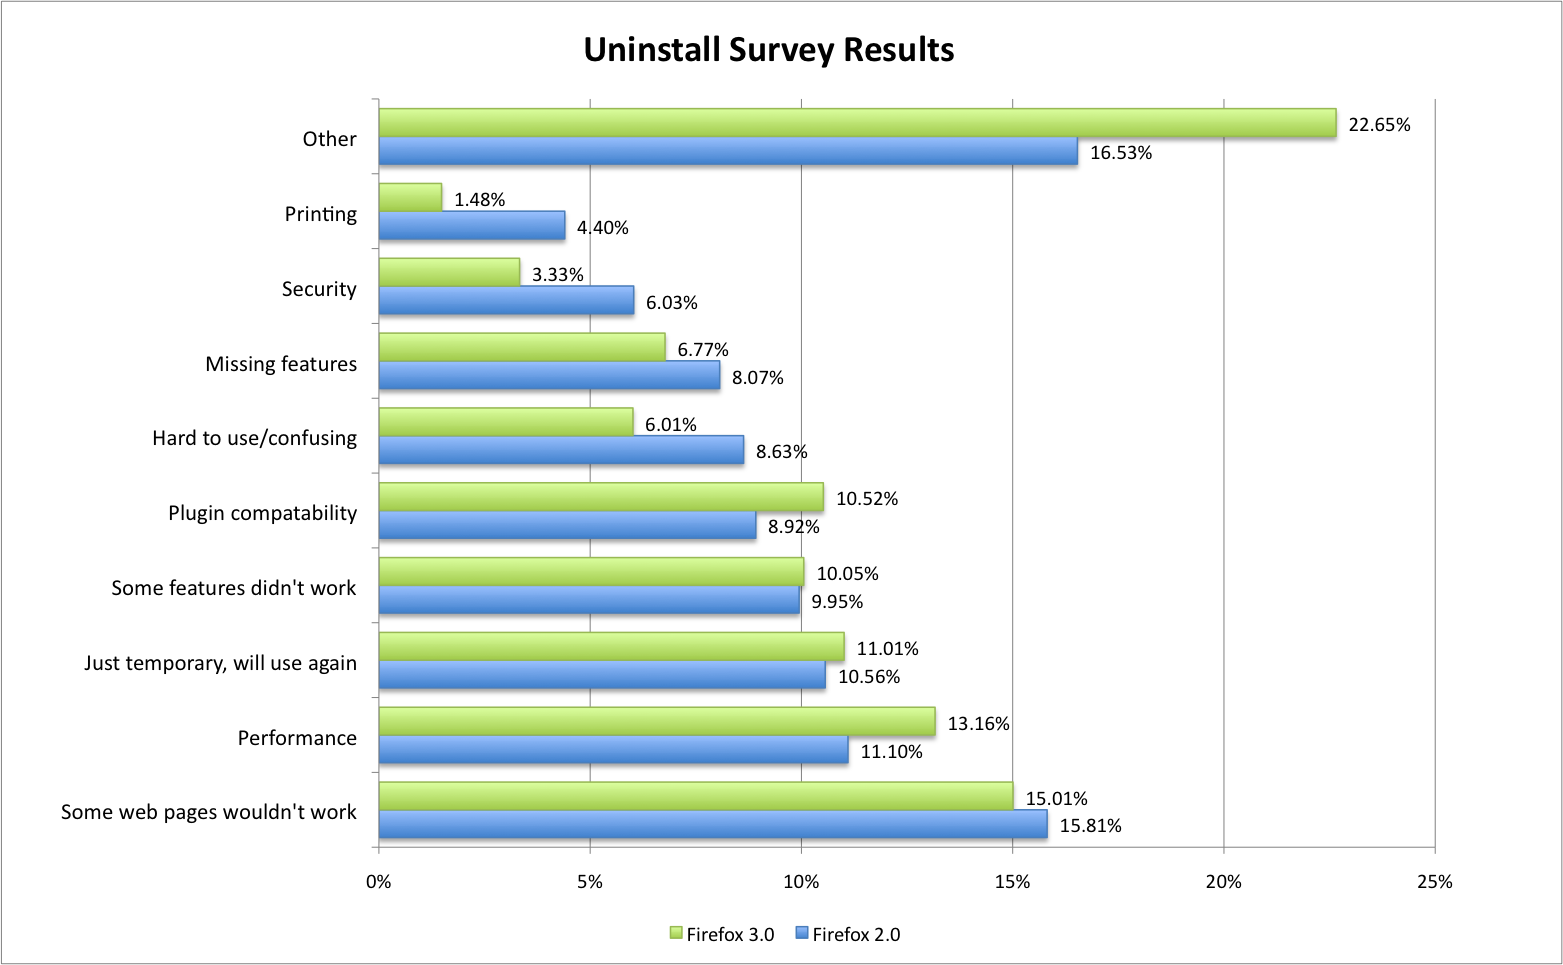
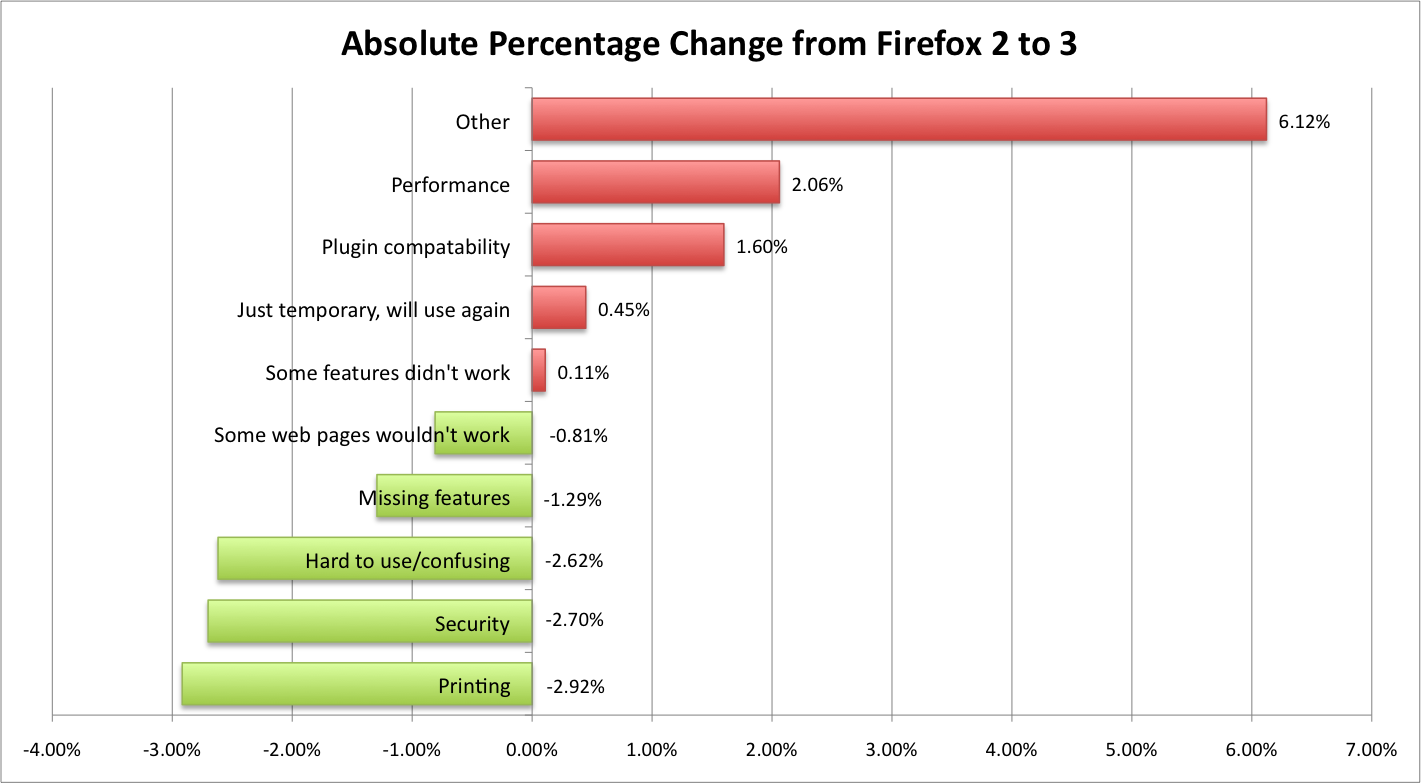
Now that we’ve taken a macro view of a few uninstall survey trends, we can dig into some of the details. The following two charts summarize the response to the second multiple choice question: “Why did you uninstall Firefox? (select all that apply).”
The initial results are encouraging. Fewer users uninstalled due to printing, security, usability, missing features, and web page rendering. Furthermore, more users were planning to return to Firefox! Perhaps the biggest surprise is the 2.6 percent increase in users uninstalling due to performance. We do not know whether this increase is due to (perceived) slower performance, to more crashes, to installation difficulties, or to a change in expectations.
While the response trends are generally positive, the survey itself has a number of areas for improvement. I have identified three areas where the uninstall survey falls short:
- The question wording is unclear (performance, security, etc.)
- The responses are clustered around 12% and don’t provide a clear area of focus
- The responses are broken down by neither geography nor localization
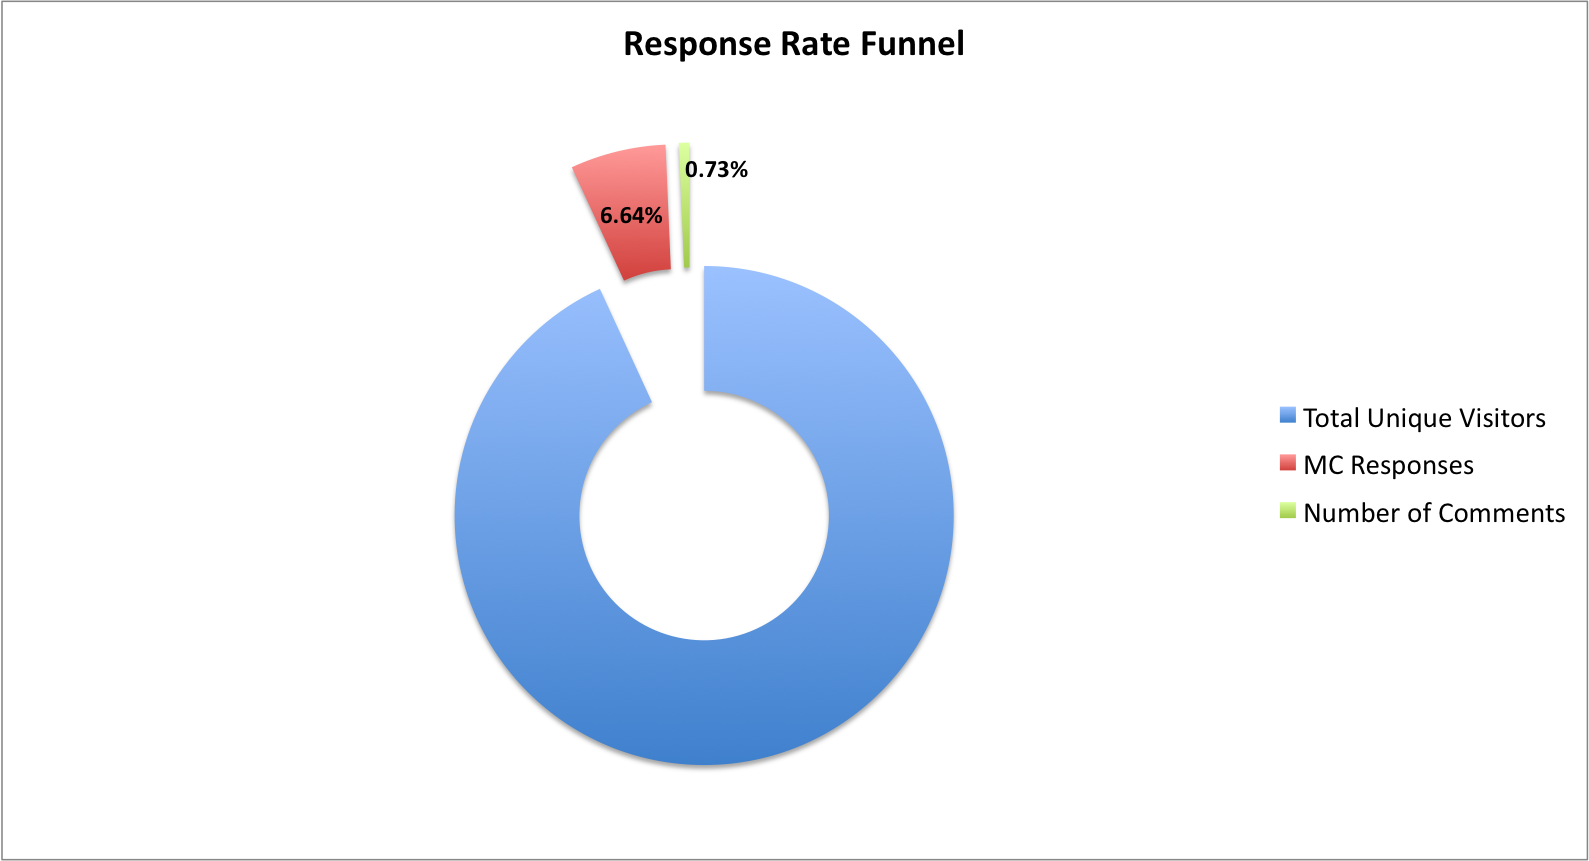
Perhaps most troubling is the low response rate, depicted in the chart below.
Of 113,000 visitors to the uninstall survey in March, fewer than 8,000 left a multiple choice response. And, of those respondents, only 826 left a comment. I expect that the low response rate is due to the fact that that the survey is not localized. Nearly 90 percent of visitors to the uninstall survey live in non-English speaking countries.
In the next post I will suggest new questions for the uninstall survey and propose survey tool solutions that may help Mozilla address these areas of concern. Please leave your thoughts and suggestions for uninstall survey improvements.


Jesse Ruderman wrote on
:
Gru wrote on
:
Simon Geard wrote on
:
Simon Geard wrote on
:
Sean Hogan wrote on
:
Simon Geard wrote on
:
palmiche wrote on
:
Gru wrote on
:
Hescott wrote on
:
Harry wrote on
: