Categories
about:memory Firefox MemShrink

Per-class JS object and shape measurements in Firefox’s about:memory

A few days ago I landed support for per-class reporting of JavaScript objects and shapes in about:memory. (Shapes are auxiliary, engine-internal data structures that are used to facilitate object property accesses. They can use large amounts of memory.)

Prior to this patch, the JavaScript objects and shapes within a single compartment (which corresponds to a JavaScript window or global object) would be covered by measurements in a small number of fixed categories.

10,179,152 B (02.59%) -- objects
├───6,749,600 B (01.72%) -- gc-heap
│   ├──3,512,640 B (00.89%) ── dense-array
│   ├──2,965,184 B (00.75%) ── ordinary
│   └────271,776 B (00.07%) ── function
├───3,429,552 B (00.87%) -- malloc-heap
│   ├──2,377,600 B (00.61%) ── slots
│   └──1,051,952 B (00.27%) ── elements/non-asm.js
└───────────0 B (00.00%) ── non-heap/code/asm.js
474,144 B (00.12%) -- shapes
├──316,832 B (00.08%) -- gc-heap
│  ├──167,320 B (00.04%) -- tree
│  │  ├──152,400 B (00.04%) ── global-parented
│  │  └───14,920 B (00.00%) ── non-global-parented
│  ├──125,352 B (00.03%) ── base
│  └───24,160 B (00.01%) ── dict
└──157,312 B (00.04%) -- malloc-heap
   ├───99,328 B (00.03%) ── compartment-tables
   ├───35,040 B (00.01%) ── tree-tables
   ├───12,704 B (00.00%) ── dict-tables
   └───10,240 B (00.00%) ── tree-shape-kids

These measurements are only interesting to those who understand the guts of the JavaScript engine.

In contrast, objects and shapes are now grouped by their class. Per-class measurements relate back to the JavaScript code in a more obvious way, making these measurements useful to a wider range of people.

10,515,296 B (02.69%) -- classes
├───4,566,840 B (01.17%) ++ class(Array)
├───3,618,464 B (00.93%) ++ class(Object)
├───1,755,232 B (00.45%) ++ class(HTMLDivElement)
├─────333,624 B (00.09%) ++ class(Function)
├─────165,624 B (00.04%) ++ class(<non-notable classes>)
├──────38,736 B (00.01%) ++ class(Window)
└──────36,776 B (00.01%) ++ class(CSS2PropertiesPrototype)

(The <non-notable classes> entry aggregates all classes that are smaller than a certain threshold. This prevents any long tail of classes from bloating about:memory too much.)

Expanding the sub-tree for the Object class, we see that the fixed categories are still present, for those who are interested in them.

3,618,464 B (00.93%) -- class(Object)
├──3,540,672 B (00.91%) -- objects
│  ├──2,349,632 B (00.60%) -- malloc-heap
│  │  ├──2,348,480 B (00.60%) ── slots
│  │  └──────1,152 B (00.00%) ── elements/non-asm.js
│  └──1,191,040 B (00.30%) ── gc-heap
└─────77,792 B (00.02%) -- shapes
      ├──57,376 B (00.01%) -- gc-heap
      │  ├──47,120 B (00.01%) ── tree
      │  ├───5,360 B (00.00%) ── dict
      │  └───4,896 B (00.00%) ── base
      └──20,416 B (00.01%) -- malloc-heap
         ├──11,552 B (00.00%) ── tree-tables
         ├───6,912 B (00.00%) ── tree-kids
         └───1,952 B (00.00%) ── dict-tables

Although the per-class measurements often aren’t surprising — Object and Array objects and shapes often dominate — sometimes they are. Consider the following examples.

  • The above example has 1.7 MiB of HTMLDivElement objects and shapes, which indicates that the compartment contains many div elements.
  • If you have lots of memory used by Function objects and shapes, it suggests that the code is creating excessive numbers of closures.
  • Just this morning a visitor to the #memshrink IRC channel was wondering why they had 11 MiB of XPC_WN_NoMods_NoCall_Proto_JSClass objects and shapes in one compartment. (This is a question I currently don’t have a good answer for.)

Historically, the data-dependent measurements in about:memory — e.g. those done on a per-tab, or per-compartment, or per-image, or per-script basis — have been more useful and interesting than the ones in fixed categories, because they map obviously to browser and code artifacts. For example, per-tab measurements let you know if a particular web page is using excessive memory, and per-compartment measurements revealed the existence of zombie compartments, a kind of bad memory leak that used to be common in Firefox and its add-ons.

I’m hoping that these per-class measurements will prove similarly useful. Keep an eye on them, and please let me know and/or file bugs if you see any surprising cases.

A final note: Mozilla’s devtools team is currently making great progress on a JavaScript memory profiler, which will give finer-grained measurements of JavaScript memory usage in web content. Although there will be some overlap between that tool and these new measurements in about:memory, it will useful to have both tools, because each one will be appropriate in different circumstances.

Categories
Firefox Memory consumption MemShrink

The story of a tricky bug

The Bug Report

A few weeks ago I skimmed through /r/firefox and saw a post by a user named DeeDee_Z complaining about high memory usage in Firefox. Somebody helpfully suggested that DeeDee_Z look at about:memory, which revealed thousands of blank windows like this:

  │    │  ├────0.15 MB (00.01%) ++ top(about:blank, id=1001)
  │    │  ├────0.15 MB (00.01%) ++ top(about:blank, id=1003)
  │    │  ├────0.15 MB (00.01%) ++ top(about:blank, id=1005

I filed bug 1041808 and asked DeeDee_Z to sign up to Bugzilla so s/he could join the discussion. What followed was several weeks of back and forth, involving suggestions from no fewer than seven Mozilla employees. DeeDee_Z patiently tried numerous diagnostic steps, such as running in safe mode, pasting info from about:support, getting GC/CC logs, and doing a malware scan. (Though s/he did draw the line at running wireshark to detect if any unusual network activity was happening, which I think is fair enough!)

But still there was no progress. Nobody else was able to reproduce the problem, and even DeeDee_Z had trouble making it happen reliably.

And then on August 12, more than three weeks after the bug report was filed, Peter Van der Beken commented that he had seen similar behaviour on his machine, and by adding some logging to Firefox’s guts he had a strong suspicion that it was related to having the “keep until” setting for cookies set to “ask me every time”. DeeDee_Z had the same setting, and quickly confirmed that changing it fixed the problem. Hooray!

I don’t know how Peter found the bug report — maybe he went to file a new bug report about this problem and Bugzilla’s duplicate detection identified the existing bug report — but it’s great that he did. Two days later he landed a simple patch to fix the problem. In Peter’s words:

The patch makes the dialog for allowing/denying cookies actually show up when a cookie is set through the DOM API. Without the patch the dialog is created, but never shown and so it sticks around forever.

This fix is on track to ship in Firefox 34, which is due to be released in late November.

Takeaway lessons

There are a number of takeaway lessons from this story.

First, a determined bug reporter is enormously helpful. I often see vague complaints about Firefox on websites (or even in Bugzilla) with no responses to follow-up questions. In contrast, DeeDee_Z’s initial complaint was reasonably detailed. More importantly, s/he did all the follow-up steps that people asked her/him to do, both on Reddit and in Bugzilla. The about:memory data made it clear it was some kind of window leak, and although the follow-up diagnostic steps didn’t lead to the fix in this case, they did help rule out a number of possibilities. Also, DeeDee_Z was extremely quick to confirm that Peter’s suggestion about the cookie setting fixed the problem, which was very helpful.

Second, many (most?) problems don’t affect everyone. This was quite a nasty problem, but the “ask me every time” setting is not commonly used because causes lots of dialogs to pop up, which few users have the patience to deal with. It’s very common that people have a problem with Firefox (or any other piece of software), incorrectly assume that it affects everyone else equally, and conclude with “I can’t believe anybody uses this thing”. I call this “your experience is not universal“. This is particular true for web browsers, which unfortunately are enormously complicated and have many combinations of settings get little or no testing.

Third, and relatedly, it’s difficult to fix problems that you can’t reproduce. It’s only because Peter could reproduce the problem that he was able to do the logging that led him to the solution.

Fourth, it’s important to file bug reports in Bugzilla. Bugzilla is effectively the Mozilla project’s memory, and it’s monitored by many contributors. The visibility of a bug report in Bugzilla is vastly higher than a random complaint on some other website. If the bug report hadn’t been in Bugzilla, Peter wouldn’t have stumbled across it. So even if he had fixed it, DeeDee_Z wouldn’t have known and probably would have had been stuck with the problem until Firefox 34 came out. That’s assuming s/he didn’t switch to a different browser in the meantime.

Fifth, Mozilla does care about memory usage, particularly cases where memory usage balloons unreasonably. We’ve had a project called MemShrink running for more than three years now. We’ve fixed hundreds of problems, big and small, and continue to do so. Please use about:memory to start the diagnosis, and add the “[MemShrink]” tag to any bug reports in Bugzilla that relate to memory usage, and we will triage them in our fortnightly MemShrink meetings.

Finally, luck plays a part. I don’t often look at /r/firefox, and I could have easily missed DeeDee_Z’s complaint. Also, it was lucky that Peter found the bug in Bugzilla. Many tricky bugs don’t get resolved this quickly.

Categories
about:memory DMD Firefox Memory consumption MemShrink

Measuring memory used by third-party code

Firefox’s memory reporting infrastructure, which underlies about:memory, is great. And when it lacks coverage — causing the “heap-unclassified” number to get large — we can use DMD to identify where the unreported allocations are coming from. Using this information, we can extend existing memory reporters or write new ones to cover the missing heap blocks.

But there is one exception: third-party code. Well… some libraries support custom allocators, which is great, because it lets us provide a counting allocator. And if we have a copy of the third-party code within Firefox, we can even use some pre-processor hacks to forcibly provide custom counting allocators for code that doesn’t support them.

But some heap allocations are done by code we have no control over, like OpenGL drivers. For example, after opening a simple WebGL demo on my Linux box, I have over 50% “heap-unclassified”.

208.11 MB (100.0%) -- explicit
├──107.76 MB (51.78%) ── heap-unclassified

DMD’s output makes it clear that the OpenGL drivers are responsible. The following record is indicative.

Unreported: 1 block in stack trace record 2 of 3,597
 15,486,976 bytes (15,482,896 requested / 4,080 slop)
 6.92% of the heap (20.75% cumulative); 10.56% of unreported (31.67% cumulative)
 Allocated at
 replace_malloc (/home/njn/moz/mi8/co64dmd/memory/replace/dmd/../../../../memory/replace/dmd/DMD.cpp:1245) 0x7bf895f1
 _swrast_CreateContext (??:?) 0x3c907f03
 ??? (/usr/lib/x86_64-linux-gnu/dri/i965_dri.so) 0x3cd84fa8
 ??? (/usr/lib/x86_64-linux-gnu/dri/i965_dri.so) 0x3cd9fa2c
 ??? (/usr/lib/x86_64-linux-gnu/dri/i965_dri.so) 0x3cd8b996
 ??? (/usr/lib/x86_64-linux-gnu/dri/i965_dri.so) 0x3ce1f790
 ??? (/usr/lib/x86_64-linux-gnu/dri/i965_dri.so) 0x3ce1f935
 glXGetDriverConfig (??:?) 0x3dce1827
 glXDestroyGLXPixmap (??:?) 0x3dcbc213
 glXCreateNewContext (??:?) 0x3dcbc48a
 mozilla::gl::GLContextGLX::CreateGLContext(mozilla::gfx::SurfaceCaps const&, mozilla::gl::GLContextGLX*, bool, _XDisplay*, unsigned long, __GLXFBConfigRec*, bool, gfxXlibSurface*) (/home/njn/moz/mi8/co64dmd/gfx/gl/../../../gfx/gl/GLContextProviderGLX.cpp:783) 0x753c99f4

The bottom-most frame is for a function (CreateGLContext) within Firefox’s codebase, and then control passes to the OpenGL driver, which eventually does a heap allocation, which ends up in DMD’s replace_malloc function.

The following DMD report is a similar case that shows up on Firefox OS.

Unreported: 1 block in stack trace record 1 of 463
 1,454,080 bytes (1,454,080 requested / 0 slop)
 9.75% of the heap (9.75% cumulative); 21.20% of unreported (21.20% cumulative)
 Allocated at
 replace_calloc /Volumes/firefoxos/B2G/gecko/memory/replace/dmd/DMD.cpp:1264 (0xb6f90744 libdmd.so+0x5744)
 os_calloc (0xb25aba16 libgsl.so+0xda16) (no addr2line)
 rb_alloc_primitive_lists (0xb1646ebc libGLESv2_adreno.so+0x74ebc) (no addr2line)
 rb_context_create (0xb16446c6 libGLESv2_adreno.so+0x726c6) (no addr2line)
 gl2_context_create (0xb16216f6 libGLESv2_adreno.so+0x4f6f6) (no addr2line)
 eglCreateClientApiContext (0xb25d3048 libEGL_adreno.so+0x1a048) (no addr2line)
 qeglDrvAPI_eglCreateContext (0xb25c931c libEGL_adreno.so+0x1031c) (no addr2line)
 eglCreateContext (0xb25bfb58 libEGL_adreno.so+0x6b58) (no addr2line)
 eglCreateContext /Volumes/firefoxos/B2G/frameworks/native/opengl/libs/EGL/eglApi.cpp:527 (0xb423dda2 libEGL.so+0xeda2)
 mozilla::gl::GLLibraryEGL::fCreateContext(void*, void*, void*, int const*) /Volumes/firefoxos/B2G/gecko/gfx/gl/GLLibraryEGL.h:180 (discriminator 3) (0xb4e88f4c libxul.so+0x789f4c)

We can’t traverse these allocations in the usual manner to measure them, because we have no idea about the layout of the relevant data structures. And we can’t provide a custom counting allocator to code outside of Firefox’s codebase.

However, although we pass control to the driver, control eventually comes back to the heap allocator, and that is something that we do have some power to change. So I had an idea to toggle some kind of mode that records all the allocations that occur within a section of code, as the following code snippet demonstrates.

SetHeapBlockTagForThread("webgl-create-new-context");
context = glx.xCreateNewContext(display, cfg, LOCAL_GLX_RGBA_TYPE, glxContext, True);
ClearHeapBlockTagForThread();

The calls on either side of glx.xCreateNewContext tell the allocator that it should tag all allocations done within that call. And later on, the relevant memory reporter can ask the allocator how many of these allocations remain and how big they are. I’ve implemented a draft version of this, and it basically works, as the following about:memory output shows.

216.97 MB (100.0%) -- explicit
├───78.50 MB (36.18%) ── webgl-contexts
├───32.37 MB (14.92%) ── heap-unclassified

The implementation is fairly simple.

  • There’s a global hash table which records which live heap blocks have a tag associated with them. (Most heap blocks don’t have a tag, so this table stays small.)
  • When SetHeapBlockTagForThread is called, the given tag is stored in thread-local storage. When ClearHeapBlockTagForThread is called, the tag is cleared.
  • When an allocation happens, we (quickly) check if there’s a tag set for the current thread and if so, put a (pointer,tag) pair into the table. Otherwise, we do nothing extra.
  • When a deallocation happens, we check if the deallocated block is in the table, and remove it if so.
  • To find all the live heap blocks with a particular tag, we simply iterate over the table looking for tag matches. This can be used by a memory reporter.

Unfortunately, the implementation isn’t suitable for landing in Firefox’s code, for several reasons.

  • It uses Mike Hommey’s replace_malloc infrastructure to wrap the default allocator (jemalloc). This works well — DMD does the same thing — but using it requires doing a special build and then setting some environment variables at start-up. This is ok for an occasional-use tool that’s only used by Firefox developers, but it’s important that about:memory works in vanilla builds without any additional effort.
  • Alternatively, I could modify jemalloc directly, but we’re hoping to one day move away from our old, heavily-modified version of jemalloc and start using an unmodified jemalloc3.
  • It may have a non-trivial performance hit. Although I haven’t measured performance yet — the above points are a bigger show-stopper at the moment — I’m worried about having to do a hash table lookup on every deallocation. Alternative implementations (store a marker in each block, or store tagged blocks in their own zone) are possible but present their own difficulties.
  • It can miss some allocations. When adding a tag for a particular section of code, you don’t want to mark every allocation that occurs while that section executes, because there could be multiple threads running and you don’t want to mark allocations from other threads. So it restricts the marking to a single thread, but if the section creates a new thread itself, any allocations done on that new thread will be missed. This might sound unlikely, but my implementation appears to miss some allocations and this is my best theory as to why.

This issue of OpenGL drivers and other kinds of third-party code has been a long-term shortcoming with about:memory. For the first time I have a partial solution, though it still has major problems. I’d love to hear if anyone has additional ideas on how to make it better.

Categories
B2G Fennec Firefox Garbage Collection Memory consumption MemShrink pdf.js

MemShrink’s 3rd birthday

June 14, 2014 was the third anniversary of the first MemShrink meeting. MemShrink is a mature effort at this point, and many of the problems that motivated its creation have been fixed. Nonetheless, there are still some areas for improvement. So, as I did at this time last year, I’ll take the opportunity to update the “big ticket items” list.

The Old Big Ticket Items List

#5: pdf.js

pdf.js is the PDF viewer that now ships by default in Firefox. I greatly reduced its memory usage in two rounds, first in February, and again in June. The first round of improvements were released in Firefox 29, and the second round is due to be released in Firefox 33, which should be out in mid-October.

pdf.js will still use more memory than native PDF viewers, but the situation has improved enough that it can be removed from this list.

#4: Dev tools

See below.

#3: B2G Nuwa

Cervantes Yu, Thinker Li, and others succeeded in landing Nuwa, an impressive technical achievement that increased the amount of memory sharing between different processes on Firefox OS. This allows many more apps to run at once. I think this is present in Firefox OS 1.3 and later.

#2: Compacting Generational GC

See below.

#1: Better Foreground Tab Image Handling

Timothy Nikkel completely fixed the massive spikes in decoded image data that we used to get on image-heavy pages. This was a fantastic improvement that shipped in Firefox 26.

The New Big Ticket Items List

In a break from tradition, I will present the items in alphabetical order, rather than ranking them. This reflects the fact that I don’t have a clear opinion on the relevant importance of these different items. (I view this as a good thing, because it means that I feel there aren’t any hair-on-fire problems.)

Better regression detection

areweslimyet.com (a.k.a. AWSY) is our best tool for detecting memory usage regressions. It currently tracks Firefox and Firefox for Android, and there are plans to integrate Firefox OS.

Unfortunately, although AWSY has been successful at detecting large regressions, leading to them being fixed, its measurements are noisy enough that detecting smaller regressions is difficult. As a result, the general trend of the graphs has been upward. I do not think this is as bad as it looks at first glance, because Firefox’s behaviour in the worst cases — which matter more than the average case — is much better than it used to be. Nonetheless, improved sensitivity here would be an excellent thing, and Eric Rahm is actively working on this.

Developer tools

Developer-oriented memory profiling tools are under active development by Nick Fitzgerald, Jim Blandy, and others. A lot of the necessary profiling infrastructure is in place, and this seems to be progressing well, though I don’t know when it’s expected to be finished.

By the way, if you haven’t tried Firefox’s dev tools recently, you should! They have improved an incredible amount in the past year or so.

GC Arena Fragmentation

Generational GC landed a few months ago. I had been hoping that this would help reduce GC fragmentation, but the effect was small. It looks like compacting GC is what’s needed to make a big difference here, though some smaller tweaks may help things a little.

Tarako

Tarako is the codename for the “$25 phone” running Firefox OS that will ship in India and other countries later this year. It has a paltry 128 MiB of RAM, so memory usage is critical. Since the hardware first became available to Mozilla employees at the start of the year, Tarako has improved from “almost unusable” to “not bad”. But apps still close due to OOMs fairly frequently, especially when a user does something that involves two apps working together in some way.

There is no single change that will decisively fix this problem for Tarako;  further improvements will require an ongoing grind of work from many engineers. Improvements made for Tarako are also likely to benefit higher-end Firefox OS devices as well.

Windows OOM crashes

The number of out-of-memory (OOM) crashes that occur on Windows is relatively high. A sizeable fraction of these appear to be 32-bit virtual OOM crashes, caused by running out of address space.

Things that will mitigate this include modifications to jemalloc and the JS allocator, as well as Electrolysis. And some additional data and analysis may help us understand the problem better.

The ultimate solution, for users on 64-bit versions of Windows, is 64-bit Firefox builds for Windows, though it’ll be a while before those builds are in good enough shape to ship to regular users.

Summary

Three items from the old list (pdf.js, Nuwa, image handling) have been ticked off.  Two items remain (devtools, GC fragmentation), the latter in altered form, and both are a lot closer to completion than they were. Three new items (regression detection, Tarako, and Windows OOMs) have been added.

Let me know if I’ve omitted anything important!

Categories
Memory consumption MemShrink pdf.js

An even slimmer pdf.js

TL;DR: Firefox’s built-in PDF viewer is on track to benefit from additional large reductions in memory consumption when Firefox 33 is released in mid-October.

Earlier this year I made some major improvements to the memory usage and speed of pdf.js, Firefox’s built-in PDF viewer. At the time I was quite pleased with myself. I had picked all the low-hanging fruit and reached a point of diminishing returns.

Some unexpected measurements

Shortly after that, while on a plane I tried pdf.js on my Mac laptop. I was horrified to find that memory usage was much higher than on the Linux desktop machine on which I had done my optimizations. The first document I measured made Firefox’s RSS (resident set size, a.k.a. physical memory usage) peak at over 1,000 MiB. The corresponding number on my Linux desktop had been 400 MiB! What was going on?

The short answer is “canvases”. pdf.js uses HTML canvas elements to render each PDF page. These can be millions of pixels in size, and each canvas pixel takes 32-bits of RGBA data. But on Linux this data is not stored within the Firefox process. Instead, it gets passed to the X server. Firefox’s about:memory page does report the canvas usage under the “canvas-2d-pixels” and “gfx-surface-xlib” labels, but I hadn’t seen those — during my optimization work I had only measured the RSS of the Firefox process. RSS is usually the best single number to focus on, but in this case it was highly misleading.

In contrast, on Mac the canvas data is stored within the process, which is why Firefox’s RSS is so much higher on Mac. (There’s also the fact that my MacBook has a retina screen, which means the canvases used have approximately four times as many pixels as the canvases used on my Linux machine.)

Fixing the problem

It turns out that pdf.js was intentionally caching an overly generous number of canvases (20) and then unintentionally failing to dispose of them in a timely manner. This could result in hundreds of canvases being held onto unnecessarily if you scrolled quickly through a large document. On my MacBook each canvas is over 20 MiB, so the resultant memory spike could be enormous.

Happily, I was able to fix this behaviour with four tiny patches. pdf.js now caches only 10 canvases, and disposes of any excess ones immediately.

Measurements

I measured the effects of both rounds of optimization on the following three documents on my Mac.

  • TraceMonkey: This is an academic paper about the TraceMonkey JIT compiler. It’s a 14 page Latex document containing several pictures and graphs.
  • Telefónica: This is the 2009 annual report from Telefónica. It’s a 122 page full-colour document with many graphs, tables and pictures.
  • Decontamination: This is an old report about the decontamination of an industrial site in New Jersey. It’s a 226 page scan of a paper document that mostly consists of black and white typewritten text and crude graphs, with only few pages featuring colour.

For each document, I measure the peak RSS while scrolling quickly from the first page to the last by holding down the “fn” and down keys at the same time.  Although this is a stress test, it’s not unrealistic; it’s easy to imagine people quickly scrolling through 10s or even 100s of pages of a PDF to find a particular page.

I did this three times for each document and picked the highest value. The results are shown by the following graph. The “Fx28” bars show the original peak RSS values; the “Fx29” bars show the peak RSS values after my first round of optimizations; and the “Fx33” bars show the peak RSS values after my second round of optimizations.

pdfjs

Comparing Firefox 28 and Firefox 33, the reductions in peak RSS for the three documents are 1.2x, 4.4x, and 7.8x. It makes sense that the relative improvements increase with the length of the documents.

Despite these major improvements, pdf.js still uses substantially more memory than native PDF viewers. So we need to keep chipping away… but it’s also worth recognizing how far we’ve come.

Status

These patches have landed in the master pdf.js repository. They have not yet imported into Firefox’s code, but this will happen at some point during the development cycle for Firefox 33. Firefox 33 is on track to be released in mid-October.

Categories
about:memory Memory consumption MemShrink

areweslimyet.com data is now exportable and diffable

areweslimyet.com (a.k.a. AWSY) tracks Firefox’s memory usage on a basic workload that opens lots of websites. It’s not a perfect tool — you shouldn’t consider its measurements as a reliable proxy for Firefox’s memory usage in general — but it does help detect regressions.

One thing it doesn’t support is doing diffs between separate runs. Until now, that is! Thanks to work done by Eric Rahm, it’s now possible to download the data for each snapshot done during a run. This file can then be loaded in about:memory. It’s also possible to download the data for two snapshots and diff them in about:memory. Yay! This diff workflow isn’t super slick, as it requires the downloading of two files and then the loading of them in about:memory. But it’s a lot better than manually eyeballing two sets of data in two separate AWSY tabs, which was the best we could do previously. Furthermore, AWSY and about:memory already duplicate some functionality, and this implementation avoids increasing the amount of duplication.

To do the export, select a single run (zooming in on the graph appropriately) and click on the red “[export]” link next to the appropriate snapshot, as seen in the following screenshot.

Screenshot of AWSY showing the export links

Once it has finished generating the data, the “[export]” link changes to “[download]”, and you can click on it again to do the download.

This is a first step towards improving AWSY so that it can detect memory usage regressions with much higher sensitivity than it currently has.

Categories
Firefox Garbage Collection Memory consumption MemShrink

Generational GC has landed

Big news: late last week, generational garbage collection landed. It was backed out at first due to some test failures, but then re-landed and appears to have stuck.

This helps with performance. There are certain workloads where generational GC makes the code run much faster, and Firefox hasn’t been able to keep up with Chrome on these. For example, it has made Firefox slightly faster on the Octane benchmark, and there is apparently quite a bit of headroom for additional improvements.

Interestingly, its effect on memory usage has been small. I was hoping that the early filtering of many short-lived objects would make the tenured heap grow more slowly and thus reduce memory usage, but the addition of other structures (such as the nursery and store buffers) appears to have balanced that out.

The changes to the graphs at AWSY have been all within the noise, with the exception of the “Fresh start” and “Fresh start [+30s]” measurements in the “explicit” graph, both of which ticked up slightly. This isn’t cause for concern, however, because the corresponding “resident” graph hasn’t increased accordingly, and “resident” is the real metric of interest.

“Compacting Generational GC” is the #1 item on the current MemShrink “Big Ticket Items” list. Hopefully the “compacting” part of that, which still remains to be done, will produce some sizeable memory wins.

Categories
about:memory B2G Memory consumption MemShrink

Nuwa has landed

A big milestone for Firefox OS was reached this week: after several bounces spread over several weeks, Nuwa finally landed and stuck.

Nuwa is a special Firefox OS process from which all other app processes are forked. (The name “Nuwa” comes from the Chinese creation goddess.) It allows lots of unchanging data (such as low-level Gecko things like XPCOM structures) to be shared among app processes, thanks to Linux’s copy-on-write forking semantics. This greatly increases the number of app processes that can be run concurrently, which is why it was the #3 item on the MemShrink “big ticket items” list.

One downside of this increased sharing is that it renders about:memory’s measurements less accurate than before, because about:memory does not know about the sharing, and so will over-report shared memory. Unfortunately, this is very difficult to fix, because about:memory’s reports are generated entirely within Firefox, whereas the sharing information is only available at the OS level. Something to be aware of.

Thanks to Cervantes Yu (Nuwa’s primary author), along with those who helped, including Thinker Li, Fabrice Desré, and Kyle Huey.

Categories
Google Chrome Memory consumption MemShrink pdf.js

A slimmer and faster pdf.js

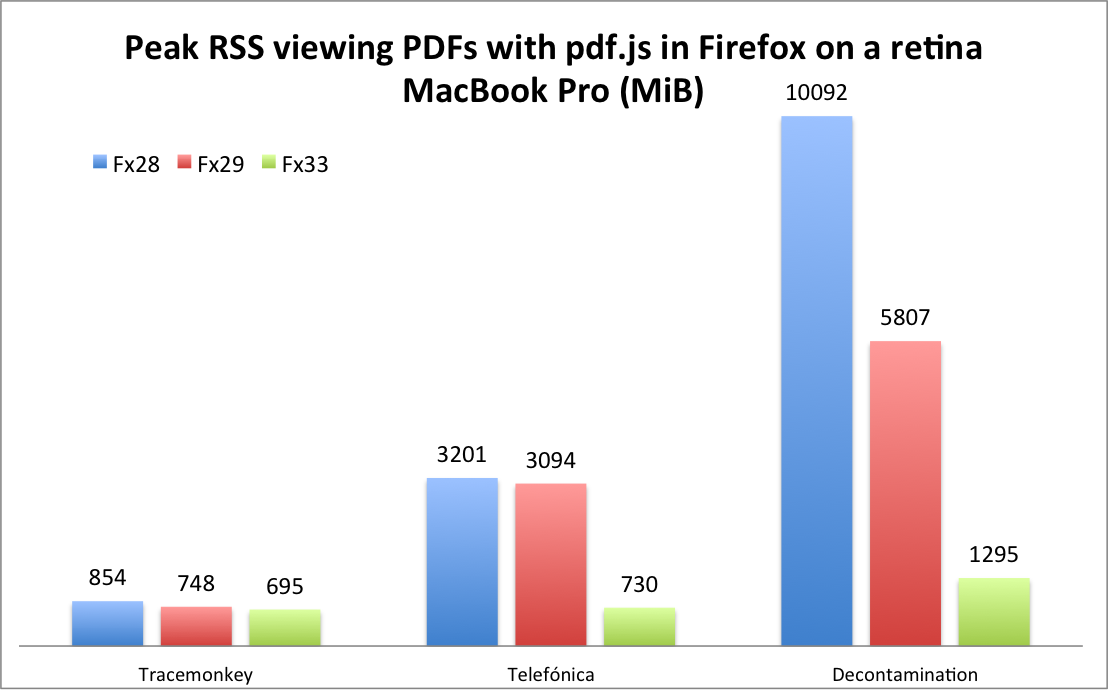
TL;DR: Firefox’s built-in PDF viewer is on track to gain some drastic improvements in memory consumption and speed when Firefox 29 is released in late April.

Firefox 19 introduced a built-in PDF viewer which allows PDF files to be viewed directly within Firefox. This is made possible by the pdf.js project, which implements a PDF viewer entirely in HTML and JavaScript.

This is a wonderful feature that makes the reading of PDFs on websites much less disruptive. However, pdf.js unfortunately suffers at times from high memory consumption. Enough, in fact, that it is currently the #5 item on the MemShrink project’s “big ticket items” list.

Recently, I made four improvements to pdf.js, each of which reduces its memory consumption greatly on certain kinds of PDF documents.

Image masks

The first improvement involved documents that use image masks, which are bitmaps that augment an image and dictate which pixels of the image should be drawn. Previously, the 1-bit-per-pixel (a.k.a 1bpp) image mask data was being expanded into 32bpp RGBA form (a typed array) in a web worker, such that every RGB element was 0 and the A element was either 0 or 255. This typed array was then passed to the main thread, which copied the data into an ImageData object and then put that data to a canvas.

The change was simple: instead of expanding the bitmap in the worker, just transfer it as-is to the main thread, and expand its contents directly into the ImageData object. This removes the RGBA typed array entirely.

I tested two documents on my Linux desktop, using a 64-bit trunk build of Firefox. Initially, when loading and then scrolling through the documents, physical memory consumption peaked at about 650 MiB for one document and about 800 MiB for the other. (The measurements varied somewhat from run to run, but were typically within 10 or 20 MiB of those numbers.) After making the improvement, the peak for both documents was about 400 MiB.

Image copies

The second improvement involved documents that use images. This includes scanned documents, which consist purely of one image per page.

Previously, we would make five copies of the 32bpp RGBA data for every image.

  1. The web worker would decode the image’s colour data (which can be in several different colour forms: RGB, grayscale, CMYK, etc.) from the PDF file into a 24bpp RGB typed array, and the opacity (a.k.a. alpha) data into an 8bpp A array.
  2. The web worker then combined the the RGB and A arrays into a new 32bpp RGBA typed array. The web worker then transferred this copy to the main thread. (This was a true transfer, not a copy, which is possible because it’s a typed array.)
  3. The main thread then created an ImageData object of the same dimensions as the typed array, and copied the typed array’s contents into it.
  4. The main thread then called putImageData() on the ImageData object. The C++ code within Gecko that implements putImageData() then created a new gfxImageSurface object and copied the data into it.
  5. Finally, the C++ code also created a Cairo surface from the gfxImageSurface.

Copies 4 and 5 were in C++ code and are both very short-lived. Copies 1, 2 and 3 were in JavaScript code and so lived for longer; at least until the next garbage collection occurred.

The change was in two parts. The first part involved putting the image data to the canvas in tiny strips, rather than doing the whole image at once. This was a fairly simple change, and it allowed copies 3, 4 and 5 to be reduced to a tiny fraction of their former size (typically 100x or more smaller). Fortunately, this caused no slow-down.

The second part involved decoding the colour and opacity data directly into a 32bpp RGBA array in simple cases (e.g. when no resizing is involved), skipping the creation of the intermediate RGB and A arrays. This was fiddly, but not too difficult.

If you scan a US letter document at 300 dpi, you get about 8.4 million pixels, which is about 1 MiB of data. (A4 paper is slightly larger.) If you expand this 1bpp data to 32bpp, you get about 32 MiB per page. So if you reduce five copies of this data to one, you avoid about 128 MiB of allocations per page.

Black and white scanned documents

The third improvement also involved images. Avoiding unnecessary RGBA copies seemed like a big win, but when I scrolled through large scanned documents the memory consumption still grew quickly as I scrolled through more pages. I eventually realized that although four of those five copies had been short-lived, one of them was very long-lived. More specifically, once you scroll past a page, its RGBA data is held onto until all pages that are subsequently scrolled past have been decoded. (The memory is eventually freed; it just takes longer than we’d like.) And fixing it is not easy, because it involves page-prioritization code isn’t easy to change without hurting other aspects of pdf.js’s performance.

However, I was able to optimize the common case of simple (e.g. unmasked, with no resizing) black and white images. Instead of expanding the 1bpp image data to 32bpp RGBA form in the web worker and passing that to the main thread, the code now just passes the 1bpp form directly. (Yep, that’s the same optimization that I used for the image masks.) The main thread can now handle both forms, and for the 1bpp form the expansion to the 32bpp form also only happens in tiny strips.

I used a 226 page scanned document to test this. At about 34 MiB per page, that’s over 7,200 MiB of pixel data when expanded to 32bpp RGBA form. And sure enough, prior to my change, scrolling quickly through the whole document caused Firefox’s physical memory consumption to reach about 7,800 MiB. With the fix applied, this number reduced to about 700 MiB. Furthermore, the time taken to render the final page dropped from about 200 seconds to about 25 seconds. Big wins!

The same optimization could be done for some non-black and white images (though the improvement will be smaller). But all the examples from bug reports were black and white, so that’s all I’ve done for now.

Parsing

The fourth and final improvement was unrelated to images. It involved the parsing of the PDF files. The parsing code reads files one byte at a time, and constructs lots of JavaScript strings by appending one character at a time. SpiderMonkey’s string implementation has an optimization that handles this kind of string construction efficiently, but the optimization doesn’t kick in until the strings have reached a certain length; on 64-bit platforms, this length is 24 characters. Unfortunately, many of the strings constructed during PDF parsing are shorter than this, so in order a string of length 20, for example, we would also create strings of length 1, 2, 3, …, 19.

It’s possible to change the threshold at which the optimization applies, but this would hurt the performance of some other workloads. The easier thing to do was to modify pdf.js itself. My change was to build up strings by appending single-char strings to an array, and then using Array.join to concatenate them together once the token’s end is reached. This works because JavaScript arrays are mutable (unlike strings which are immutable) and Array.join is efficient because it knows exactly how long the final string will be.

On a 4,155 page PDF, this change reduced the peak memory consumption during file loading from about 1130 MiB to about 800 MiB.

Profiling

The fact that I was able to make a number of large improvements in a short time indicates that pdf.js’s memory consumption has not previously been closely looked at. I think the main reason for this is that Firefox currently doesn’t have much in the way of tools for profiling the memory consumption of JavaScript code (though the devtools team is working right now to rectify this). So I will explain the tricks I used to find the places that needed optimization.

Choosing test cases

First I had to choose some test cases. Fortunately, this was easy, because we had numerous bug reports about high memory consumption which included test files. So I just used them.

Debugging print statements, part 1

For each test case, I looked first at about:memory. There were some very large “objects/malloc-heap/elements/non-asm.js” entries, which indicate that lots of memory is being used by JavaScript array elements. And looking at pdf.js code, typed arrays are used heavily, especially Uint8Array. The question is then: which typed arrays are taking up space?

To answer this question, I introduced the following new function.

function newUint8Array(length, context) {
  dump("newUint8Array(" + context + "): " + length + "\n");
  return new Uint8Array(length);
}

I then replaced every instance like this:

var a = new Uint8Array(n);

with something like this:

var a = newUint8Array(n, 1);

I used a different second argument for each instance. With this in place, when the code ran, I got a line printed for every allocation, identifying its length and location. With a small amount of post-processing, it was easy to identify which parts of the code were allocating large typed arrays. (This technique provides cumulative allocation measurements, not live data measurements, because it doesn’t know when these arrays are freed. Nonetheless, it was good enough.) I used this data in the first three optimizations.

Debugging print statements, part 2

Another trick involved modifying jemalloc, the heap allocator that Firefox uses. I instrumented jemalloc’s huge_malloc() function, which is responsible for allocations greater than 1 MiB. I printed the sizes of allocations, and at one point I also used gdb to break on every call to huge_malloc(). It was by doing this that I was able to work out that we were making five copies of the RGBA pixel data for each image. In particular, I wouldn’t have known about the C++ copies of that data if I hadn’t done this.

Notable strings

Finally, while looking again at about:memory, I saw some entries like the following, which are found by the “notable strings” detection.

> │    │  │  │  │  │  ├────0.38 MB (00.03%) ── string(length=10, copies=6174, "http://sta")/gc-heap
> │    │  │  │  │  │  ├────0.38 MB (00.03%) ── string(length=11, copies=6174, "http://stac")/gc-heap
> │    │  │  │  │  │  ├────0.38 MB (00.03%) ── string(length=12, copies=6174, "http://stack")/gc-heap
> │    │  │  │  │  │  ├────0.38 MB (00.03%) ── string(length=13, copies=6174, "http://stacks")/gc-heap
> │    │  │  │  │  │  ├────0.38 MB (00.03%) ── string(length=14, copies=6174, "http://stacks.")/gc-heap
> │    │  │  │  │  │  ├────0.38 MB (00.03%) ── string(length=15, copies=6174, "http://stacks.m")/gc-heap
> │    │  │  │  │  │  ├────0.38 MB (00.03%) ── string(length=16, copies=6174, "http://stacks.ma")/gc-heap
> │    │  │  │  │  │  ├────0.38 MB (00.03%) ── string(length=17, copies=6174, "http://stacks.mat")/gc-heap
> │    │  │  │  │  │  ├────0.38 MB (00.03%) ── string(length=18, copies=6174, "http://stacks.math")/gc-heap

It doesn’t take much imagination to realize that strings were being built up one character at a time. This looked like the kind of thing that would happen during tokenization, and I found a file called parser.js and looked there. And I knew about SpiderMonkey’s optimization of string concatenation and asked on IRC about why it might not be happening, and Shu-yu Guo was able to tell me about the threshold. Once I knew that, switching to use Array.join wasn’t difficult.

What about Chrome’s heap profiler?

I’ve heard good things in the past about Chrome/Chromium’s heap profiling tools. And because pdf.js is just HTML and JavaScript, you can run it in other modern browsers. So I tried using Chromium’s tools, but the results were very disappointing.

Remember the 226 page scanned document I mentioned earlier, where over 7,200 MiB of pixel data was created? I loaded that document into Chromium and used the “Take Heap Snapshot” tool, which gave the following snapshot.

Heap Snapshot from Chromium

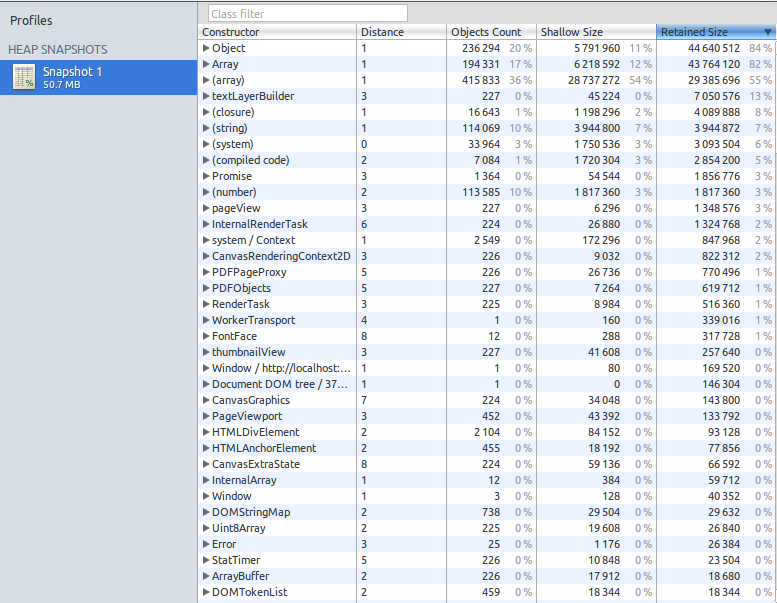
At the top left, it claims that the heap was just over 50 MiB in size. Near the bottom, it claims that 225 Uint8Array objects had a “shallow” size of 19,608 bytes, and a “retained” size of 26,840 bytes. This seemed bizarre, so I double-checked. Sure enough, the operating system (via top) reported that the relevant chromium-browser process was using over 8 GiB of physical memory at this point.

So why the tiny measurements? I suspect what’s happening is that typed arrays are represented by a small header struct which is allocated on the GC heap, and it points to the (much larger) element data which is allocated on the malloc heap. So if the snapshot is just measuring the GC heap, in this case it’s accurate but not useful. (I’d love to hear if anyone can confirm or refute this hypothesis.) I also tried the “Record Heap Allocations” tool but it gave much the same results.

Status

These optimizations have landed in the master pdf.js repository, and were imported into Firefox 29, which is currently on the Aurora branch, and is on track to be released on April 29.

The optimizations are also on track to be imported into the Firefox OS 1.3 and 1.3T branches. I had hoped to show that some PDFs that were previously unloadable on Firefox OS would now be loadable. Unfortunately, I am unable to load even the simplest PDFs on my Buri (a.k.a. Alcatel OneTouch), because the PDF viewer app appears to consistently run out of gralloc memory just before the first page is displayed. Ben Kelly suggested that Async pan zoom (APZ) might be responsible, but disabling it didn’t help. If anybody knows more about this please contact me.

Finally, I’ve fixed most of the major memory consumption problems with the PDFs that I’m aware of. If you know of other PDFs that still cause pdf.js to consume large amounts of memory, please let me know. Thanks.

Categories
Garbage Collection MemShrink

A big step towards generational and compacting GC

People frequently ask me for status updates on generational GC, and I usually say I’ll tell them when something notable happens. Well, something notable just happened: exact rooting landed.

What is exact rooting? In order to support generational and/or compacting GC, you need to be able to move GC-allocated things such as objects around. This means you can’t have raw C++ pointers to any objects that might move; instead, you need some kind of indirect pointer that can be updated when necessary.

Unfortunately, both the JS engine and Gecko have a lot of pointers to GC-allocated things. The process of checking and converting them has been the main part of a task called “exact rooting”, and that’s what just finished. This has required an enormous amount of what is essentially very tedious work. Jim Blandy summarized it nicely, as follows.

I’ve never heard of a major project escaping from conservative GC once it had entered that state of sin; nor have I heard of anyone implementing a moving collector after starting with a non-moving collector. So, doing *both* is impressive. I hope it pays off big!

Major kudos to Terrence Cole, Steve Fink, Jon Coppeard, Brian Hackett, and the small army of other helpers who did this. Now that they’ve finished eating this gigantic serving of vegetables, they can move onto dessert, i.e. making the GC generational and compacting.