Categories
MemShrink Uncategorized

Testing the top 100 add-ons for memory leaks

Yesterday I mentioned that the plan for testing the top 100 add-ons for memory leaks had hit a snag — our list is that of the top 100 installed add-ons, rather than the top 100 enabled add-ons, and the latter is what we really want.

However, after some thought, I’ve concluded that there is likely to be a lot of overlap between the two lists.  For example, I’d be surprised if any of the top 50 enabled add-ons are not in the top 100 installed add-ons list.  Furthermore, this kind of testing will never give perfect coverage anyway.

Therefore, there’s little point in delaying the testing while we wait for a better top 100 list.  If you are interested in helping, please jump in.  And if you contact me privately I’ll be able to suggest some add-ons that are towards the more popular end of the top 100 list.  Thanks, and apologies for any confusion I have caused!

Categories
about:memory add-ons Firefox Memory consumption MemShrink

MemShrink progress, week 38

After last week’s action, this week was quieter for MemShrink.

Add-ons

I mentioned last week the plan to test the top 100 add-ons for memory leaks.  Unfortunately we learned this week that the list I gathered is the top 100 installed add-ons, not the top 100 enabled add-ons.  It’s quite possible that a lot of installed “third-party” add-ons (those installed by a program outside of Firefox, such as anti-virus programs) are disabled, in which case this top 100 list won’t reflect actual usage.

As a result, the top 100 testing is on hold until we can resolve this issue.  Telemetry data may help, though that data might exhibit opt-in biases.  I’m also going to investigate the possibility of changing the daily ping to distinguish between enabled and disabled add-ons, which would give us fully representative data.

Landed patches

I merged the “dom+style” and “layout” trees in about:memory.  This is a step towards per-tab memory reporting.  It also probably breaks about:nosy 🙁

I also converted the DOM memory reporters to the new style, added measurement of URIs and links, and added measurement of the FramePropertyTable.  These changes reduced about:memory’s “heap-unclassified” by several MBs in common cases.

Bill McCloskey changed the GC marker stack so it shrinks periodically.  Previously it could grow from 256KB to over 2MB and would never be shrunk once that happened.

Bug counts

This week’s bug counts:

  • P1: 29 (-0/+1)
  • P2: 131 (-4/+6)
  • P3: 87 (-3/+7)
  • Unprioritized: 1 (-2/+1)
Categories
Data structures

N-ary trees in C

If you want to implement an N-ary tree of integers in C, the obvious way to represent each node is something like the following.

struct t {
    int n;
    int numKids;
    struct t **kids;
}

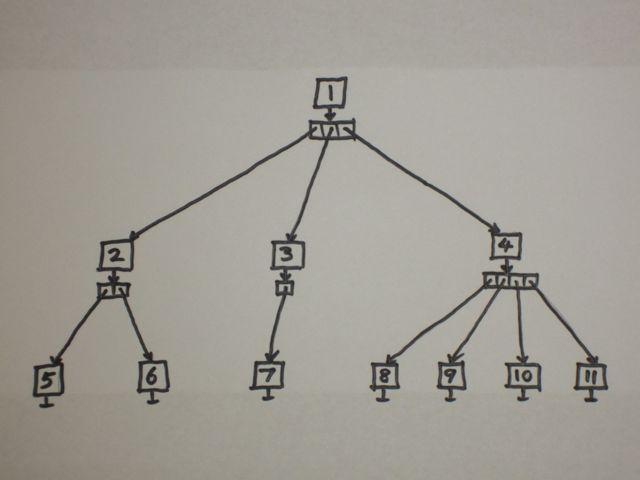
Here kids is an array of kid pointers.  Here’s an example tree.

N-ary tree with kids array

This representation is a bit annoying because the kids array must be allocated separately from the node, and you need to reallocate the kids array every time you add a new kid to a node. Alternatively, you could instead over-allocate in anticipation of more nodes being added, but then you have to record the array capacity within the node.  (The latter representation is exactly what I used for the tree of stack traces in Massif.)

While reading through the code for trace-malloc yesterday, I learnt a better representation.

struct t {
    int n;
    struct t *kids;
    struct t *siblings;
}

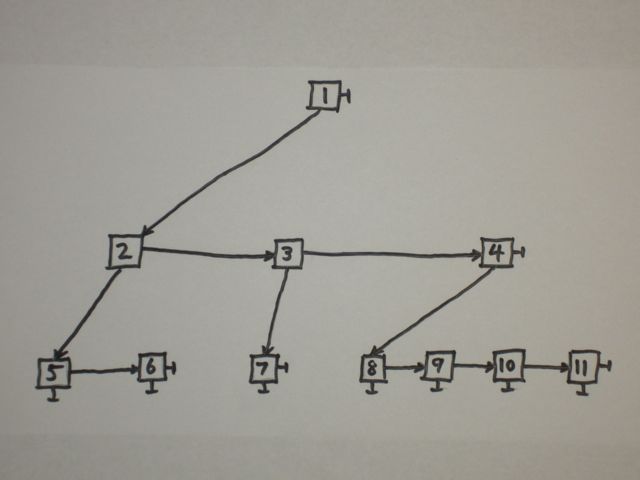
This looks odd at first.  Here’s the example tree with this new representation.

N-ary tree with sibling pointers

From any single node you can only directly access its first kid, through the kids pointer. You access the second kid through kids->siblings, the third kid through kids->siblings->siblings, and so on.  In other words, instead of storing a node’s kids in an array, you store them in a list; it just so happens that this list can be embedded elegantly in the nodes themselves. (There’s an argument to be made that the fields should be called firstKid and nextSibling, though I can see the sense in both naming schemes.)

There are several nice things about this representation.

  • Each node is a fixed size;  no auxiliary arrays are needed.
  • Many algorithms can be expressed more easily because it’s just a binary tree.
  • You can treat each sibling list as a move-to-front list.  In the example above, if you accessed node 11 you would move nodes 4 and 11 to the front of their sibling lists. This may make subsequent accesses faster if you have locality in your access patterns. (You could also do this with the first representation, but you’d have to shuffle some of the pointers in the kids array along by one.)

It appears this is a moderately well-known representation — this question on Stack Overflow has two answers, one for each of the representations I described.  But I didn’t know about it, so I thought I’d share it.

Categories
about:memory add-ons Firefox Garbage Collection Memory consumption MemShrink

MemShrink progress, week 37

It’s been a huge week for MemShrink.

Add-ons

I filed a bug on testing the top 100 add-ons for memory leaks.  The majority of these add-ons are not available on AMO and so are not subject to the leak checking done during AMO reviews.  The instructions and current test results are here.  Randell Jesup helped identify some some add-ons with unclear identities, and Nils Maier and Archaeopteryx have both tested several add-ons.  A month ago I said that add-ons that leak are the #1 problem for MemShrink, and this bug represents a huge step towards reducing that problem.  We’ll need lots of additional help to test this many add-ons, so please feel free to jump in!

As far as I know, comprehensive testing of the most popular add-ons has never been done before.  Although this testing is aimed at finding memory leaks, it’s quite possible it will uncover various other problems with add-ons.  Indeed, it’s clear just from looking at the list that quite a few of the non-AMO add-ons are of dubious merit, and this has stimulated some interesting discussion on dev-platform about third-party add-ons, i.e. those that are installed into Firefox by an external program.

The following add-ons had leaks fixed or mostly fixed by their authors: McAfee Site Advisor, Ghostery, Spool, Screengrab (fix version), Roboform, UF Comment Board ToolsGeenstijl, Long URL Please, HTML Desktop Notifications.

Nils Maier greatly improved the documentation on common causes of memory leaks in add-ons.  This was a MemShrink:P1 bug.  That doesn’t mean the document can’t be improved further, however;  it’s a wiki so please continue to add to it if you can.

Regression testing

John Schoenick’s excellent areweslimyet.com is getting close to being ready for a public unveiling.  The site is currently live but password-protected, simply to prevent large numbers of people accessing it before it’s ready.  (If you want a sneak peek, contact me for the password.)  More importantly, it identified a large regression in memory consumption caused by the landing of the JS engine’s incremental garbage collector on February 19, which Bill McCloskey is investigating.

Tim Taubert improved Firefox’s regression testing to ensure that no new DocShell and DOMWindow leaks are introduced.  This was a MemShrink:P1 bug because these leaks are quite easy to introduce.  Tim wrote some more about this change here.

Cycle collector

Jan Honza Odvarko’s about:ccdump add-on made it onto AMO this week.  Jan has been using this to hunt down some tricky leaks in Firebug.

Marco Bonardo fixed a leak in PlacesUtils.removeLazyBookmarkObserver() that I won’t pretend to understand, but which was a MemShrink:P1.  Marco also fixed a leak that occurred after bookmarking a page, closing the window, and opening a new window.

Olli Pettay fixed an equally impenetrable (to me) leak involving nsFormFillController::mFocusedInput.

Kyle Huey fixed a leak in the About Firefox dialog.

Andrew McCreight added additional information to cycle collector’s error console logging, which helps with identifying and debugging cycle collector problems.

Miscellaneous

Jason Duell fixed an obscure leak involve web sockets.

Bill McCloskey fixed a minor JS engine leak.

I added a new memory reporter called “js/runtime/gc-marker”.  It starts out at 256KB and I saw it reach 2.8MB when running MemBench.  I also converted the existing source image reporters to the new style, which seems to haved fixed some bogus results in about:memory as a side-effect.

Quote of the week

Adam Overa of Tom’s Hardware did another browser Grand Prix.  Devin Coldewey used the results from the Grand Prix to conclude that Firefox and Chrome are both great, and which you prefer basically comes down to a matter of taste.  While that is an interesting conclusion, what caught my eye was this comment, by Balaji Viswanathan:

I guess the title could have been “All browsers suck equally bad now”. Firefox and Chrome have grown to become more resources hogs – closer to IE. These days I shudder to fire up the firefox as the memory leaks are terrible. Two hours of Firefox with a Facebook tab is enough to gobble up 25% of my memory. With Chrome, I would have 20 rendering processes showing up when I would have just 3 tabs open.

In the first 2 years of Chrome I had probably 2 or 3 crashes. These days, it crashes every week or so. I long for the 2006 era Firefox – clean, simple and lean. Its been a long time since I have used IE actively and with Safari lesser said the better. For the developers, we have to deal with the ultra slow update cycles of IE and ultraspeed update cycles of Chrome. In short, we are getting worse and worse in the browser arena. The market is ripe for a breakthrough.

“2006 era Firefox” would have been Firefox 1.5 or Firefox 2.  Balaji may think he’s nostalgic for browsers of that era, but really he’s nostalgic for the web of that era, which was massively simpler than the web of today.  If Balaji tried Firefox 1.5 or Firefox 2 today — with no HTML5 support, no JavaScript JIT and no hardware acceleration — today, I’m sure he’d quickly decide that 2012-era browsers aren’t so bad after all.  I guess the interesting question is this: why do people blame browsers instead of websites for high resource consumption?

Bug counts

This week’s bug counts:

  • P1: 28 (-5/+5)
  • P2: 129 (-12/+7)
  • P3: 83 (-8/+12)
  • Unprioritized: 2 (-2/+2)

That’s a net reduction of one bug.  But more importantly, there is lots of movement, which is great!  It means that problems are being identified and fixed.

(Finally, commenters please note that I’ve turned on the WP-reCAPTCHA plug-in, and this the first post I’ve written since doing so.  In my testing it’s worked fairly well.  Hopefully it won’t cause problems.)
Categories
about:compartments about:memory add-ons compartments Firefox Memory consumption MemShrink

MemShrink progress, week 36

Lots of activity this week.

Leaky add-ons

I created a new devmo wiki page documenting common causes of memory leaks in add-ons.  I based this on a lovely selection of examples provided by Nils Maier.  Unfortunately, I know almost nothing about writing add-ons and so I’m not happy with the current state of the documentation.  I’ve taken it as far as I can, but it very likely has errors, leaves out important cases, conflates distinct concepts, and generally is not as good as it should be.  This documentation is really important — we have good tools for identifying when add-on leaks occur but we don’t yet have good tools for identifying their causes.  Until we have those tools, documentation is the only way we can help add-on authors fix leaks.  If someone who knows more about add-ons is willing to help please contact me!

Alexandre Poirot fixed a leak in the Add-on SDK that was causing zombie compartments when certain add-ons were disabled.  This also fixed bug 725603 and probably fixes some zombie compartments reported in some other add-ons (e.g. MemChaser).

Jan fixed several leaks in the Galaxytoolbar add-on.  The new version is 2.6.12.

A small number of add-ons have been found that disable Firefox’s XUL cache.  This is a recipe for disastrous performance, and so Matt Basta updated the AMO add-on validator to detect this.

Tools

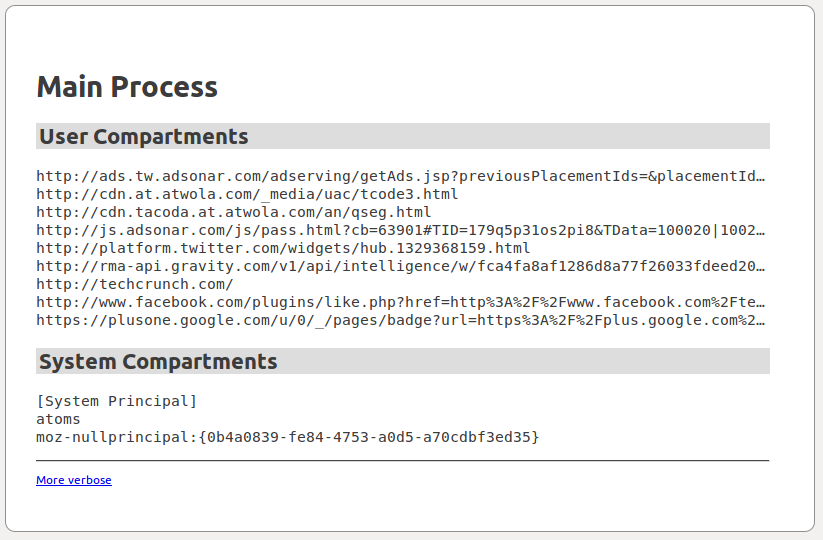
I landed support for a new page called about:compartments. The exposure of zombie compartments in about:memory has become an extremely powerful leak detection tool.  But using about:memory to find zombies is non-trivial — there are multiple steps and ways to get it wrong.  The motivation for about:compartments is to make the detection of zombie compartments as simple as possible.  Here’s a screenshot:

about:compartments screenshot

Some things to note:

  • It only shows compartments, and all of them.
  • User compartments from web content (usually the interesting ones) are listed separately from system compartments.
  • The garbage and cycle collectors are automatically run when the page is loaded, ensuring that dead compartments aren’t listed.
  • The “More verbose” link at the bottom just causes the truncated URLs to be shown in full.
  • about:compartments shares a lot of code with about:memory.
  • I updated the documentation on zombie compartments accordingly.

Olli Pettay created about:cc, an add-on that can detect various kinds of document leaks relating to cycle collection.  Olli has already found several leaks with this tool.  Jan Honza Odvarko has written about:ccdump, a similar but prettier add-on.  I’m not certain but I think Olli and Jan are now co-ordinating their efforts.

I mentioned Mozilla QA’s MemChaser add-on a few weeks ago.  It lets you track memory usage and GC/CC activity easily via the add-on bar, and also allows logging of memory-related activities.  It’s now available on AMO, which guarantees you’ll receive updates as they’re released.

Jesse Ruderman tweaked his DOM fuzzer and found several new small leaks relating to nsITimers.  Jesse also modified about:memory so that it produces assertions that his fuzzer will catch.  This means that his fuzzer will detect if any memory reporters produce bogus values.

Miscellaneous

Kyle Huey fixed a zombie compartment that occurred when searching within pages with onclick handlers, which is a pretty common operation.

Jeff Muizelaar fixed a huge Mac-only leak relating to text rendering.  This was a recent regression that isn’t present in any released version of Firefox.

Josh Aas fixed a bug in cookie clearing — prior to Josh’s fix, if you cleared all cookies, Firefox would launch an instance of the plugin-container process for every plug-in installed, which could cause freezes and memory spikes.

Andrew Quartey updated the WebGL memory reporters to the new style.

Bug counts

This week’s bug counts:

  • P1: 28 (-1/+3)
  • P2: 134 (-6/+9)
  • P3: 79 (-8/+11)
  • Unprioritized: 2 (-1/+2)

Lots of movement there:  plenty of bugs fixed, but even more new ones.  Roughly 20 of the new ones fell into the following three categories.

  • Zombie compartments found in AMO add-ons by Kris Maglione and Andreas Wagner.
  • Leaks found by Olli Pettay’s new about:cc tool, mentioned above.
  • Leaks found by Jesse Ruderman’s tweaked DOM fuzzer, mentioned above.

This is a good thing!  It shows that new policies and tools are exposing existing problems.  I expect this higher level of new bug filing will continue for a couple of weeks.

Categories
add-ons Firefox Memory consumption

The McAfee Site Advisor add-on has an appalling memory leak

TL;DR: If you have the McAfee Site Advisor add-on installed in your Firefox, I recommend you disable it immediately because it has an appalling memory leak.

I wrote yesterday about a reader’s results with the McAfee Site Advisor 3.4.1 and McAfee ScriptScan 14.4.1 add-ons for Firefox — he was finding that they greatly increased Firefox’s memory consumption.

This morning I tested Site Advisor 3.4.1 myself, and found that, when enabled, it leaks every single content compartment that is createdIn other words, most of the JavaScript memory used for any page opened with Firefox is never reclaimed.  In terms of memory consumption, this is pretty much the worst possible behaviour for an add-on.  This excessive memory consumption is likely to cause Firefox to run much more slowly and crash much more often.

In the bug report I recommended that we block-list it immediately and contact McAfee, but Jorge Villalobos told me that block-listing is considered an option of last resort.  Three McAfee people have been CC’d on the bug and I’ve been told that some other Mozilla people are contacting McAfee via other channels. Hopefully we’ll see concrete action soon.

If anyone else can replicate my results, particularly for older versions of Site Advisor, that would be useful to know.  Steps to reproduce are in the bug report.

As for ScriptScan 14.4.1, I haven’t tried it myself because I haven’t been able to find where to download it from.  My searching just turned up lots of references, such as this one, to when Mozilla block-listed version 14.4.0 because it was crashing so frequently.  (Site Advisor 3.4.0 was block-listed at the same time.  And SiteAdvisor 3.3.1 was also block-listed due to crashes!)  If anyone can tell me where to get ScriptScan from that would be very helpful.

If you have any McAfee add-ons installed in your Firefox, I strongly recommending disabling them immediately.  McAfee clearly has a poor record when it comes to the quality of their Firefox add-ons.  I also personally found Site Advisor to be an extremely annoying and unhelpful add-on.  I’m no expert on Windows security but if you are looking for alternatives I have heard numerous people say that Microsoft Security Essentials is the best anti-virus/security system for Windows — it’s reputedly very effective, and is free of charge and non-intrusive.  It also doesn’t install any add-ons into Firefox.

Categories
add-ons Firefox Memory consumption MemShrink

McAfee is killing us

A reader named AC commented on last week’s MemShrink report that Firefox was consuming lots of memory on his girlfriend’s computer (emphasis added by me):

I am currently on my girlfriends laptop round at her house and I am surfing the net using Firefox 10.0.1. The memory usage is terrible. It may be because of the two McAfee add-ons that she has, I don’t know, but I can see now first hand how some Firefox users are having an amazing experience and others are still lagging behind. The memory usage as opposed to being 200,000-230,000kb as it would be on my laptop with 11 beta 2 is about 350,000kb or more. That said, there is no loss of performance and that is what matters most. I am not looking for answers or solutions, merely saying that the same or very similar software used on one computer can perform completely differently on another and now I appreciate that even more having witnessed it for myself.

I asked him to try turning off the McAfee add-ons, which he kindly did.  The result (emphasis again added by me):

I did some very very rudimentary tests earlier at my girlfriends house on her laptop and here is what I found.

With the two McAfee add-ons running everything was fine until I got to about 8 tabs and then the memory began to increase. Then it just climbed up to about 450,000 kb. If I was running the same tab load on my latop, I would expect just over half that amount of memory to be reported in task manager.

I have to say that there was no loss of performance, but the amount of memory being used was very high for the tab load.

The first tab that I had open was google.co.uk. I right clicked on that tab and hit “Close Other Tabs”. The memory stayed at 418,000 kb and that was it. It stayed at that level for about 10 minutes whilst I went and did other stuff. It wasn’t going up or down. 400MB with just Google UK open and nothing else. It’s diabolical.

So I then disabled the 2 McAfee add-ons and every went back to normal. I used a heavy tab load than before. I opened more tabs with more complex content. I must have had about 15 tabs open and the memory use peaked at 386,000 kb.

Then I logged out of Facebook and Hotmail, without closing any tabs, and within 10 seconds the memory had dropped to 330,000 kb.

Then I closed all but 3 tabs and within 30 seconds the memory was about 180,000.

Then I closed all but one tab and the memory settled at just under 100,000 kb. Back to normal. Exactly how I would expect Firefox 10.0.1 to perform.

The extensions in question were McAfee ScriptScan for Firefox 14.4.1 and McAfee Site Advisor 3.4.1

I didn’t have time to test them individually as things got hectic after that, but as you say Nicholas, the seemingly innocent extensions were ruining the memory performance of a perfectly good browser.

I could still load pages etc and navigate around as fast, but the numbers on task manager were sky high.

Firefox has a reputation in particular for not releasing memory when tabs are closed.  75% of installed add-ons are not hosted on AMO, and thus are out of Mozilla’s control.  This is killing us.  Bug 720856 is my best suggestion for dealing with badly written add-ons such as these ones, but even it feels like weak tea when the problem is so large.

Categories
Meta

Blog hassles

The Mozilla WordPress installation was upgraded a couple of days ago.  I had a simple captcha plug-in enabled before this (I don’t remember it’s name).  It asked you to solve a very simple arithmetic problem (e.g. “what is 1+1”) before your comment would appear.  It was very effective at stopping spam comments.  Prior to me enabling it I would get  numerous spam comments per post which I had to manually delete.

After the upgrade, this plug-in doesn’t seem to be available any more.  There’s a plug-in called “simple CAPTCHA” which is a picture-based one.  I turned it on but some people reported problems, there were some double-posts, and when I tested it the captcha image didn’t load properly.  Furthermore, spam comments still seemed to be getting through.

Any suggestions?  None of the other spam-fighting plug-ins seem appropriate.  Really, I just want my simple arithmetic problem captcha back.  If I can’t get something working I might have to require people login before commenting.  But I’d rather not do that, as it will deter some commenters.

Categories
about:memory add-ons Firefox Memory consumption MemShrink

MemShrink progress, week 35

Add-ons

Zombie compartments were fixed in the following add-ons:  Customize Your Web (fixed by Rudolf Noe), GridTube (fixed by Costas B.), Do Not Track Plus (fixed by kiran).

Marco Bonardo changed the Places JS services in a way that prevents certain kinds of SQLite connection leaks.  As far as I can tell, this fixes leaks in the Delicious Bookmarks and CyberSearch add-ons.

Finally, Alexandre Poirot fixed a bug in the Add-on SDK that was causing zombie jetpack compartments in some cases when add-ons were disabled.

Memory Reporting

Hugh Nougher added a memory reporter for GPU memory on Windows 7 and Vista.  See the “gpu-committed”, “gpu-dedicated” and “gpu-shared” entries in about:memory’s “Other Measurements” list.

I reduced the amount of memory allocated when generating about:memory by about 35%.

Miscellaneous

Josh Aas implemented unloading for out-of-process plug-ins.  If one is unused for 3 minutes it will be unloaded.

Andrew McCreight improved cycle collector dumping, which is useful in certain debugging cases.

Quote of the week

LifeHacker did some browser performance tests.  Firefox 10 handily won the memory usage test, which involved loading sites in 9 tabs and then measuring.  I personally think this is a pretty meaningless test, but I won’t complain about the good press.

As usual, the comments on the article featured a lot of debate about  whether Firefox is a memory hog or not.  One comment particular caught my attention:

They hardly used to be myths. I saw several times when old FF2x would be taking up over 1.4GB of RAM with just half a dozen tabs open.

Firefox 2 was released in October 2006, and superseded by Firefox 3 in June 2008.  Bad reputations are really difficult to shake.

Bug counts

This week’s bug counts:

  • P1: 26 (-0/+4)
  • P2: 131 (-6/+3)
  • P3: 76 (-2/+3)
  • Unprioritized: 1 (-2/+1)
Categories
about:memory add-ons Firefox Memory consumption MemShrink

MemShrink progress, week 34

Add-ons

The AMO add-on review checklist was amended a couple of weeks ago to include checks for zombie compartments.  This change is bearing fruit:  Andreas Wagner and Kris Maglione have found more than 10 submitted add-ons that have leaks.  See here, here, here, here, here.  With the experience they are gaining, we should be able to greatly improve the documentation on common causes of leaks.

In less positive news, two leaks were found in the add-on SDK.  Fortunately the SDK team has proven to be effective at fixing identified leaks quickly in the past, hopefully they’ll do so again!

Finally, Jason Tackaberry fixed a zombie compartment in NoSquint 2.1.2.  The fix is in the latest version (2.1.5).

about:nosy

Andrew Sutherland wrote a extension called about:nosy which is like about:memory on steroids.  It’s oriented around hiding many of the details and instead assigning blame for memory allocations to particular tabs (and similar things).  It also features graphs showing how the memory consumption of each tracked entity changes over time;  this latter feature is quite memory and CPU-intensive, however.  If you are running a recent Nightly build of Firefox, download about:nosy here and you won’t even have to restart Firefox to see it, just type “about:nosy” into the address bar.

Forthcoming changes will make about:memory more like about:nosy, by measuring more things on a per-tab basis.  And for a long time I have had a vague plan that one day someone who knows about UX will write a user-friendly alternative to about:memory that focuses just on per-tab memory consumption, and about:nosy is a good indicator of what that might look like.

Miscellaneous

Saptarshi Guha from the metrics team did an analysis of the physical memory consumption of Firefox 10, 11 and 12, based on telemetry data.  The post is heavy going for those who aren’t experts at statistics and R, but the two main conclusions of interest are (a) that add-ons significantly increase resident memory consumption, and (b) Firefox 12 is consuming more resident memory than Firefox 11.  This latter fact matches something we’d seen in today’s MemShrink meeting when looking at data from John Schoenick’s in-development version of areweslimyet.com — something in early January caused a significant memory consumption regression.  John is working on narrowing down which change caused this.

Gian-Carlo Pascutto overhauled the safe browsing implementation.  I don’t claim to understand this change at all, but I think it reduces memory consumption when the database is updated.  Better explanations from those who understand this change are welcome!

I reduced the amount of memory allocated when generating about:memory by roughly 30%.

I wrote a detailed discussion of the benefits of reducing memory consumption.

Bug Counts

Here are this week’s bug counts.

  • P1: 22 (-0/+0)
  • P2: 134 (-4/+8)
  • P3: 75 (-3/+4)
  • Unprioritized: 2 (-2/+1)