Our survey also reveals that a majority of Americans do not trust the government to protect Internet access
There’s something that Americans of varied political affiliations — Democrats, Republicans and Independents — largely agree on: the need to protect net neutrality.
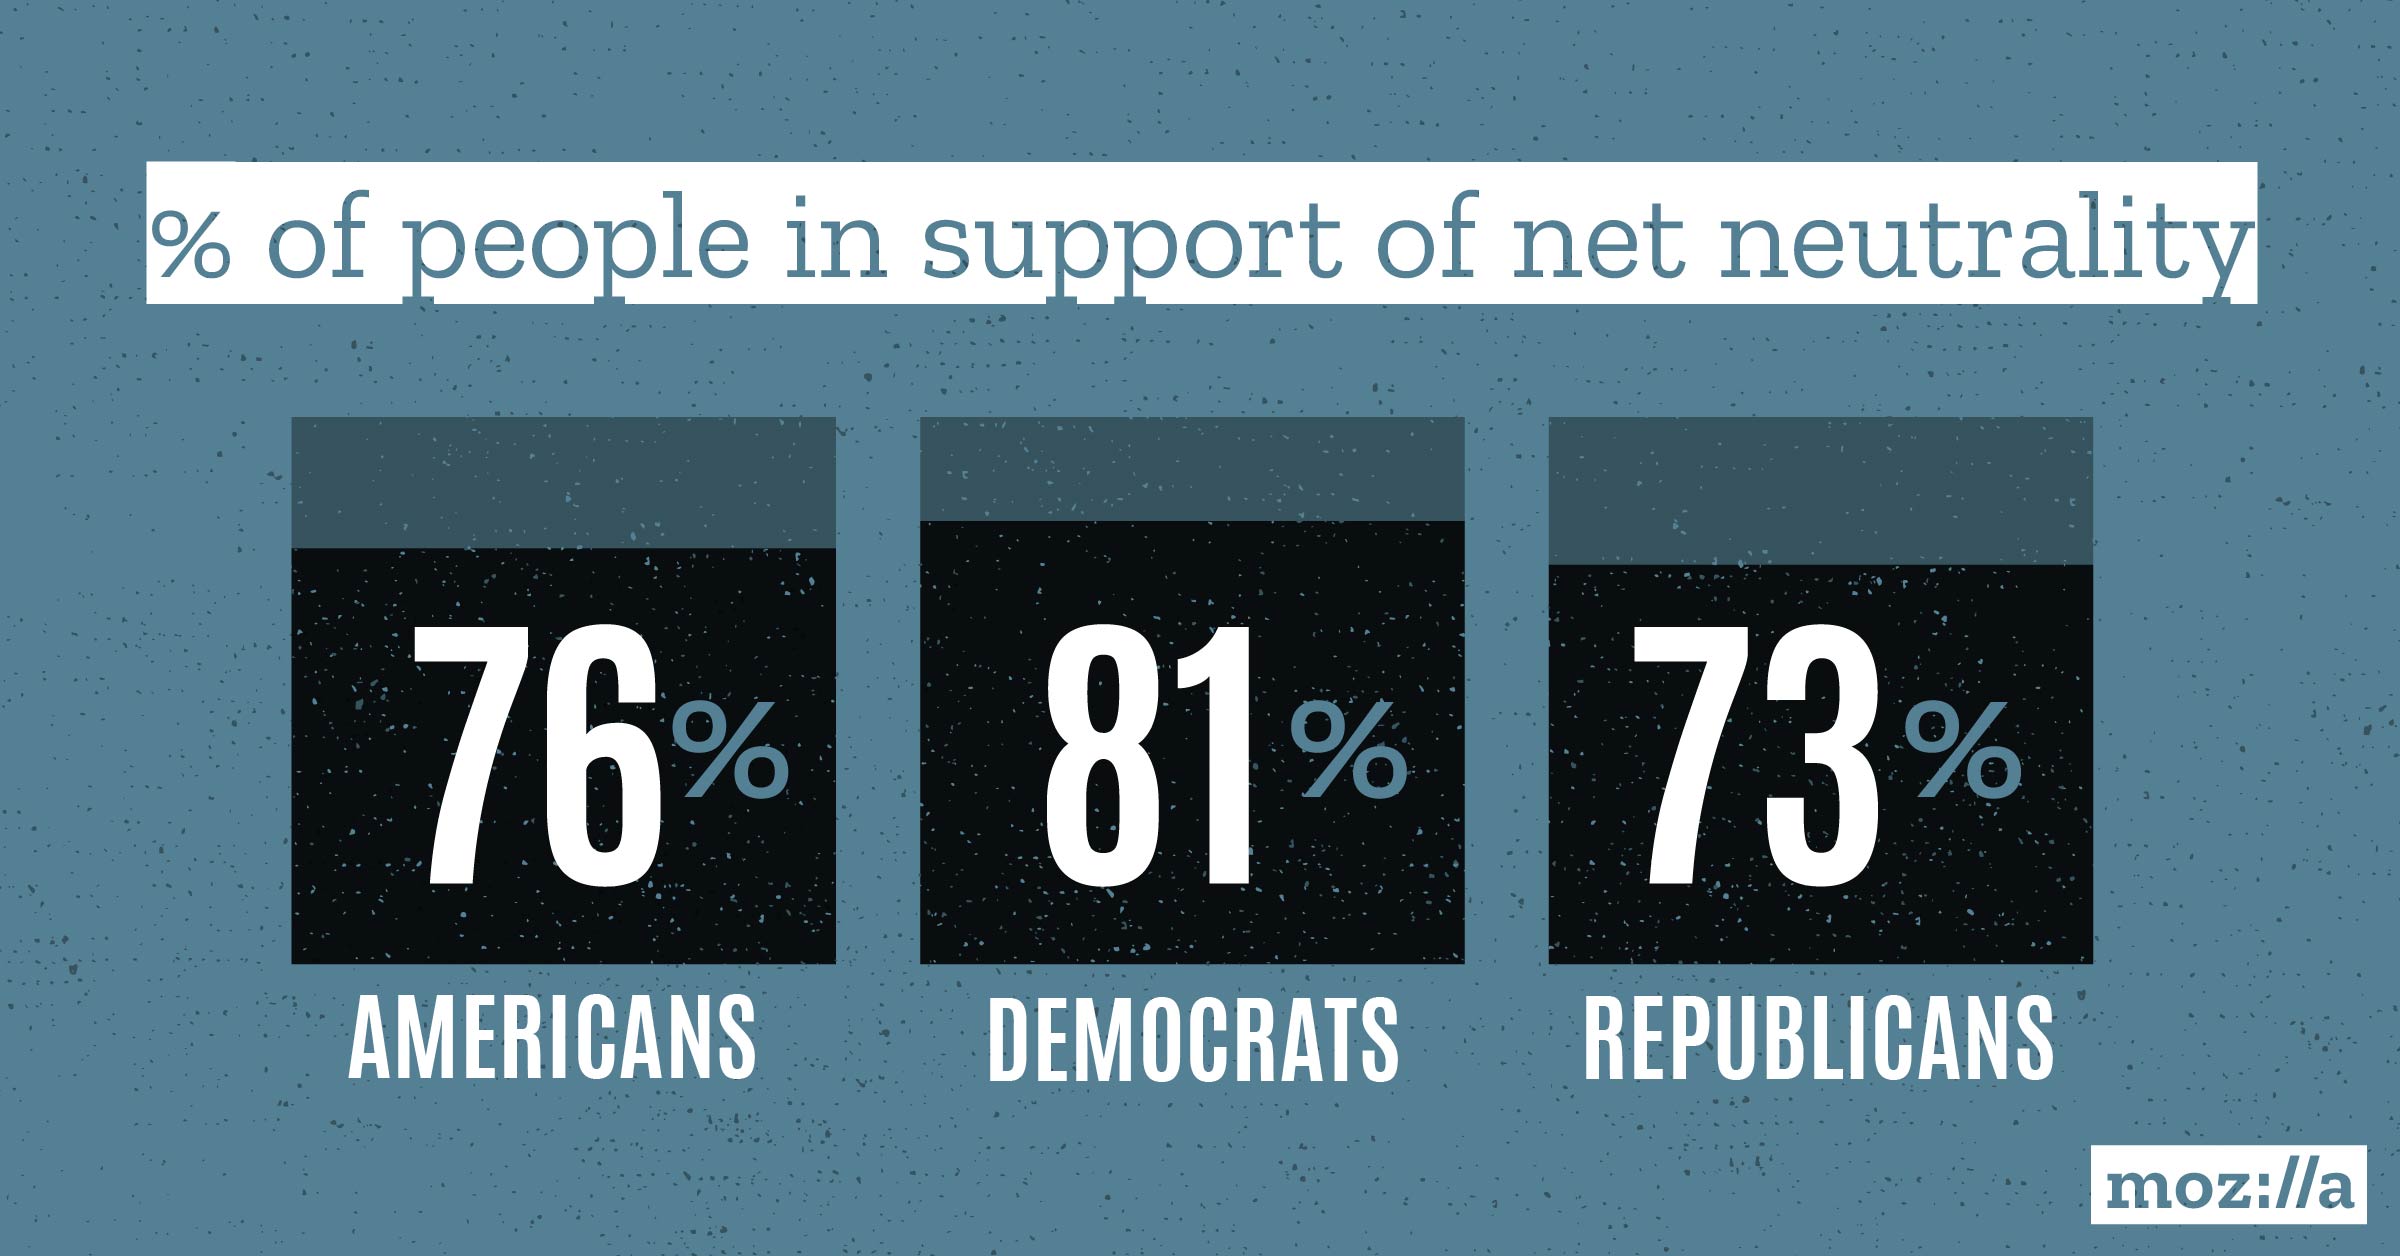
A recent public opinion poll carried out by Mozilla and Ipsos revealed overwhelming support across party lines for net neutrality, with over three quarters of Americans (76%) supporting net neutrality. Eighty-one percent of Democrats and 73% of Republicans are in favor of it.

Another key finding: Most Americans do not trust the U.S. government to protect access to the Internet. Seventy percent of Americans place no or little trust in the Trump administration or Congress (78%) to do so.
Mozilla and Ipsos carried out the poll in late May, on the heels of the FCC’s vote to begin dismantling Obama-era net neutrality rules. We polled approximately 1,000 American adults across the U.S., a sample that included 354 Democrats, 344 Republicans, and 224 Independents.
At Mozilla, we believe net neutrality is integral to a healthy Internet: it enables Americans to say, watch and make what they want online, without meddling or interference from ISPs (Internet Service Providers, such as AT&T, Verizon, and Time Warner). Net neutrality is fundamental to free speech, competition, innovation and choice online.
As you may have seen, the FCC has proposed rolling back net neutrality protections that were enacted in 2015, and will collect public comments on net neutrality through August 18th. Then, hopefully drawing on those comments, the FCC will vote whether to adopt the order and strip their ability to create net neutrality rules.
In the coming months, Mozilla will continue to work with the majority of Americans who endorse net neutrality. We will directly engage with key policymakers. We will continue our advocacy work — like our net neutrality petition, which has garnered more than 100,000 signatures and over 50 hours of voicemail messages for the FCC (just a few of the almost five million comments on the order). And Mozilla will participate in the July 12 Day of Action, joining Fight for the Future, Free Press, Demand Progress and others to call for all Internet users to defend net neutrality.
Below, more key findings from the poll:
— Respondents across the political spectrum (78%) believe that equal access to the Internet is a right, with large majorities of Democrats (88%), Independents (71%), and Republicans (67%) in agreement
— Respondents have little trust in government institutions to protect their access to the Internet. The highest levels of distrust were reported for the Trump administration (70%), Congress (78%) and the FCC (58%)
— When it comes to corporations protecting access to the Internet, 54% of respondents distrust ISPs
— Americans view net neutrality as having a positive impact on most of society. Respondents said it is a “good thing” for small businesses (70%), individuals (69%), innovators (65%) and ISPs (55%), but fewer think that it will benefit big businesses (46%)
Below, the full results from our poll.
Q1. How much do you trust the following institutions, if at all, to protect your access to the internet?
ISPs (Internet service providers, such as AT&T, Verizon, Time Warner, etc.)
| Total | Democrat | Republican | Independent | |
| Trust completely | 9% | 9% | 10% | 8% |
| Mostly trust | 35% | 38% | 39% | 27% |
| Trust a little bit | 38% | 38% | 37% | 37% |
| Do not trust at all | 16% | 12% | 13% | 26% |
| Don’t know | 3% | 3% | 2% | 2% |
The Trump Administration
| Total | Democrat | Republican | Independent | |
| Trust completely | 10% | 5% | 21% | 6% |
| Mostly trust | 15% | 4% | 31% | 14% |
| Trust a little bit | 20% | 10% | 31% | 24% |
| Do not trust at all | 50% | 78% | 15% | 46% |
| Don’t know | 5% | 2% | 3% | 9% |
The Federal Communications Commission
| Total | Democrat | Republican | Independent | |
| Trust completely | 6% | 7% | 9% | 3% |
| Mostly trust | 28% | 30% | 32% | 21% |
| Trust a little bit | 34% | 34% | 35% | 37% |
| Do not trust at all | 24% | 21% | 16% | 32% |
| Don’t know | 9% | 8% | 8% | 7% |
Internet Companies
| Total | Democrat | Republican | Independent | |
| Trust completely | 8% | 6% | 11% | 7% |
| Mostly trust | 29% | 34% | 33% | 21% |
| Trust a little bit | 44% | 43% | 42% | 42% |
| Do not trust at all | 16% | 12% | 12% | 28% |
| Don’t know | 4% | 4% | 2% | 1% |
Congress
| Total | Democrat | Republican | Independent | |
| Trust completely | 6% | 6% | 8% | 3% |
| Mostly trust | 13% | 13% | 16% | 10% |
| Trust a little bit | 34% | 37% | 35% | 30% |
| Do not trust at all | 44% | 41% | 38% | 52% |
| Don’t know | 4% | 3% | 3% | 5% |
Q2. Which of the following statements do you agree more with?
| Total | Democrat | Republican | Independent | |
| Consumers should be able to freely and quickly access their preferred content on the internet | 86% | 88% | 81% | 85% |
| ISPs should be able to offer fast lanes with quicker load times to websites that pay a premium | 14% | 12% | 19% | 15% |
Q3. Based on all the things you know or have heard, do you support or oppose net neutrality?
(Note: Participants saw net neutrality defined as: “Net neutrality is the principle that internet service providers providing consumer connection to the Internet should treat all data on the internet the same, not giving specific advantages or penalties in access by user, content, website, platform, or application.”)
| Total | Democrat | Republican | Independent | |
| Strongly support | 30% | 35% | 25% | 29% |
| Somewhat support | 46% | 46% | 48% | 42% |
| Somewhat oppose | 20% | 17% | 20% | 24% |
| Strongly oppose | 4% | 2% | 6% | 5% |
Q4. Do you think that net neutrality is a good thing or a bad thing for the following groups?
Small businesses
| Total | Democrat | Republican | Independent | |
| Bad thing | 9% | 9% | 10% | 10% |
| Good thing | 70% | 68% | 75% | 72% |
| Makes no difference | 21% | 23% | 15% | 18% |
Big business
| Total | Democrat | Republican | Independent | |
| Bad thing | 21% | 29% | 15% | 20% |
| Good thing | 46% | 41% | 53% | 50% |
| Makes no difference | 33% | 30% | 32% | 31% |
Innovators
| Total | Democrat | Republican | Independent | |
| Bad thing | 10% | 10% | 11% | 12% |
| Good thing | 65% | 68% | 64% | 64% |
| Makes no difference | 25% | 22% | 25% | 24% |
Internet service providers
| Total | Democrat | Republican | Independent | |
| Bad thing | 18% | 20% | 18% | 20% |
| Good thing | 55% | 55% | 60% | 55% |
| Makes no difference | 26% | 25% | 22% | 25% |
People like me
| Total | Democrat | Republican | Independent | |
| Bad thing | 8% | 6% | 9% | 11% |
| Good thing | 69% | 70% | 70% | 68% |
| Makes no difference | 23% | 24% | 21% | 21% |
Q5. To what extent do you agree or disagree with the following statements?
Internet services providers will voluntarily look out for consumers’ best interests
| Total | Democrat | Republican | Independent | |
| Strongly agree | 11% | 12% | 10% | 11% |
| Somewhat agree | 26% | 28% | 28% | 21% |
| Somewhat disagree | 33% | 32% | 35% | 33% |
| Strongly disagree | 26% | 22% | 26% | 33% |
| Don’t know | 4% | 6% | 2% | 3% |
Equal access to the internet is a right
| Total | Democrat | Republican | Independent | |
| Strongly agree | 41% | 52% | 27% | 44% |
| Somewhat agree | 37% | 36% | 40% | 31% |
| Somewhat disagree | 10% | 6% | 17% | 9% |
| Strongly disagree | 8% | 3% | 13% | 9% |
| Don’t know | 4% | 3% | 3% | 7% |
About the Study
These are findings from an Ipsos poll conducted May 24-25, 2017 on behalf of Mozilla. For the survey, a sample of roughly 1,008 adults age 18+ from the continental U.S., Alaska and Hawaii was interviewed online in English. The sample includes 354 Democrats, 344 Republicans, and 224 Independents.
The sample for this study was randomly drawn from Ipsos’s online panel (see link below for more info on “Access Panels and Recruitment”), partner online panel sources, and “river” sampling (see link below for more info on the Ipsos “Ampario Overview” sample method) and does not rely on a population frame in the traditional sense. Ipsos uses fixed sample targets, unique to each study, in drawing sample. After a sample has been obtained from the Ipsos panel, Ipsos calibrates respondent characteristics to be representative of the U.S. Population using standard procedures such as raking-ratio adjustments. The source of these population targets is U.S. Census 2013 American Community Survey data. The sample drawn for this study reflects fixed sample targets on demographics. Post-hoc weights were made to the population characteristics on gender, age, race/ethnicity, region, and education.
Statistical margins of error are not applicable to online polls. All sample surveys and polls may be subject to other sources of error, including, but not limited to coverage error and measurement error. Where figures do not sum to 100, this is due to the effects of rounding. The precision of Ipsos online polls is measured using a credibility interval. In this case, the poll has a credibility interval of plus or minus 3.5 percentage points for all respondents. Ipsos calculates a design effect (DEFF) for each study based on the variation of the weights, following the formula of Kish (1965). This study had a credibility interval adjusted for design effect of the following (n=1,008, DEFF=1.5, adjusted Confidence Interval=5.0).
The poll also has a credibility interval plus or minus 5.9 percentage points for Democrats, plus or minus 6.0 percentage points for Republicans, and plus or minus 7.5 percentage points for Independents.
For more information about conducting research intended for public release or Ipsos’ online polling methodology, please visit our Public Opinion Polling and Communication page where you can download our brochure, see our public release protocol, or contact us.


