16
Aug 13

recent android startup performance work

We’re still whittling away at the startup time on Android.  Shilpan Bhagat took a crack at speeding up parsing profiles.ini.  Brian Nicholson debugged a crash-tastic patch to initialize the C++ side of Firefox for Android sooner, and seems to have fixed the crashiness that plagued such approaches before.  Starting the initialization of Gecko itself sooner is important because that can happen in parallel with the work happening in Java on multi-core devices.  And chatting with Sriram Ramasubramanian yesterday about some menu initialization that was showing up on profiles, he assured me that startup time was definitely being taken into account when adding new features, which is great!

Before I get to the other work that’s been going on, I need to talk about how cross-language communication works in Firefox for Android.

Firefox for Android uses three primary languages: C++ for Gecko, Java for the Android UI and related bits, and JavaScript for all sorts of things.  Java and C++ play nicely via JNI, and Javascript and C++ talk to each other via XPCOM.  But what happens when Java needs to talk to JS or vice versa?  The solution that’s been chosen here is that Java constructs and serializes a JSON message, sends that to C++, which then notifies observers that a particular kind of message has been received.  Registered JavaScript observers (you could also do this in C++, of course, but it’s just easier to do it in JavaScript) are then invoked, parse the JSON, and do their thing.  And of course there’s a reverse path for sending things from JavaScript to Java.

With that being said, you might not be surprised that Chris Kitching identified that JSON parsing and serialization are slowing down startup. We spend nearly 200ms doing JSON operations on a Galaxy Nexus–just in Java, never mind JavaScript (though the JavaScript JSON bits are quite fast because they’re backed by C++ code).  Part of this is because the interface that Android uses for JSON is not well-designed and part of this is because the implementation could be improved (though Android does not use the json.org implementation, both could be improved).  Part of this is also because we do things like JSON-wrap single integers when there are much more efficient ways to communicate such values.  I’ve been fixing up some small hotspots (warmspots?), starting with sending telemetry information and Java’s requests for preferences information.

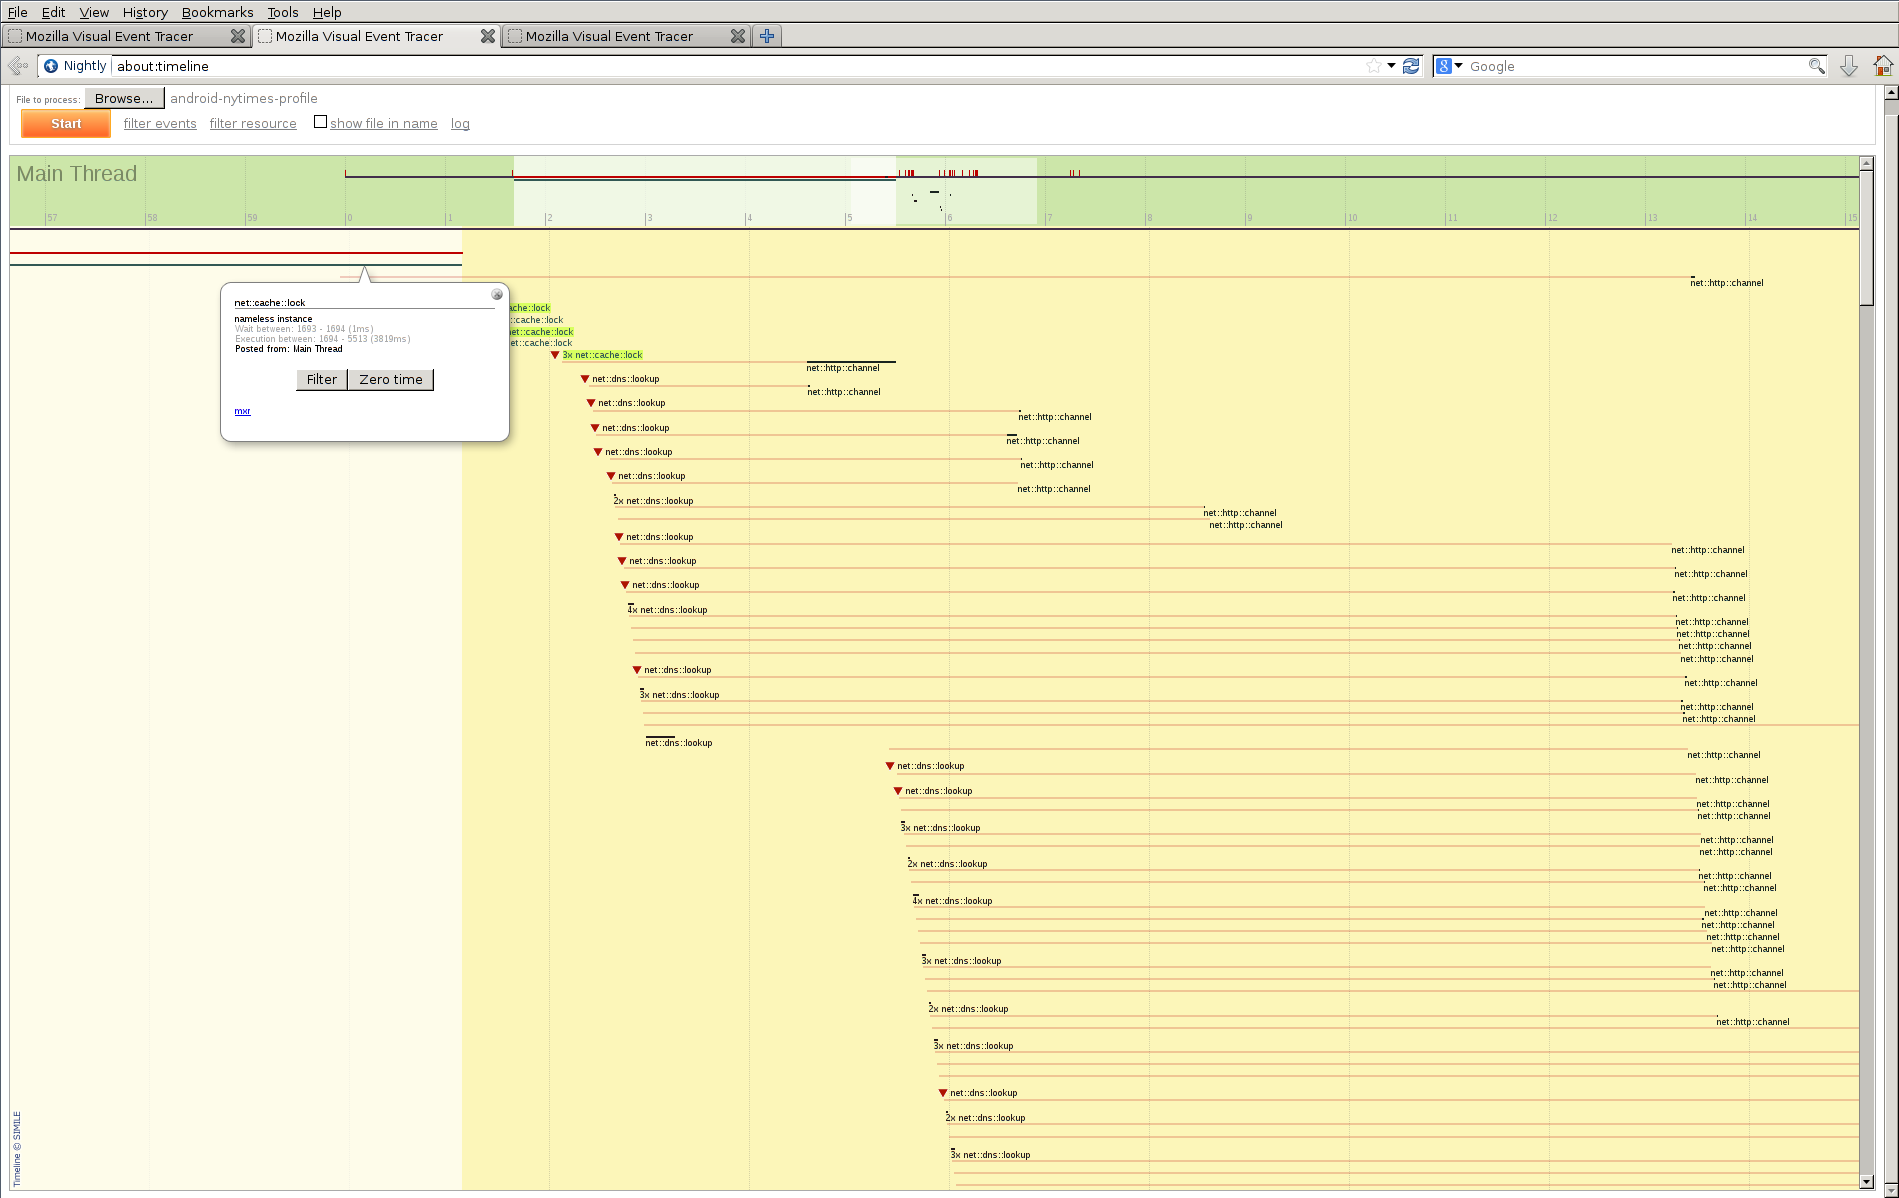
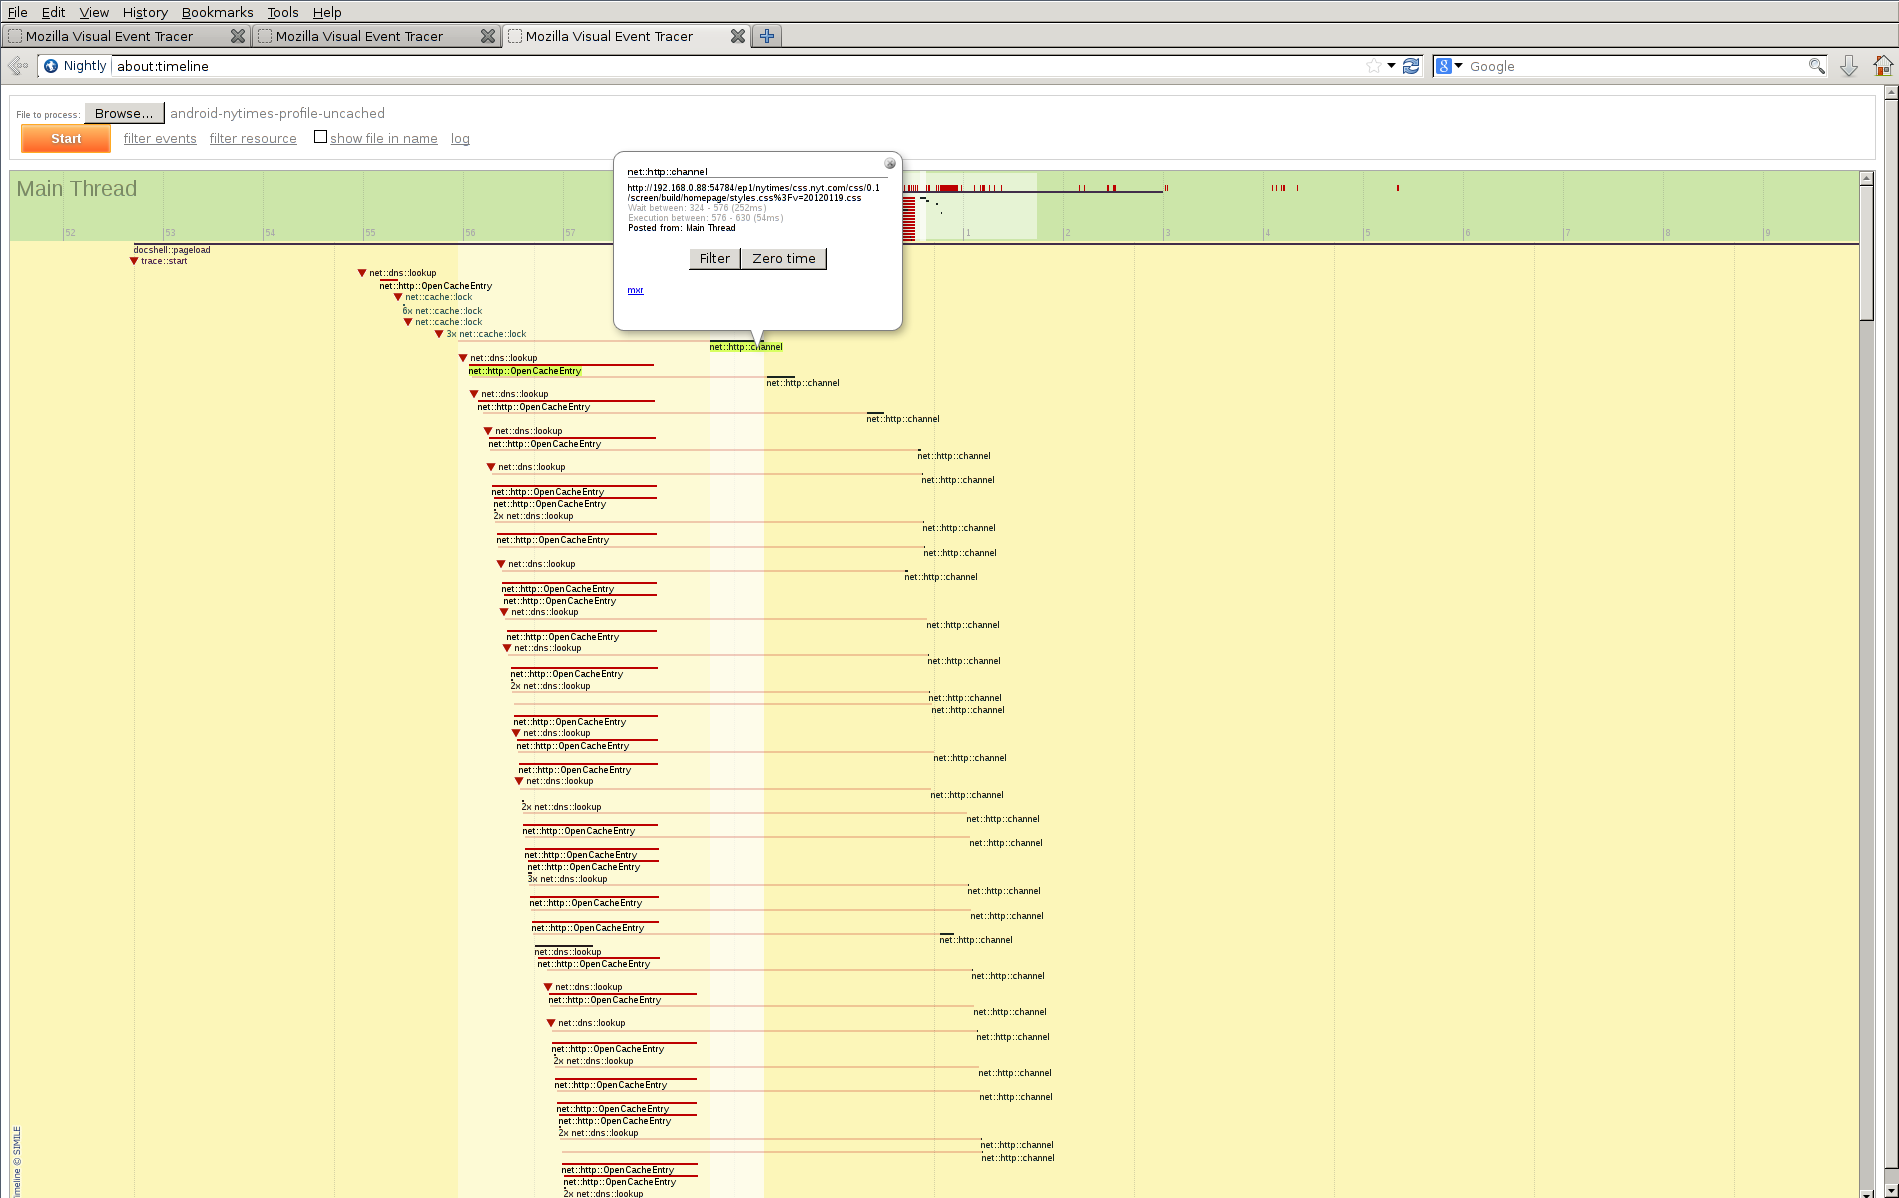
For some things, however, we do have to deal with JSON.  Firefox for Android twiddles with the sessionstore information before forwarding it to JavaScript, and sending the sessionstore information in any other format than JSON would be…tedious.  The twiddling itself is not particularly expensive, but the reading/parsing/serialization required around it is.  For a smallish session of six tabs, where we only have ~2KB of sessionstore JSON to deal with, reading/parsing/serializing the data takes almost 250ms on a Galaxy Nexus.  This is expensive enough that techniques like parsing it on a background thread might be worthwhile.  It’s not entirely clear whether it helps (different profiling tools say different things, single-core devices may not benefit from it, etc.), though.


15
Aug 13

better build times through configury

There’s been a flurry of activity lately on making Firefox build faster.  One thing that’s not talked about much is tailoring what features how build or how you build can make things go faster.  Below are a couple configure options that may make your life better, depending on what platform you develop for and what your focus is.  None of these are going to help as much as glandium’s xulrunner SDK development trickery, but for those who can’t do that, for whatever reason, these may be helpful.  Add them to your mozconfig with ac_add_option or your manual configure invocation if you are oldschool.

  • --disable-debug-symbols: This option isn’t appropriate if you plan on doing any C/C++ debugging. Really. But if you work more-or-less exclusively in JavaScript (or Java, for Android), this option can make your builds go much faster by making your object files smaller and link times faster. My local Android builds shave 30 minutes of total runtime (!) by enabling this. The actual win is somewhere on the order of 3 minutes due to the wonders of parallel make. Still, 15% improvements are nothing to sneeze at.
  • --disable-crashreporter: This configure option builds less code, which is always a good thing.  Needing the crashreporter would be pretty unusual for local development, so this is probably pretty safe.
  • --disable-webrtc: Again, ths option is for not building a (somewhat larger) swath of code.  May not be appropriate if you’re doing Web Audio or trying to measure startup improvements.
  • --disable-icf: This option is only useful if you’re building on Linux and you know you’re using the gold linker.  This option turns off merging of identical functions, which makes the linker run slightly faster.  (May also work on Windows with opt builds, not sure.)

For development on Linux with GCC specifically, there are a few compiler options that may make your life better also:

  • -fno-var-tracking: This option makes the debug information for C/C++ slightly less accurate.  Variable tracking is a relatively new thing (GCC 4.6+) and tends to suck up quite a bit of compile time.  If you were debugging happily with GCC 4.5 and earlier, you may not notice any problems with turning variable tracking off.
  • -gsplit-dwarf: What this does is it separates debug information into a completely different file from the actual compiled code.  This change, in turn, makes the object files smaller, primarily for the benefit of the linker.  You can read more about the motivation for splitting debug information into separate files on the GCC Wiki.  There’s also a bug about adding this by default to local developer builds.  (Recent SVN builds of clang also support this option, I think.)

Finally, if you want to dive really deep, you can play around with the options passed to the gold linker on Linux.  (And if you do, please post some numbers to that bug; we’d love to get more data on how those options work for people!)


12
Aug 13

the language lawyer: the curious constexpr conundrum

Last week, in a push that purported to eliminate a number of static constructors from the tree, I burned the Mac debug build:

In file included from SVGAnimateMotionElementBinding.cpp:13:
In file included from ../../dist/include/mozilla/dom/SVGAnimateMotionElement.h:11:
In file included from ../../../content/svg/content/src/SVGMotionSMILAnimationFunction.h:11:
In file included from ../../dist/include/nsSMILAnimationFunction.h:15:
In file included from ../../dist/include/nsSMILValue.h:10:
../../dist/include/nsSMILNullType.h:47:17: error: constexpr constructor never produces a constant expression [-Winvalid-constexpr]
MOZ_CONSTEXPR nsSMILNullType() {}
^
../../dist/include/nsSMILNullType.h:47:17: note: non-literal type 'nsISMILType' cannot be used in a constant expression

This error message caused some confusion:

18:41 < froydnj> "constexpr constructor never produces a constant expression"? what does *that* mean?
18:42 < philor> sweet, now you know what *every* compiler message sounds like to me

Searching the web for the error was also unhelpful. There was a Qt bug report from a year ago that wasn’t relevant and a smattering of pages discussing just how smart the compiler needs to be to diagnose invalid constant expressions. The closest hit was from a GCC bug on constexpr diagnostics. But even that didn’t quite tell the whole story. So what’s going on here?

I wasn’t sure what a literal type was, so I looked it up. The epsilon-close-to-the-standard draft, N3337, defines the term literal type in [basic.types] paragraph 10 (you’ll usually see this abbreviated to just [basic.types]p10 in discussions or compiler front-end comments; I’ll be abbreviating standard references from here on out):

A type is a literal type if it is:

  • a scalar type; or
  • a reference type referring to a literal type; or
  • an array of literal type; or
  • a class type (Clause 9) that has all of the following properties:
    • it has a trivial destructor,
    • every constructor call and full-expression in the brace-or-equal-initializers for non-static data
      members (if any) is a constant expression (5.19),
    • it is an aggregate type (8.5.1) or has at least one constexpr constructor or constructor template
      that is not a copy or move constructor, and
    • all of its non-static data members and base classes are of literal types.

That bit explains how we have a non-literal type in debug builds: debug builds define a no-op protected destructor. Since that destructor is user-provided and not defaulted, it is non-trivial (in the language of the standard; you can read [class.dtor]p5 for the definition of trivial destructors and [class.ctor]p5 for the definition of trivial constructors). The destructor therefore fails the first property of a literal class type, above. (In debug builds, we define a protected destructor to ensure that nobody is improperly deleting our type. But in opt builds, we don’t define the constructor so that it becomes compiler-defaulted and optimized away properly by intelligent frontends. And that means that any static instances of nsSMILNullType don’t need static constructors.)

OK, but why is having a non-literal type a problem? The compiler ought to simply execute the constructor normally and not worry about the constexpr annotation, right? Except that there is this bit in the definition of constant expressions, [expr.const]p2: “A conditional-expression is a constant-expression unless it involves one of the following as a potentially evaluated subexpression…: …an invocation of a function other than a constexpr constructor for a literal class or a constexpr function”

Aha! Here is our real problem. We are claiming that the constructor of nsSMILNullType is constexpr, but actually executing that constructor in an expression is by definition not a constant expression. And so Clang issues an error, as it should.

Moral of the story: don’t define destructors for classes that you give constexpr constructors to…unless you can default them. Guess we might have to add MOZ_DEFAULT to MFBT after all!


02
Aug 13

I got 99 problems…and compilation time is one of them

Over the past week or so, there have been a few conversations on #developers about the ever-increasing time it takes to compile Firefox.  Compiling Firefox used to be a relatively quick affair (well, on my machine, at least) and I’ve grown dissatisfied recently with builds taking ever-longer.  All of the aforementioned discussions have boiled down to “well, we’re adding a lot of code and all that code takes longer to compile.”

Surely that can’t be the whole story.  A mozilla-central build from a day or two took about 24 minutes on my machine (Linux x86-64 hyperthreaded 8-core @ 2.6GHz, srcdir on SSD, objdir on mechanical hard drive).  We are not compiling 2.4x times more code than we were a year ago…or are we?  Let’s look at some numbers.

I looked at my mozilla-central repository for some convenient tags to pick from and found the FIREFOX_AURORA_${REV}_BASE set of tags.  I started compiling with mozilla-central tip, and then with FIREFOX_AURORA_24_BASE, and resolved to go as far back as I could without undue fiddling with things that wouldn’t compile.  I made it to FIREFOX_AURORA_14_BASE before hitting compilation errors with moz_free.  (19 and previous required small fiddling with js/src to set the right PYTHON, but that was easily scriptable.)  That gives me 11 markers covering over a year of development.

I didn’t try compiling things multiple times to see how much the numbers fluctuated.  I didn’t attempt to control for operating system disk caches or anything like that, just hg up -r $TAG, generated configure, ran configure --enable-optimize --disable-debug --disable-gstreamer (I haven’t bothered to get my gstreamer dependencies right on my development box) in a newly-created objdir, and recorded time for make -srj20.  The compiler was GCC 4.7 from Debian stable.

m-c tag real user sys
15 13m2.025s 83m36.229s 5m51.238s
16 13m40.359s 87m56.302s 6m15.435s
17 12m58.448s 94m21.514s 6m35.121s
18 14m21.257s 112m42.839s 7m36.213s
19 15m8.415s 120m48.789s 8m8.151s
20 16m26.337s 137m34.680s 9m11.878s
21 18m55.455s 165m29.433s 10m45.208s
22 19m27.887s 185m3.242s 11m53.853s
23 21m9.002s 203m46.708s 12m51.740s
24 21m51.242s 206m49.012s 12m55.356s
tip 24m37.489s 219m27.903s 13m47.080s

Those 10-minute clobber build times were apparently the result of warm disk cache or my dreams. Or perhaps they’re due to an older compiler; I only started using GCC 4.7 recently and I’ve done some tests that show it’s a fair amount slower than GCC 4.4. Or maybe I was using a different build config then. Whatever the reason, we can see that compilation times have been increasing steadily, but can we correlate that to anything?

Let’s look at the number of C++, C, WebIDL, and IPDL source files. We include the last two because the conversion to WebIDL has been cited as a reason for increasing compilation times and IPDL because the IPDL compiler generates a number of source files as well (roughly three source files for every IPDL file). The C++ source files are split by extension; .cpp is the usual prefix to use inside Gecko, so separating .cpp and .cc gives some idea of how much outside C++ source code is being compiled. (Just counting source files is subject to issues, since we don’t compile everything in widget/ for every platform, but we’re counting all the source files therein as if they were. This is a rough estimate.)

m-c tag cpp cc c webidl ipdl
15 4060 577 2503 32 206
16 4117 1273 2893 34 213
17 4173 1278 2895 38 221
18 4468 1405 3123 61 227
19 4498 1408 3118 78 228
20 4586 1418 2779 169 228
21 4605 1392 2831 231 228
22 4979 1392 2980 305 228
23 5072 1393 2982 344 231
24 5101 1330 2983 413 234
tip 5211 1427 3029 436 234

First things first: we have a lot of code in the tree.

Now, there’s a couple of interesting things to point out. While there’s a lot of IPDL source files, the increase in IPDL can hardly be held responsible for the increase in compile time. So that’s one suspect out of the way. From 16 to 17, we barely increased the amount of code, but build times went down. This change might point to the recorded times being subject to quite a bit of variability.

We added a lot of WebIDL files from 20 to 21 while holding everything else constant and build times went up quite a bit! But we added roughly the same number of WebIDL files from 21 to 22 along with a lot more code and while build times went up, they didn’t go up by the same amount: 28 minutes of user time going from 20 to 21 and ~20 minutes of user time going from 21 to 22. There are a number of reasons why this could be so: we might not be compiling all those 500 C/C++ source files we added in 22 (ICU landed off by default in 22, so that’s ~400 files right there), the WebIDL files added in 21 might have had more of an impact, compilation-wise, the timings might fluctuate quite a bit, and so on and so forth. And notice that we added the same number of WebIDL files again from 23 to 24 and build times hardly changed. Sure, WebIDL means more files to compile. But I don’t think they are adding a disproportionate amount of time.

And finally, source code file counts. We had about 7800 source code files to compile back at Aurora 15 (remember, IPDL counts as three). We have about 10600 source files to compile now on trunk. That’s about a 40% increase that corresponds to roughly a doubling in time to compile. And yes, there’s also a lot of JS and other things that have been added that increase our time to compile. But I don’t think the amount of source code is the whole story.


01
Aug 13

visual event tracing on android and eideticker

Over the last couple of weeks, I’ve been working with Jan Bambas’s visual event tracer and using it to analyze why we’re slower than the stock Android browser on Eideticker’s New York Times pageload test.

The first order of business was to add trace-saving capabilities to the tracer.  With this change, I could capture traces on my Android device and view them on my desktop, which is much more convenient than looking at them on my phone.  (Especially because Simile Timeline, which the about:timeline extension uses, is difficult to use on mobile and slow in Firefox, so it needs all the CPU power it can get.  If any JS hackers out there have a replacement timeline widget recommendation, I am all ears!)

The second order of business was to modify Firefox to start and stop tracing automatically, rather than requiring the user to push buttons in about:timeline.  Pushing buttons works fine on desktop, not so much on automated tests on mobile devices.  I experimented with way too many fully general solutions before settling on the straightforward path: modifying nsDocShell::LoadURI to start and stop the tracer when certain URIs were fetched.

Now the tracer would automatically record profiles, on to viewing them!  I modified Jan’s about:timeline extension to function properly in a browser not built with event tracing support.  I also added the ability to use a trace saved in a file, rather than recording one in a browser.  You can see the changes I made in my about:timeline github repository.

With all those changes in hand, we can view pretty pictures of what’s going on when the browser runs Eideticker tests.  First, a normal Firefox for Android.

android-cached

That almost-4-second delay you see there is the cache getting opened.  Yes, that’s happening on the main thread and yes, it’s blocking everything else from moving forward.  This is a great illustration of why we are rewriting the network cache.  If the cache is so slow, what happens if we disable the cache?

android-uncached

It’s hard to tell from the picture, but if you looked at the Eideticker log of network requests, you’d see that everything completes somewhere around a 0.5-1 second faster (!).  Why doesn’t it speed up more than that, since we’ve removed all that cache blocking by disabling the cache?  Not sure yet, although you can see that cache entries are still getting opened.  Also, you can see highlighted in the picture that the first network request takes about 250ms to start executing from the time that it’s fired off.  That also needs to be investigated (and fixed!).

What about this new cache rewrite, how does it fare?  Thought you’d never ask.

android-newcache

Again, you have to check out the HTTP request log, but this is still another 0.3 seconds or so faster than the uncached case that we see above.  So the new network cache is a clear win in this instance.  It’s worth pointing out that the network request delays are still present here and are taking slightly longer than the cache-disabled case.  Variance in profiles?  Effects of the new cache?  Not sure yet!

I’m still figuring out my way around the tracer, but it’s a useful tool to peer into the Firefox network stack.  It would be great if other subsystems (images, CSS, layout) would hook into the event tracer so we could have visibility into what they’re doing, too.  The API is pretty simple and causes no runtime overhead in our usual release builds.