Categories
Performance Rust

How to speed up the Rust compiler

Rust is a great language, and Mozilla plans to use it extensively in Firefox. However, the Rust compiler (rustc) is quite slow and compile times are a pain point for many Rust users. Recently I’ve been working on improving that. This post covers how I’ve done this, and should be of interest to anybody else who wants to help speed up the Rust compiler. Although I’ve done all this work on Linux it should be mostly applicable to other platforms as well.

Getting the code

The first step is to get the rustc code. First, I fork the main Rust repository on GitHub. Then I make two local clones: a base clone that I won’t modify, which serves as a stable comparison point (rust0), and a second clone where I make my modifications (rust1). I use commands something like this:

user=nnethercote
for r in rust0 rust1 ; do
  cd ~/moz
  git clone https://github.com/$user/rust $r
  cd $r
  git remote add upstream https://github.com/rust-lang/rust
  git remote set-url origin git@github.com:$user/rust
done

Building the Rust compiler

Within the two repositories, I first configure:

./configure --enable-optimize --enable-debuginfo

I configure with optimizations enabled because that matches release versions of rustc. And I configure with debug info enabled so that I get good information from profilers.

[Update: I now add –enable-llvm-release-debuginfo which builds the LLVM back-end with debug info too.]

Then I build:

RUSTFLAGS='' make -j8

[Update: I previously had -Ccodegen-units=8 in RUSTFLAGS because it speeds up compile times. But Lars Bergstrom informed me that it can slow down the resulting program significantly. I measured and he was right — the resulting rustc was about 5–10% slower. So I’ve stopped using it now.]

That does a full build, which does the following:

  • Downloads a stage0 compiler, which will be used to build the stage1 local compiler.
  • Builds LLVM, which will become part of the local compilers.
  • Builds the stage1 compiler with the stage0 compiler.
  • Builds the stage2 compiler with the stage1 compiler.

It can be mind-bending to grok all the stages, especially with regards to how libraries work. (One notable example: the stage1 compiler uses the system allocator, but the stage2 compiler uses jemalloc.) I’ve found that the stage1 and stage2 compilers have similar performance. Therefore, I mostly measure the stage1 compiler because it’s much faster to just build the stage1 compiler, which I do with the following command.

RUSTFLAGS='' make -j8 rustc-stage1

Building the compiler takes a while, which isn’t surprising. What is more surprising is that rebuilding the compiler after a small change also takes a while. That’s because a lot of code gets recompiled after any change. There are two reasons for this.

  • Rust’s unit of compilation is the crate. Each crate can consist of multiple files. If you modify a crate, the whole crate must be rebuilt. This isn’t surprising.
  • rustc’s dependency checking is very coarse. If you modify a crate, every other crate that depends on it will also be rebuilt, no matter how trivial the modification. This surprised me greatly. For example, any modification to the parser (which is in a crate called libsyntax) causes multiple other crates to be recompiled, a process which takes 6 minutes on my fast desktop machine. Almost any change to the compiler will result in a rebuild that takes at least 2 or 3 minutes.

Incremental compilation should greatly improve the dependency situation, but it’s still in an experimental state and I haven’t tried it yet.

To run all the tests I do this (after a full build):

ulimit -c 0 && make check

The checking aborts if you don’t do the ulimit, because the tests produces lots of core files and it doesn’t want to swamp your disk.

The build system is complex, with lots of options. This command gives a nice overview of some common invocations:

make tips

Basic profiling

The next step is to do some basic profiling. I like to be careful about which rustc I am invoking at any time, especially if there’s a system-wide version installed, so I avoid relying on PATH and instead define some environment variables like this:

export RUSTC01="$HOME/moz/rust0/x86_64-unknown-linux-gnu/stage1/bin/rustc"
export RUSTC02="$HOME/moz/rust0/x86_64-unknown-linux-gnu/stage2/bin/rustc"
export RUSTC11="$HOME/moz/rust1/x86_64-unknown-linux-gnu/stage1/bin/rustc"
export RUSTC12="$HOME/moz/rust1/x86_64-unknown-linux-gnu/stage2/bin/rustc"

In the examples that follow I will use $RUSTC01 as the version of rustc that I invoke.

rustc has the ability to produce some basic stats about the time and memory used by each compiler pass. It is enabled with the -Ztime-passes flag. If you are invoking rustc directly you’d do it like this:

$RUSTC01 -Ztime-passes a.rs

If you are building with Cargo you can instead do this:

RUSTC=$RUSTC01 cargo rustc -- -Ztime-passes

The RUSTC= part tells Cargo you want to use a non-default rustc, and the part after the -- is flags that will be passed to rustc when it builds the final crate. (A bit weird, but useful.)

Here is some sample output from -Ztime-passes:

time: 0.056; rss: 49MB parsing
time: 0.000; rss: 49MB recursion limit
time: 0.000; rss: 49MB crate injection
time: 0.000; rss: 49MB plugin loading
time: 0.000; rss: 49MB plugin registration
time: 0.103; rss: 87MB expansion
time: 0.000; rss: 87MB maybe building test harness
time: 0.002; rss: 87MB maybe creating a macro crate
time: 0.000; rss: 87MB checking for inline asm in case the target doesn't support it
time: 0.005; rss: 87MB complete gated feature checking
time: 0.008; rss: 87MB early lint checks
time: 0.003; rss: 87MB AST validation
time: 0.026; rss: 90MB name resolution
time: 0.019; rss: 103MB lowering ast -> hir
time: 0.004; rss: 105MB indexing hir
time: 0.003; rss: 105MB attribute checking
time: 0.003; rss: 105MB language item collection
time: 0.004; rss: 105MB lifetime resolution
time: 0.000; rss: 105MB looking for entry point
time: 0.000; rss: 105MB looking for plugin registrar
time: 0.015; rss: 109MB region resolution
time: 0.002; rss: 109MB loop checking
time: 0.002; rss: 109MB static item recursion checking
time: 0.060; rss: 109MB compute_incremental_hashes_map
time: 0.000; rss: 109MB load_dep_graph
time: 0.021; rss: 109MB type collecting
time: 0.000; rss: 109MB variance inference
time: 0.038; rss: 113MB coherence checking
time: 0.126; rss: 114MB wf checking
time: 0.219; rss: 118MB item-types checking
time: 1.158; rss: 125MB item-bodies checking
time: 0.000; rss: 125MB drop-impl checking
time: 0.092; rss: 127MB const checking
time: 0.015; rss: 127MB privacy checking
time: 0.002; rss: 127MB stability index
time: 0.011; rss: 127MB intrinsic checking
time: 0.007; rss: 127MB effect checking
time: 0.027; rss: 127MB match checking
time: 0.014; rss: 127MB liveness checking
time: 0.082; rss: 127MB rvalue checking
time: 0.145; rss: 161MB MIR dump
 time: 0.015; rss: 161MB SimplifyCfg
 time: 0.033; rss: 161MB QualifyAndPromoteConstants
 time: 0.034; rss: 161MB TypeckMir
 time: 0.001; rss: 161MB SimplifyBranches
 time: 0.006; rss: 161MB SimplifyCfg
time: 0.089; rss: 161MB MIR passes
time: 0.202; rss: 161MB borrow checking
time: 0.005; rss: 161MB reachability checking
time: 0.012; rss: 161MB death checking
time: 0.014; rss: 162MB stability checking
time: 0.000; rss: 162MB unused lib feature checking
time: 0.101; rss: 162MB lint checking
time: 0.000; rss: 162MB resolving dependency formats
 time: 0.001; rss: 162MB NoLandingPads
 time: 0.007; rss: 162MB SimplifyCfg
 time: 0.017; rss: 162MB EraseRegions
 time: 0.004; rss: 162MB AddCallGuards
 time: 0.126; rss: 164MB ElaborateDrops
 time: 0.001; rss: 164MB NoLandingPads
 time: 0.012; rss: 164MB SimplifyCfg
 time: 0.008; rss: 164MB InstCombine
 time: 0.003; rss: 164MB Deaggregator
 time: 0.001; rss: 164MB CopyPropagation
 time: 0.003; rss: 164MB AddCallGuards
 time: 0.001; rss: 164MB PreTrans
time: 0.182; rss: 164MB Prepare MIR codegen passes
 time: 0.081; rss: 167MB write metadata
 time: 0.590; rss: 177MB translation item collection
 time: 0.034; rss: 180MB codegen unit partitioning
 time: 0.032; rss: 300MB internalize symbols
time: 3.491; rss: 300MB translation
time: 0.000; rss: 300MB assert dep graph
time: 0.000; rss: 300MB serialize dep graph
 time: 0.216; rss: 292MB llvm function passes [0]
 time: 0.103; rss: 292MB llvm module passes [0]
 time: 4.497; rss: 308MB codegen passes [0]
 time: 0.004; rss: 308MB codegen passes [0]
time: 5.185; rss: 308MB LLVM passes
time: 0.000; rss: 308MB serialize work products
time: 0.257; rss: 297MB linking

As far as I can tell, the indented passes are sub-passes, and the parent pass is the first non-indented pass afterwards.

More serious profiling

The -Ztime-passes flag gives a good overview, but you really need a profiling tool that gives finer-grained information to get far. I’ve done most of my profiling with two Valgrind tools, Cachegrind and DHAT. I invoke Cachegrind like this:

valgrind \
 --tool=cachegrind --cache-sim=no --branch-sim=yes \
 --cachegrind-out-file=$OUTFILE $RUSTC01 ...

where $OUTFILE specifies an output filename. I find the instruction counts measured by Cachegrind to be highly useful; the branch simulation results are occasionally useful, and the cache simulation results are almost never useful.

The Cachegrind output looks like this:

--------------------------------------------------------------------------------
            Ir 
--------------------------------------------------------------------------------
22,153,170,953 PROGRAM TOTALS

--------------------------------------------------------------------------------
         Ir file:function
--------------------------------------------------------------------------------
923,519,467 /build/glibc-GKVZIf/glibc-2.23/malloc/malloc.c:_int_malloc
879,700,120 /home/njn/moz/rust0/src/rt/miniz.c:tdefl_compress
629,196,933 /build/glibc-GKVZIf/glibc-2.23/malloc/malloc.c:_int_free
394,687,991 ???:???
379,869,259 /home/njn/moz/rust0/src/libserialize/leb128.rs:serialize::leb128::read_unsigned_leb128
376,921,973 /build/glibc-GKVZIf/glibc-2.23/malloc/malloc.c:malloc
263,083,755 /build/glibc-GKVZIf/glibc-2.23/string/::/sysdeps/x86_64/multiarch/memcpy-avx-unaligned.S:__memcpy_avx_unaligned
257,219,281 /home/njn/moz/rust0/src/libserialize/opaque.rs:<serialize::opaque::Decoder<'a> as serialize::serialize::Decoder>::read_usize
217,838,379 /build/glibc-GKVZIf/glibc-2.23/malloc/malloc.c:free
217,006,132 /home/njn/moz/rust0/src/librustc_back/sha2.rs:rustc_back::sha2::Engine256State::process_block
211,098,567 ???:llvm::SelectionDAG::Combine(llvm::CombineLevel, llvm::AAResults&, llvm::CodeGenOpt::Level)
185,630,213 /home/njn/moz/rust0/src/libcore/hash/sip.rs:<rustc_incremental::calculate_svh::hasher::IchHasher as core::hash::Hasher>::write
171,360,754 /home/njn/moz/rust0/src/librustc_data_structures/fnv.rs:<rustc::ty::subst::Substs<'tcx> as core::hash::Hash>::hash
150,026,054 ???:llvm::SelectionDAGISel::SelectCodeCommon(llvm::SDNode*, unsigned char const*, unsigned int)

Here “Ir” is short for “I-cache reads”, which corresponds to the number of instructions executed. Cachegrind also gives line-by-line annotations of the source code.

The Cachegrind results indicate that malloc and free are usually the two hottest functions in the compiler. So I also use DHAT, which is a malloc profiler that tells you exactly where all your malloc calls are coming from.  I invoke DHAT like this:

/home/njn/grind/ws3/vg-in-place \
 --tool=exp-dhat --show-top-n=1000 --num-callers=4 \
 --sort-by=tot-blocks-allocd $RUSTC01 ... 2> $OUTFILE

I sometimes also use --sort-by=tot-bytes-allocd. DHAT’s output looks like this:

==16425== -------------------- 1 of 1000 --------------------
==16425== max-live: 30,240 in 378 blocks
==16425== tot-alloc: 20,866,160 in 260,827 blocks (avg size 80.00)
==16425== deaths: 260,827, at avg age 113,438 (0.00% of prog lifetime)
==16425== acc-ratios: 0.74 rd, 1.00 wr (15,498,021 b-read, 20,866,160 b-written)
==16425== at 0x4C2BFA6: malloc (vg_replace_malloc.c:299)
==16425== by 0x5AD392B: <syntax::ptr::P<T> as serialize::serialize::Decodable>::decode (heap.rs:59)
==16425== by 0x5AD4456: <core::iter::Map<I, F> as core::iter::iterator::Iterator>::next (serialize.rs:201)
==16425== by 0x5AE2A52: rustc_metadata::decoder::<impl rustc_metadata::cstore::CrateMetadata>::get_attributes (vec.rs:1556)
==16425== 
==16425== -------------------- 2 of 1000 --------------------
==16425== max-live: 1,360 in 17 blocks
==16425== tot-alloc: 10,378,160 in 129,727 blocks (avg size 80.00)
==16425== deaths: 129,727, at avg age 11,622 (0.00% of prog lifetime)
==16425== acc-ratios: 0.47 rd, 0.92 wr (4,929,626 b-read, 9,599,798 b-written)
==16425== at 0x4C2BFA6: malloc (vg_replace_malloc.c:299)
==16425== by 0x881136A: <syntax::ptr::P<T> as core::clone::Clone>::clone (heap.rs:59)
==16425== by 0x88233A7: syntax::ext::tt::macro_parser::parse (vec.rs:1105)
==16425== by 0x8812E66: syntax::tokenstream::TokenTree::parse (tokenstream.rs:230)

The “deaths” value here indicate the total number of calls to malloc for each call stack, which is usually the metric of most interest. The “acc-ratios” value can also be interesting, especially if the “rd” value is 0.00, because that indicates the allocated blocks are never read. (See below for example of problems that I found this way.)

For both profilers I also pipe $OUTFILE through eddyb’s rustfilt.sh script which demangles ugly Rust symbols like this:

_$LT$serialize..opaque..Decoder$LT$$u27$a$GT$$u20$as$u20$serialize..serialize..Decoder$GT$::read_usize::h87863ec7f9234810

to something much nicer, like this:

<serialize::opaque::Decoder<'a> as serialize::serialize::Decoder>::read_usize

[Update: native support for Rust demangling recently landed in Valgrind’s repo. I use a trunk version of Valgrind so I no longer need to use rustfilt.sh in combination with Valgrind.]

For programs that use Cargo, sometimes it’s useful to know the exact rustc invocations that Cargo uses. Find out with either of these commands:

RUSTC=$RUSTC01 cargo build -v
RUSTC=$RUSTC01 cargo rust -v

I also have done a decent amount of ad hoc println profiling, where I insert println! calls in hot parts of the code and then I use a script to post-process them. This can be very useful when I want to know exactly how many times particular code paths are hit.

I’ve also tried perf. It works, but I’ve never established much of a rapport with it. YMMV. In general, any profiler that works with C or C++ code should also work with Rust code.

Finding suitable benchmarks

Once you know how you’re going to profile you need some good workloads. You could use the compiler itself, but it’s big and complicated and reasoning about the various stages can be confusing, so I have avoided that myself.

Instead, I have focused entirely on rustc-benchmarks, a pre-existing rustc benchmark suite. It contains 13 benchmarks of various sizes. It has been used to track rustc’s performance at perf.rust-lang.org for some time, but it wasn’t easy to use locally until I wrote a script for that purpose. I invoke it something like this:

./compare.py \
  /home/njn/moz/rust0/x86_64-unknown-linux-gnu/stage1/bin/rustc \
  /home/njn/moz/rust1/x86_64-unknown-linux-gnu/stage1/bin/rustc

It compares the two given compilers, doing debug builds, on the benchmarks See the next section for example output. If you want to run a subset of the benchmarks you can specify them as additional arguments.

Each benchmark in rustc-benchmarks has a makefile with three targets. See the README for details on these targets, which can be helpful.

Wins

Here are the results if I compare the following two versions of rustc with compare.py.

  • The commit just before my first commit (on September 12).
  • A commit from October 13.
futures-rs-test  5.028s vs  4.433s --> 1.134x faster (variance: 1.020x, 1.030x)
helloworld       0.283s vs  0.235s --> 1.202x faster (variance: 1.012x, 1.025x)
html5ever-2016-  6.293s vs  5.652s --> 1.113x faster (variance: 1.011x, 1.008x)
hyper.0.5.0      6.182s vs  5.039s --> 1.227x faster (variance: 1.002x, 1.018x)
inflate-0.1.0    5.168s vs  4.935s --> 1.047x faster (variance: 1.001x, 1.002x)
issue-32062-equ  0.457s vs  0.347s --> 1.316x faster (variance: 1.010x, 1.007x)
issue-32278-big  2.046s vs  1.706s --> 1.199x faster (variance: 1.003x, 1.007x)
jld-day15-parse  1.793s vs  1.538s --> 1.166x faster (variance: 1.059x, 1.020x)
piston-image-0. 13.871s vs 11.885s --> 1.167x faster (variance: 1.005x, 1.005x)
regex.0.1.30     2.937s vs  2.516s --> 1.167x faster (variance: 1.010x, 1.002x)
rust-encoding-0  2.414s vs  2.078s --> 1.162x faster (variance: 1.006x, 1.005x)
syntex-0.42.2   36.526s vs 32.373s --> 1.128x faster (variance: 1.003x, 1.004x)
syntex-0.42.2-i 21.500s vs 17.916s --> 1.200x faster (variance: 1.007x, 1.013x)

Not all of the improvement is due to my changes, but I have managed a few nice wins, including the following.

#36592: There is an arena allocator called TypedArena. rustc creates many of these, mostly short-lived. On creation, each arena would allocate a 4096 byte chunk, in preparation for the first arena allocation request. But DHAT’s output showed me that the vast majority of arenas never received such a request! So I made TypedArena lazy — the first chunk is now only allocated when necessary. This reduced the number of calls to malloc greatly, which sped up compilation of several rustc-benchmarks by 2–6%.

#36734: This one was similar. Rust’s HashMap implementation is lazy — it doesn’t allocate any memory for elements until the first one is inserted. This is a good thing because it’s surprisingly common in large programs to create HashMaps that are never used. However, Rust’s HashSet implementation (which is just a layer on top of the HashMap) didn’t have this property, and guess what? rustc also creates large numbers of HashSets that are never used. (Again, DHAT’s output made this obvious.) So I fixed that, which sped up compilation of several rustc-benchmarks by 1–4%. Even better, because this change is to Rust’s stdlib, rather than rustc itself, it will speed up any program that creates HashSets without using them.

#36917: This one involved avoiding some useless data structure manipulation when a particular table was empty. Again, DHAT pointed out a table that was created but never read, which was the clue I needed to identify this improvement. This sped up two benchmarks by 16% and a couple of others by 3–5%.

#37064: This one changed a hot function in serialization code to return a Cow<str> instead of a String, which avoided a lot of allocations.

Future work

Profiles indicate that the following parts of the compiler account for a lot of its runtime.

  • malloc and free are still the two hottest functions in most benchmarks. Avoiding heap allocations can be a win.
  • Compression is used for crate metadata and LLVM bitcode. (This shows up in profiles under a function called tdefl_compress.)  There is an issue open about this.
  • Hash table operations are hot. A lot of this comes from the interning of various values during type checking; see the CtxtInterners type for details.
  • Crate metadata decoding is also costly.
  • LLVM execution is a big chunk, especially when doing optimized builds. So far I have treated LLVM as a black box and haven’t tried to change it, at least partly because I don’t know how to build it with debug info, which is necessary to get source files and line numbers in profiles. [Update: there is a new –enable-llvm-release-debuginfo configure option that causes LLVM to be build with debug info.]

A lot of programs have broadly similar profiles, but occasionally you get an odd one that stresses a different part of the compiler. For example, in rustc-benchmarks, inflate-0.1.0 is dominated by operations involving the (delighfully named) ObligationsForest (see #36993), and html5ever-2016-08-25 is dominated by what I think is macro processing. So it’s worth profiling the compiler on new codebases.

Caveat lector

I’m still a newcomer to Rust development. Although I’ve had lots of help on the #rustc IRC channel — big thanks to eddyb and simulacrum in particular — there may be things I am doing wrong or sub-optimally. Nonetheless, I hope this is a useful starting point for newcomers who want to speed up the Rust compiler.
Categories
DMD Firefox Memory allocation MemShrink Performance

Cumulative heap profiling in Firefox with DMD

DMD is a tool that I originally created to help identify where new memory reporters should be added to Firefox in order to reduce the “heap-unclassified” measurement in about:memory. (The name is actually short for “Dark Matter Detector”, because we sometimes call the “heap-unclassified” measurement “dark matter“.)

Recently, I’ve modified DMD to become a more general heap profiling tool. It now has three distinct modes of operation.

  1. “Dark matter”: this mode gives you DMD’s original behaviour.
  2. “Live”: this mode tracks all the live blocks on the system heap, and lets you take snapshots at particular points in time.
  3. Cumulative“: this mode tracks all the blocks that have ever been allocated on the system heap, and so gives you information about all the allocations done by Firefox during an entire session.

Most memory profilers (including as about:memory) are snapshot-based, and so work much like DMD’s “live” mode. But “cumulative” mode is equally interesting.

In particular, unlike “live” mode, “cumulative” mode tells you about parts of the code that are responsible for allocating many short-lived heap blocks (sometimes called “heap churn”). Such allocations can hurt performance: allocations and deallocations themselves aren’t free, particularly because they require obtaining a global lock; such code often involves unnecessary initialization or copying of heap data; and if these allocations come in a variety of sizes they can cause additional heap fragmentation.

Another nice thing about cumulative heap profiling is that, unlike live heap profiling, you don’t have to decide when to take snapshots. You can just profile an entire workload of interest and get the results at the end.

I’ve used DMD’s cumulative mode to find inefficiencies in SpiderMonkey’s source compression  and code generation, SQLite, NSS, nsTArray, XDR encoding, Gnome start-up, IPC messaging, nsStreamLoader, cycle collection, and safe-browsing. There are “start doing something clever” optimizations and then there are “stop doing something stupid” optimizations, and every one of these fixes has been one of the latter. Each change has avoided cumulative heap allocations ranging from tens to thousands of MiBs.

It’s typically difficult to quantify any speed-ups from these changes, because the workloads are noisy and non-deterministic, but I’m convinced that simple changes to fix these issues are worthwhile. For one, I used cumulative profiling (via a different tool) to drive the major improvements I made to pdf.js earlier this year. Also, Chrome developers have found that “Chrome in general is *very* close to the threshold where heap lock contention causes noticeable UI lag”.

So far I have only profiled a few simple workloads. There are all sorts of things I haven’t tried: text-heavy pages, image-heavy pages, audio and video, WebRTC, WebGL, popular benchmarks… the list goes on. I intend to do more profiling and fix things where I can, but it would be great to have help from domain experts with this stuff. If you want to try out cumulative heap profiling in Firefox, please read the DMD instructions and feel free to ask me for help. In particular, I now have a good feel for which hot allocations are unavoidable and reasonable — plenty of them, of course — and which are avoidable. Let’s get rid of the avoidable ones.

Categories
about:memory Firefox Memory allocation Memory consumption MemShrink Performance

Better documentation for memory profiling and leak detection tools

Until recently, the documentation for all of Mozilla’s memory profiling and leak detection tools had some major problems.

  • It was scattered across MDN, the Mozilla Wiki, and the Mozilla archive site (yes, really).
  • Documentation for several tools was spread across multiple pages.
  • Documentation for some tools was meagre, non-existent, or overly verbose.
  • Some of the documentation was out of date, e.g. describing tools that no longer exist.

A little while back I fixed these problems.

  • The documentation for these tools is now all on MDN. If you look at the MDN Performance page in the “Memory profiling and leak detection tools” section, you’ll see a brief description of each tool that explains the circumstances in which it is useful, and a link to the relevant documentation.
  • The full list of documented tools includes: about:memory, DMD, areweslimyet.com, BloatView, Refcount tracing and balancing, GC and CC logs, Valgrind, LeakSanitizer, Apple tools, TraceMalloc, Leak Gauge, and LogAlloc.
  • As well as consolidating all the pages in one place, I also improved some of the pages (with the help of people like Andrew McCreight). In particular, about:memory now has reasonably detailed documentation, something it has lacked until now.

Please take a look, and if you see any problems let me know. Or, if you’re feeling confident just fix things yourself! Thanks.

Categories
Firefox Performance Tracking Protection

Quantifying the effects of Firefox’s Tracking Protection

A number of people at Mozilla are working on a wonderful privacy initiative called Polaris. This will include activities such as Mozilla hosting its own high-capacity Tor middle relays.

But the part of Polaris I’m most interested in is Tracking Protection, which is a Firefox feature that will make it trivial for users to avoid many forms of online tracking. This not only gives users better privacy; experiments have shown it also speeds up the loading of the median page by 20%! That’s an incredible combination.

An experiment

I decided to evaluate the effectiveness of Tracking Protection. To do this, I used Lightbeam, a Firefox extension designed specifically to record third-party tracking. On November 2nd, I used a trunk build of the mozilla-inbound repository and did the following steps.

  • Start Firefox with a new profile.
  • Install Lightbeam from addons.mozilla.org.
  • Visit the following sites, but don’t interact with them at all:
    1. google.com
    2. techcrunch.com
    3. dictionary.com (which redirected to dictionary.reference.com)
    4. nytimes.com
    5. cnn.com
  • Open Lightbeam in a tab, and go to the “List” view.

I then repeated these steps, but before visiting the sites I added the following step.

  • Open about:config and toggle privacy.trackingprotection.enabled to
    “true”.

Results with Tracking Protection turned off

The sites I visited directly are marked as “Visited”. All the third-party sites are marked as “Third Party”.

Connected with 86 sites

Type            Website                Sites Connected
----            -------                ---------------
Visited         google.com              3
Third Party     gstatic.com             5
Visited         techcrunch.com         25
Third Party     aolcdn.com              1
Third Party     wp.com                  1
Third Party     gravatar.com            1
Third Party     wordpress.com           1
Third Party     twitter.com             4
Third Party     google-analytics.com    3
Third Party     scorecardresearch.com   6
Third Party     aol.com                 1
Third Party     questionmarket.com      1
Third Party     grvcdn.com              1
Third Party     korrelate.net           1
Third Party     livefyre.com            1
Third Party     gravity.com             1
Third Party     facebook.net            1
Third Party     adsonar.com             1
Third Party     facebook.com            4
Third Party     atwola.com              4
Third Party     adtech.de               1
Third Party     goviral-content.com     7
Third Party     amgdgt.com              1
Third Party     srvntrk.com             2
Third Party     voicefive.com           1
Third Party     bluekai.com             1
Third Party     truste.com              2
Third Party     advertising.com         2
Third Party     youtube.com             1
Third Party     ytimg.com               1
Third Party     5min.com                1
Third Party     tacoda.net              1
Third Party     adadvisor.net           2
Third Party     dictionary.com          1
Visited         reference.com          32
Third Party     sfdict.com              1
Third Party     amazon-adsystem.com     1
Third Party     thesaurus.com           1
Third Party     quantserve.com          1
Third Party     googletagservices.com   1
Third Party     googleadservices.com    1
Third Party     googlesyndication.com   3
Third Party     imrworldwide.com        3
Third Party     doubleclick.net         5
Third Party     legolas-media.com       1
Third Party     googleusercontent.com   1
Third Party     exponential.com         1
Third Party     twimg.com               1
Third Party     tribalfusion.com        2
Third Party     technoratimedia.com     2
Third Party     chango.com              1
Third Party     adsrvr.org              1
Third Party     exelator.com            1
Third Party     adnxs.com               1
Third Party     securepaths.com         1
Third Party     casalemedia.com         2
Third Party     pubmatic.com            1
Third Party     contextweb.com          1
Third Party     yahoo.com               1
Third Party     openx.net               1
Third Party     rubiconproject.com      2
Third Party     adtechus.com            1
Third Party     load.s3.amazonaws.com   1
Third Party     fonts.googleapis.com    2
Visited         nytimes.com            21
Third Party     nyt.com                 2
Third Party     typekit.net             1
Third Party     newrelic.com            1
Third Party     moatads.com             2
Third Party     krxd.net                2
Third Party     dynamicyield.com        2
Third Party     bizographics.com        1
Third Party     rfihub.com              1
Third Party     ru4.com                 1
Third Party     chartbeat.com           1
Third Party     ixiaa.com               1
Third Party     revsci.net              1
Third Party     chartbeat.net           2
Third Party     agkn.com                1
Visited         cnn.com                14
Third Party     turner.com              1
Third Party     optimizely.com          1
Third Party     ugdturner.com           1
Third Party     akamaihd.net            1
Third Party     visualrevenue.com       1
Third Party     batpmturner.com         1

Results with Tracking Protection turned on

Connected with 33 sites

Visited         google.com              3
Third Party     google.com.au           0
Third Party     gstatic.com             1
Visited         techcrunch.com         12
Third Party     aolcdn.com              1
Third Party     wp.com                  1
Third Party     wordpress.com           1
Third Party     gravatar.com            1
Third Party     twitter.com             4
Third Party     grvcdn.com              1
Third Party     korrelate.net           1
Third Party     livefyre.com            1
Third Party     gravity.com             1
Third Party     facebook.net            1
Third Party     aol.com                 1
Third Party     facebook.com            3
Third Party     dictionary.com          1
Visited         reference.com           5
Third Party     sfdict.com              1
Third Party     thesaurus.com           1
Third Party     googleusercontent.com   1
Third Party     twimg.com               1
Visited         nytimes.com             3
Third Party     nyt.com                 2
Third Party     typekit.net             1
Third Party     dynamicyield.com        2
Visited         cnn.com                 7
Third Party     turner.com              1
Third Party     optimizely.com          1
Third Party     ugdturner.com           1
Third Party     akamaihd.net            1
Third Party     visualrevenue.com       1
Third Party     truste.com              1

 Discussion

86 site connections were reduced to 33. No wonder it’s a performance improvement as well as a privacy improvement. The only effect I could see on content was that some ads on some of the sites weren’t shown; all the primary site content was still present.

google.com was the only site that didn’t trigger Tracking Protection (i.e. the shield icon didn’t appear in the address bar).

The results are quite variable. When I repeated the experiment the number of third-party sites without Tracking Protection was sometimes as low as 55, and with Tracking Protection it was sometimes as low as 21. I’m not entirely sure what causes the variation.

If you want to try this experiment yourself, note that Lightbeam was broken by a recent change. If you are using mozilla-inbound, revision db8ff9116376 is the one immediate preceding the breakage. Hopefully this will be fixed soon. I also found Lightbeam’s graph view to be unreliable. And note that the privacy.trackingprotection.enabled preference was recently renamed browser.polaris.enabled. [Update: that is not quite right; Monica Chew has clarified the preferences situation in the comments below.]

Finally, Tracking Protection is under active development, and I’m not sure which version of Firefox it will ship in. In the meantime, if you want to try it out, get a copy of Nightly and follow these instructions.

Categories
Firefox Garbage Collection Google Chrome Memory consumption MemShrink Opera Performance

How to Compare the Memory Efficiency of Web Browsers

TL;DR: Cross-browser comparisons of memory consumption should be avoided.  If you want to evaluate how efficiently browsers use memory, you should do cross-browser comparisons of performance across several machines featuring a range of memory configurations.

Cross-browser Memory Comparisons are Bad

Various tech sites periodically compare the performance of browsers.  These often involve some cross-browser comparisons of memory efficiency.  A typical one would be this:  open a bunch of pages in tabs, measure memory consumption, then close all of them except one and wait two minutes, and then measure memory consumption again.  Users sometimes do similar testing.

I think comparisons of memory consumption like these are (a) very difficult to make correctly, and (b) very difficult to interpret meaningfully.  I have suggestions below for alternative ways to measure memory efficiency of browsers, but first I’ll explain why I think these comparisons are a bad idea.

Cross-browser Memory Comparisons are Difficult to Make

Getting apples-to-apples comparisons are really difficult.

  1. Browser memory measurements aren’t easy.  In particular, all browsers use multiple processes, and accounting for shared memory is difficult.
  2. Browsers are non-deterministic programs, and this can cause wide variation in memory consumption results.  In particular, whether or not the JavaScript garbage collector runs can greatly reduce memory consumption.  If you get unlucky and the garbage collector runs just after you measure, you’ll get an unfairly high number.
  3. Browsers can exhibit adaptive memory behaviour.  If running on a machine with lots of free RAM, a browser may choose to take advantage of it;  if running on a machine with little free RAM, a browser may choose to discard regenerable data more aggressively.

If you are comparing two versions of the same browser, problems (1) and (3) are avoided, and so if you are careful with problem (2) you can get reasonable results.  But comparing different browsers hits all three problems.

Indeed, Tom’s Hardware de-emphasized memory consumption measurements in their latest Web Browser Grand Prix due to problem (3).  Kudos to them!

Cross-browser Memory Comparisons are Difficult to Interpret

Even if you could get the measurements right, memory consumption is still not a good thing to compare.  Before I can explain why, I’ll introduce a couple of terms.

  • A primary metric is one a user can directly perceive.  Metrics that measure performance and crash rate are good examples.
  • A secondary metric is one that a user can only indirectly perceive via some kind of tool.  Memory consumption is one example.  The L2 cache miss rate is another example.

(I made up these terms, I don’t know if there are existing terms for these concepts.)

Primary metrics are obviously important, precisely because user can detect them.  They measure things that users notice:  “this browser is fast/slow”, “this browser crashes all the time”, etc.

Secondary metrics are important because they can affect primary metrics:  memory consumption can affect performance and crash rate;  the L2 cache miss rate can affect performance.

Secondary metrics are also difficult to interpret.  They can certainly be suggestive, but there are lots of secondary metrics that affect each primary metric of interest, so focusing too strongly on any single secondary metric is not a good idea.  For example, if browser A has a higher L2 cache miss rate than browser B, that’s suggestive, but you’d be unwise to draw any strong conclusions from it.

Furthermore, memory consumption is harder to interpret than many other secondary metrics.  If all else is equal, a higher L2 cache miss rate is worse than a lower one.  But that’s not true for memory consumption.  There are all sorts of time/space trade-offs that can be made, and there are many cases where using more memory can make browsers faster;  JavaScript JITs are a great example.

And I haven’t even discussed which memory consumption metric you should use.  Physical memory consumption is an obvious choice, but I’ll discuss this more below.

A Better Methodology

So, I’ve explained why I think you shouldn’t do cross-browser memory comparisons.  That doesn’t mean that efficient usage of memory isn’t important! However, instead of directly measuring memory consumption — a secondary metric — it’s far better to measure the effect of memory consumption on primary metrics such as performance.

In particular, I think people often use memory consumption measurements as a proxy for performance on machines that don’t have much RAM.  If you care about performance on machines that don’t have much RAM, you should measure performance on a machine that doesn’t have much RAM instead of trying to infer it from another measurement.

Experimental Setup

I did exactly this by doing something I call memory sensitivity testing, which involves measuring browser performance across a range of memory configurations.  My test machine had the following characteristics.

  • CPU: Intel i7-2600 3.4GHz (quad core with hyperthreading)
  • RAM: 16GB DDR3
  • OS: Ubuntu 11.10, Linux kernel version 3.0.0.

I used a Linux machine because Linux has a feature called cgroups that allows you to restrict the machine resources available to one or more processes.  I followed Justin Lebar’s instructions to create the following configurations that limited the amount of physical memory available: 1024MiB, 768MiB, 512MiB, 448MiB, 384MiB, 320MiB, 256MiB, 192MiB, 160MiB, 128MiB, 96MiB, 64MiB, 48MiB, 32MiB.

(The more obvious way to do this is to use ulimit, but as far as I can tell it doesn’t work on recent versions of Linux or on Mac.  And I don’t know of any way to do this on Windows.  So my experiments had to be on Linux.)

I used the following browsers.

  • Firefox 12 Nightly, from 2012-01-10 (64-bit)
  • Firefox 9.0.1 (64-bit)
  • Chrome 16.0.912.75 (64-bit)
  • Opera 11.60 (64-bit)

IE and Safari aren’t represented because they don’t run on Linux.  Firefox is over-represented because that’s the browser I work on and care about the most 🙂  The versions are a bit old because I did this testing about six months ago.

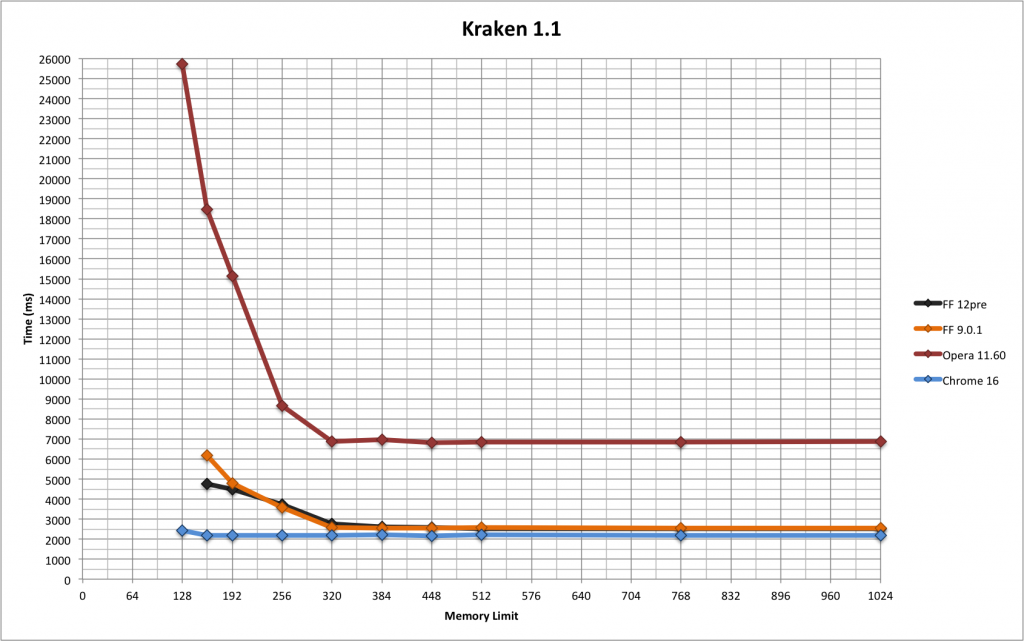
I used the following benchmark suites:  Sunspider v0.9.1, V8 v6, Kraken v1.1.  These are all JavaScript benchmarks and are all awful for gauging a browser’s memory efficiency;  but they have the key advantage that they run quite quickly.  I thought about using Dromaeo and Peacekeeper to benchmark other aspects of browser performance, but they take several minutes each to run and I didn’t have the patience to run them a large number of times.  This isn’t ideal, but I did this exercise to test-drive a benchmarking methodology, not make a definitive statement about each browser’s memory efficiency, so please forgive me.

Experimental Results

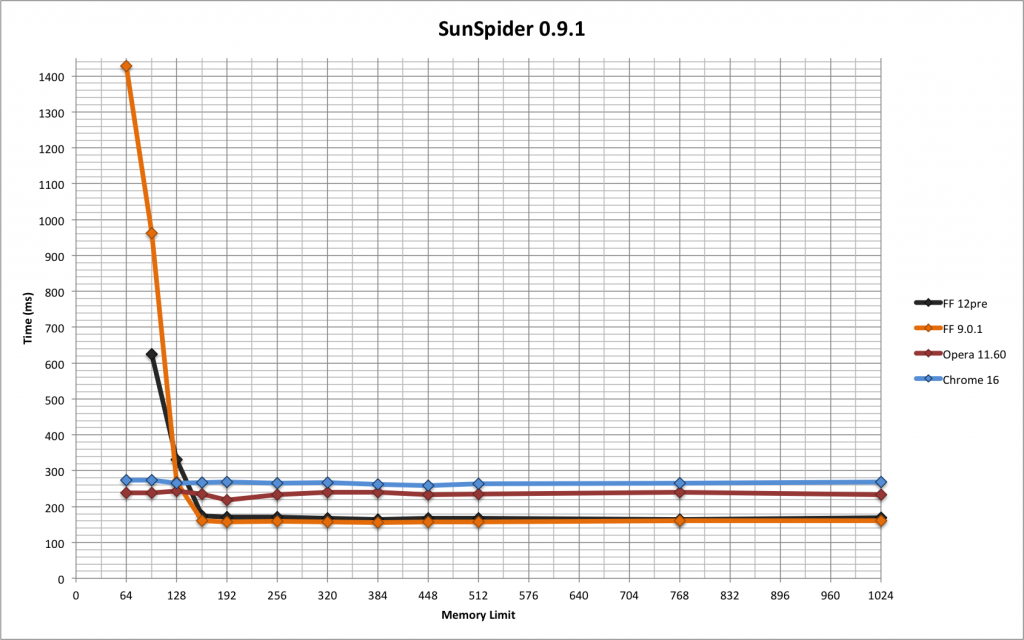
The following graph shows the Sunspider results.  (Click on it to get a larger version.)

sunspider results graph

As the lines move from right to left, the amount of physical memory available drops.  Firefox was clearly the fastest in most configurations, with only minor differences between Firefox 9 and Firefox 12pre, but it slowed down drastically below 160MiB;  this is exactly the kind of curve I was expecting.  Opera was next fastest in most configurations, and then Chrome, and both of them didn’t show any noticeable degradation at any memory size, which was surprising and impressive.

All the browsers crashed/aborted if memory was reduced enough.  The point at which the graphs stop on the left-hand side indicate the lowest size that each browser successfully handled.  None of the browsers ran Sunspider with 48MiB available, and FF12pre failed to run it with 64MiB available.

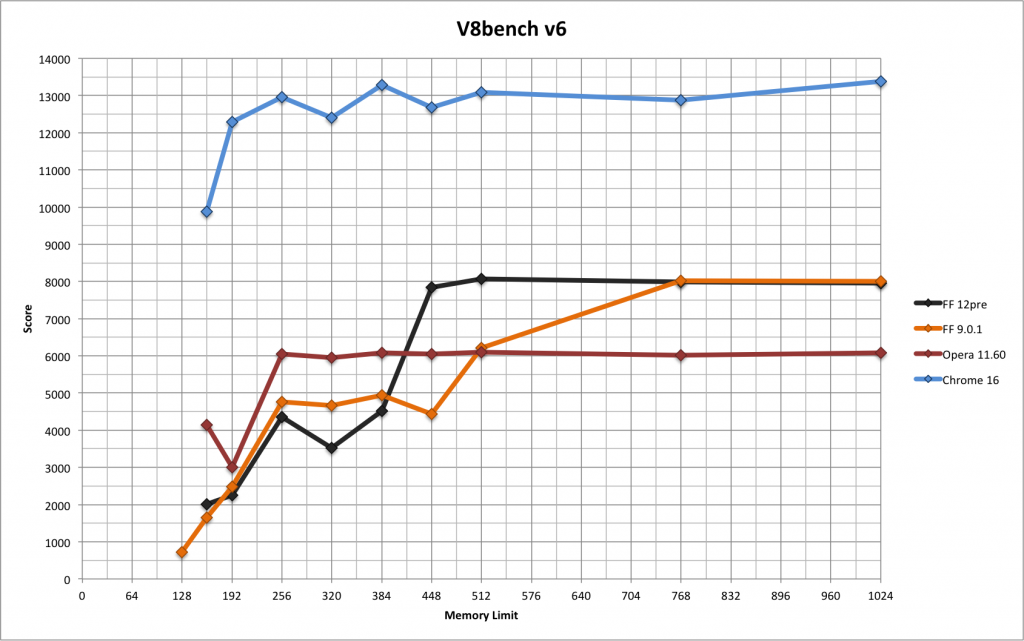
The next graph shows the V8 results.

v8 results graph

The curves go the opposite way because V8 produces a score rather than a time, and bigger is better.  Chrome easily got the best scores.  Both Firefox versions degraded significantly.  Chrome and Opera degraded somewhat, and only at lower sizes.  Oddly enough, FF9 was the only browser that managed to run V8 with 128MiB available;  the other three only ran it with 160MiB or more available.

I don’t particularly like V8 as a benchmark.  I’ve always found that it doesn’t give consistent results if you run it multiple times, and these results concur with that observation.  Furthermore, I don’t like that it gives a score rather than a time or inverse-time (such as runs per second), because it’s unclear how different scores relate.

The final graph shows the Kraken results.

kraken results graph

As with Sunspider, Chrome barely degraded and both Firefoxes degraded significantly.  Opera was easily the slowest to begin with and degraded massively;  nonetheless, it managed to run with 128MiB available (as did Chrome), which neither Firefox managed.

Experimental Conclusions

Overall, Chrome did well, and Opera and the two Firefoxes had mixed results. But I did this experiment to test a methodology, not to crown a winner.  (And don’t forget that these experiments were done with browser versions that are now over six months old.)  My main conclusion is that Sunspider, V8 and Kraken are not good benchmarks when it comes to gauging how efficiently browsers use memory.  For example, none of the browsers slowed down on Sunspider until memory was restricted to 128MiB, which is a ridiculously small amount of memory for a desktop or laptop machine;  it’s small even for a smartphone.  V8 is clearly stresses memory consumption more, but it’s still not great.

What would a better benchmark look like?  I’m not completely sure, but it would certainly involve opening multiple tabs and simulate real-world browsing. Something like Membench (see here and here) might be a reasonable starting point.  To test the impact of memory consumption on performance, a clear performance measure would be required, because Membench lacks one currently.  To test the impact of memory consumption on crash rate, Membench could be modified to just keep opening pages until the browser crashes.  (The trouble with that is that you’d lose your count when the browser crashed!  You’d need to log the current count to a file or something like that.)

BTW, if you are thinking “you’ve just measured the working set size“, you’re exactly right! I think working set size is probably the best metric to use when evaluating memory consumption of a browser.  Unfortunately it’s hard to measure (as we’ve seen) and it is best measured via a  curve rather than a single number.

 A Simpler Methodology

I think memory sensitivity testing is an excellent way to gauge the memory efficiency of different browsers.  (In fact, the same methodology can be used for any kind of program, not just browsers.)

But the above experiment wasn’t easy:  it required a Linux machine, some non-trivial configuration of that machine that took me a while to get working, and at least 13 runs of each benchmark suite for each browser.  I understand that tech sites would be reluctant to do this kind of testing, especially when longer-running benchmark suites such as Dromaeo and Peacekeeper are involved.

A simpler alternative that would still be quite good would be to perform all the performance tests on several machines with different memory configurations.  For example, a good experimental setup might involve the following machines.

  • A fast desktop with 8GB or 16GB of RAM.
  • A mid-range laptop with 4GB of RAM.
  • A low-end netbook with 1GB or even 512MB of RAM.

This wouldn’t require nearly as many runs as full-scale memory sensitivity testing would.  It would avoid all the problems of cross-browser memory consumption comparisons:  difficult measurements, non-determinism, and adaptive behaviour.  It would avoid secondary metrics in favour of primary metrics.  And it would give results that are easy for anyone to understand.

(In some ways it’s even better than memory sensitivity testing because it involves real machines — a machine with a 3.4GHz i7-2600 CPU and only 128MiB of RAM isn’t a realistic configuration!)

I’d love it if tech sites started doing this.

Categories
about:compartments about:memory add-ons Firefox Garbage Collection Memory consumption MemShrink Performance

MemShrink progress, week 51-52

Memory Reporting

Nathan Froyd added much more detail to the DOM and layout memory reporters, as the following example shows.

├──3,268,944 B (03.76%) -- window(http://www.reddit.com/)
│  ├──1,419,280 B (01.63%) -- layout
│  │  ├────403,904 B (00.46%) ── style-sets
│  │  ├────285,856 B (00.33%) -- frames
│  │  │    ├───90,000 B (00.10%) ── nsInlineFrame
│  │  │    ├───72,656 B (00.08%) ── nsBlockFrame
│  │  │    ├───62,496 B (00.07%) ── nsTextFrame
│  │  │    ├───42,672 B (00.05%) ── nsHTMLScrollFrame
│  │  │    └───18,032 B (00.02%) ── sundries
│  │  ├────259,392 B (00.30%) ── pres-shell
│  │  ├────168,480 B (00.19%) ── style-contexts
│  │  ├────160,176 B (00.18%) ── pres-contexts
│  │  ├─────55,424 B (00.06%) ── text-runs
│  │  ├─────45,792 B (00.05%) ── rule-nodes
│  │  └─────40,256 B (00.05%) ── line-boxes
│  ├────986,240 B (01.13%) -- dom
│  │    ├──780,056 B (00.90%) ── element-nodes
│  │    ├──156,184 B (00.18%) ── text-nodes
│  │    ├───39,936 B (00.05%) ── other [2]
│  │    └───10,064 B (00.01%) ── comment-nodes
│  └────863,424 B (00.99%) ── style-sheets

Although these changes slightly improved the coverage of the reporters (i.e. they reduce “heap-unclassified” a bit), the more important effect is that they give greater insight into DOM and layout memory consumption.  [Update:  Nathan blogged about these changes.]

I modified the memory reporter infrastructure and about:memory to allow trees of measurements to be shown in the “Other Measurements” section of about:memory.  The following excerpt shows two sets of measurements that were previously shown in a flat list.

108 (100.0%) -- js-compartments
├──102 (94.44%) ── system
└────6 (05.56%) ── user

3,900,832 B (100.0%) -- window-objects
├──2,047,712 B (52.49%) -- layout
│  ├──1,436,464 B (36.82%) ── style-sets
│  ├────402,056 B (10.31%) ── pres-shell
│  ├────100,440 B (02.57%) ── rule-nodes
│  ├─────62,400 B (01.60%) ── style-contexts
│  ├─────30,464 B (00.78%) ── pres-contexts
│  ├─────10,400 B (00.27%) ── frames
│  ├──────2,816 B (00.07%) ── line-boxes
│  └──────2,672 B (00.07%) ── text-runs
├──1,399,904 B (35.89%) ── style-sheets
└────453,216 B (11.62%) -- dom
     ├──319,648 B (08.19%) ── element-nodes
     ├──123,088 B (03.16%) ── other
     ├────8,880 B (00.23%) ── text-nodes
     ├────1,600 B (00.04%) ── comment-nodes
     └────────0 B (00.00%) ── cdata-nodes

This change improves the presentation of measurements that cross-cut those in the “explicit” tree.  I intend to modify a number of the JS engine memory reports to take advantage of this change.

One interesting bug was this one, where various people were seeing multiple compartments for the same site in about:compartments, as the following excerpt shows.

https://bugzilla.mozilla.org/
https://bugzilla.mozilla.org/, about:blank

It turns out this is not a bug.  The sites in question contain an empty iframe that doesn’t specify a URL, and so the memory reporters are doing exactly the right thing.  Still, a useful case to know about when reading about:compartments.

Add-ons

Justin Lebar fixed the FUEL API, which is used by numerous add-ons including Test Pilot and PDF.js, so that it doesn’t leak most of the objects it creates.  This leak caused 10+ minute shut-down times(!) for one user, so it’s a good one to have fixed.

Kyle Huey briefly broke his own Hueyfix, and then fixed it.  You had us worried for a bit there, Kyle!

asgerklasker fixed a leak in the HttpFox add-on that caused zombie compartments.

Miscellaneous

I restricted the amount of context that is shown in JavaScript error messages.  This fixed a longstanding bug where if you had enabled the javascript.options.strict option in about:config, and you had the error console open or Firebug installed, memory consumption would spike dramatically when viewing pages that contain JavaScript code that triggered many strict warnings.  This bug manifested rarely, but would bring Firefox to its knees when it did.

Asaf Romano fixed a leak that caused a zombie compartment if you used the “Highlight All” checkbox when doing a text search in a page.

Mike Hommey finished importing the new version of jemalloc into the Mozilla codebase, and then wrote about it.  The new version is currently disabled, but we hope to turn it on soon.  Preliminary experiments indicate that the new version is unlikely to affect performance or memory consumption much.  However, it will be good to be on a version that is in sync with the upstream version, instead of having a highly hacked Mozilla-specific version.

Justin Lebar wrote a nice blog post explaining what “ghost windows” are, and how we’ve used them to gauge some recent leak fixes.

Till Schneidereit fixed a garbage collection defect that could cause memory usage to spike in certain cases involving Firefox Sync.

LifeHacker published a new browser performance comparison which looked at Firefox 13, Chrome 19, IE9, and Opera 11.64.  Firefox did the best overall and also won both the memory consumption tests.  I personally take these kinds of comparisons with a huge bucket of salt.  Indeed, quoting from the article:

Our tests aren’t the most scientific on the planet, but they do reflect a relatively accurate view of the kind of experience you’d get from each browser, speed-wise.

If you ask me, the text before the “but” contradicts the rest of the sentence.  What I found more interesting was the distinct lack of “lolwut everyone knows Chrome is faster than Firefox” comments, which I’m used to seeing when Firefox does well in these kinds of articles.

Bug Counts

Here are the current bug counts.

  • P1: 25 (-1/+3)
  • P2: 88 (-3/+6)
  • P3: 106 (-0/+4)
  • Unprioritized: 2 (-2/+2)

Nothing too exciting there.

Categories
about:memory AdBlock Plus add-ons compartments DMD Firefox Garbage Collection JägerMonkey Massif Memory allocation Memory consumption MemShrink Performance SQLite Talks Valgrind

Notes on Reducing Firefox’s Memory Consumption

I gave a talk yesterday at the linux.conf.au Browser MiniConf, held in Ballarat, Australia.  Its title was “Notes On Reducing Firefox’s Memory Consumption”.

Below are the slides and notes in a SlideShare embedding. If you find that embedding problematic (some people do) you may prefer to download the PDF version directly.

Categories
Mercurial Performance

Speeding up Mercurial

Just a reminder:  Mercurial repository clones get slower over time.  It’s worth deleting and recloning every so often.

For example, I had one old repository that I’d done a lot of work in and updated many times.  It had a patch queue containing a single patch. I tried doing hg qdiff four times in a row. The first one took 65 seconds, and the next three each took 16 seconds.

I deleted the repository, re-cloned, re-applied the patch, and hg qdiff now takes 1 second. Much better.

Categories
Memory consumption MemShrink Performance

Building a page fault benchmark

I wrote a while ago about the importance of avoiding page faults for browser performance.  Despite this, I’ve been focusing specifically on reducing Firefox’s memory usage.  This is not a terrible thing;  page fault rates and memory usage are obviously strongly linked.  But they don’t have perfect correlation.  Not all memory reductions will have equal effect on page faults, and you can easily imagine changes that reduce page fault rates — by changing memory layout and access patterns — without reducing memory consumption.

A couple of days ago, Luke Wagner initiated an interesting email conversation with me about his desire for a page fault benchmark, and I want to write about some of the things we discussed.

It’s not obvious how to design a page fault benchmark, and to understand why I need to first talk about more typical time-based benchmarks like SunSpider.  SunSpider does the same amount of work every time it runs, and you want it to run as fast as possible.  It might take 200ms to run on your beefy desktop machine, 900ms on your netbook, and 2000ms to run on your smartphone.  In all cases, you have a useful baseline against which you can measure optimizations.  Also, any optimization that reduces the time on one device has a good chance of reducing time on the other devices.  The performance curve across devices is fairly flat.

In contrast, if you’re measuring page faults, these things probably won’t be true on a benchmark that does a constant amount of work.  If my desktop machine has 16GB of RAM, I’ll probably get close to zero page faults no matter what happens.  But on a smartphone with 512MB of RAM, the same benchmark may lead to a page fault death spiral;  the number will be enormous, assuming you even bother waiting for it to finish (or the OS doesn’t kill it).  And the netbook will probably lie unhelpfully on one side or the other of the cliff in the performance curve.  Such a benchmark will be of limited use.

However, maybe we can instead concoct a benchmark that repeats a sequence of interesting operations until a certain number of page faults have occurred.  The desktop machine might get 1000 operations, the netbook 400, the smartphone 100.  The performance curve is fairly flat again.

The operations should be representative of realistic browsing behaviour.  Obviously, the memory consumption has to increase each time you finish a sequence, but you don’t want to just open new pages.  A better sequence might look like “open foo.com in a new tab, follow some links, do some interaction, open three child pages, close two of them”.

And it would be interesting to run this test on a range of physical memory sizes, to emulate different machines such as smartphones, netbooks, desktops.  Fortunately, you can do this on Linux;  I’m not sure about other OSes.

I think a benchmark (or several benchmarks) like this would be challenging but not impossible to create.  It would be very valuable, because it measures a metric that directly affects users (page faults) rather than one that indirectly affects them (memory consumption).  It would be great to use as the workload under Julian Seward’s VM simulator, in order to find out which parts of the browser are causing page faults.  It might make areweslimyet.com catch managers’ eyes as much as arewefastyet.com does.  And finally, it would provide an interesting way to compare the memory “usage” (i.e. the stress put on the memory system) of different browsers, in contrast to comparisons of memory consumption which are difficult to interpret meaningfully.


Categories
Firefox Performance Uncategorized

Faster JavaScript parsing

Over the past year or so I’ve almost doubled the speed of SpiderMonkey’s JavaScript parser.  I did this by speeding up both the scanner (bug 564369, bug 584595, bug 588648, bug 639420, bug 645598) and the parser (bug 637549).  I used patch stacks in several of those bugs, and so in those six bugs I actually landed 28 changesets.

Notable things about scanning JavaScript code

Before I explain the changes I made, it will help to explain a few notable things about scanning JavaScript code.

  • JavaScript is encoded using UCS-2.  This means that each character is 16 bits.
  • There are several character sequences that indicate the end of a line (EOL): ‘\n’, ‘\r’, ‘\r\n’, \u2028 (a.k.a. LINE_SEPARATOR), and \u2029 (a.k.a. PARA_SEPARATOR).  Note that ‘\r\n’ is treated as a single character.
  • JavaScript code is often minified, and the characteristics of minified and non-minified code are quite different.  The most important difference is that minified code has much less whitespace.

Scanning improvements

Before I made any changes, there were two different modes in which the scanner could operate.  In the first mode, the entire character stream to be scanned was already in memory.  In the second, the scanner read the characters from a file in chunks a few thousand chars long.  Firefox always uses the first mode (except in the rare case where the platform doesn’t support mmap or an equivalent function), but the JavaScript shell used the second.  Supporting the second made made things complicated in two ways.

  • It was possible for an ‘\r\n’ EOL sequence to be split across two chunks, which required some extra checking code.
  • The scanner often needs to unget chars (up to six chars, due to the lookahead required for \uXXXX sequences), and it couldn’t unget chars across a chunk boundary.  This meant that it used a six-char unget buffer.  Every time a char was ungotten, it would be copied into this buffer.  As a consequence, every time it had to get a char, it first had to look in the unget buffer to see if there was one or more chars that had been previously ungotten.  This was an extra check (and a data-dependent and thus unpredictable check).

The first complication was easy to avoid by only reading N-1 chars into the chunk buffer, and only reading the Nth char in the ‘\r\n’ case.  But the second complication was harder to avoid with that design.  Instead, I just got rid of the second mode of operation;  if the JavaScript engine needs to read from file, it now reads the whole file into memory and then scans it via the first mode.  This can result in more memory being used but it only affects the shell, not the browser, so it was an acceptable change.  This allowed the unget buffer to be completely removed;  when a character is ungotten now the scanner just moves back one char in the char buffer being scanned.

Another improvement was that in the old code, there was an explicit EOL normalization step.  As each char was gotten from the memory buffer, the scanner would check if it was an EOL sequence;  if so it would change it to ‘\n’, if not, it would leave it unchanged.  Then it would copy this normalized char into another buffer, and scanning would proceed from this buffer.  (The way this copying worked was strange and confusing, to make things worse.)  I changed it so that getChar() would do the normalization without requiring the copy into the second buffer.

The scanner has to detect EOL sequences in order to know which line it is on.  At first glance, this requires checking every char to see if it’s an EOL, and the scanner uses a small look-up table to make this fast.  However, it turns out that you don’t have to check every char.  For example, once you know that you’re scanning an identifier, you know that if you hit an EOL sequence you’ll immediately unget it, because that marks the end of the identifier.  And when you unget that char you’ll undo the line update that you did when you hit the EOL.  This same logic applies in other situations (eg. parsing a number).  So I added a function getCharIgnoreEOL() that doesn’t do the EOL check.  It has to always be paired with ungetCharIgnoreEOL() and requires some care as to where it’s used, but it avoids the EOL check on more than half the scanned chars.

As well as detecting where each token starts and ends, for a lot of token kinds the scanner has to compute a value.  For example, after scanning the character sequence ” 123 ” it has to convert that to the number 123.  The old scanner would copy the chars into a temporary buffer before calling the function that did the conversion.  This was unnecessary — the conversion function didn’t even require NULL-terminated strings because it gets passed the length of the string being converted!  Also, the old scanner was using js_strtod() to do the number conversion.  js_strtod() can convert both integers and fractional numbers, but its quite slow and overkill for integers.  And when scanning, even before converting the string to a number, we know if the number we just scanned was an integer or not (by remembering if we saw a ‘.’ or exponent).  So now the scanner instead calls GetPrefixInteger() which is much faster.  Several of the tests in Kraken involve huge arrays of integers, and this made a big difference to them.

There’s a similar story with identifiers, but with an added complication.  Identifiers can contain \uXXXX chars, and these need to be normalized before we do more with the string inside SpiderMonkey.  So the scanner now remembers whether a \uXXXX char has occurred in an identifier.  If not, it can work directly (temporarily) with the copy of the string inside the char buffer.  Otherwise, the scanner will rescan the identifier, normalizing and copying it into a new buffer.  I.e. the scanner de-optimizes the (very) rare case in order to avoid the copying in the common case.

JavaScript supports decimal, hexadecimal and octal numbers.  The number-scanning code handled all three kinds in the same loop, which meant that it checked the radix every time it scanned another number char.  So I split this into three parts, which make it both faster and easier to read.

Although JavaScript chars are 16 bits, the vast majority of chars you see are in the first 128 chars.  This is true even for code written in non-Latin scripts, because of all the keywords (e.g. ‘var’) and operators (e.g. ‘+’) and punctuation (e.g. ‘;’).  So it’s worth optimizing for those.  The main scanning loop (in getTokenInternal()) now first checks every char to see if its value is greater than 128.  If so, it handles it in a side-path (the only legitimate such chars are whitespace, EOL or identifier chars, so that side-path is quite small).  The rest of getTokenInternal() can then assume that it’s a sub-128 char.  This meant I could be quite aggressive with look-up tables, because having lots of 128-entry look-up tables is fine, but having lots of 65,536-entry look-up tables would not be.  One particularly important look-up table is called firstCharKinds;  it tells you what kind of token you will have based on the first non-whitespace char in it.  For example, if the first char is a letter, it will be an identifier or keyword;  if the first char is a ‘0’ it will be a number;  and so on.

Another important look-up table is called oneCharTokens.  There are a handful of tokens that are one-char long, cannot form a valid prefix of another token, and don’t require any additional special handling:  ;,?[]{}().  These account for 35–45% of all tokens seen in real code!  The scanner can detect them immediately and use another look-up table to convert the token char to the internal token kind without any further tests.  After that, the rough order of frequency for different token kinds is as follows:  identifiers/keywords, ‘.’, ‘=’, strings, decimal numbers, ‘:’, ‘+’, hex/octal numbers, and then everything else.  The scanner now looks for these token kinds in that order.

That’s just a few of the improvements, there were lots of other little clean-ups.  While writing this post I looked at the old scanning code, as it was before I started changing it.  It was awful, it’s really hard to see what was happening;  getChar() was 150 lines long because it included code for reading the next chunk from file (if necessary) and also normalizing EOLs.

In comparison, as well as being much faster, the new code is much easier to read, and much more DFA-like.  It’s worth taking a look at getTokenInternal() in jsscan.cpp.

Parsing improvements

The parsing improvements were all related to the parsing of expressions.  When the parser parses an expression like “3” it needs to look for any following operators, such as “+”.  And there are roughly a dozen levels of operator precedence.  The way the parser did this was to get the next token, check if it matched any of the operators of a particular precedence, and then unget the token if it didn’t match.  It would then repeat these steps for the next precedence level, and so on.  So if there was no operator after the “3”, the parser would have gotten and ungotten the next token a dozen times!  Ungetting and regetting tokens is fast, because there’s a buffer used (i.e. you don’t rescan the token char by char) but it was still a bottleneck.  I changed it so that the sub-expression parsers were expected to parse one token past the end of the expression, instead of zero tokesn past the end.  This meant that the repeated getting/ungetting could be avoided.

These operator parsers are also very small.  I inlined them more aggressively, which also helped quite a bit.

Results

I had some timing results but now I can’t find them.  But I know that the overall speed-up from my changes was about 1.8x on Chris Leary’s parsemark suite, which takes code from lots of real sites, and the variation in parsing times for different codebases tends not to vary that much.

Many real websites, e.g. gmail, have MB of JS code, and this speed-up will probably save one or two tenths of a second when they load.  Not something you’d notice, but certainly something that’ll add up over time and help make the browser feel snappier.

Tools

I used Cachegrind to drive most of these changes.  It has two features that were crucial.

First, it does event-based profiling, i.e. it counts instructions, memory accesses, etc, rather than time.  When making a lot of very small improvements, noise variations often swamp the effects of the improvements, so being able to see that instruction counts are going down by 0.2% here, 0.3% there, is very helpful.

Second, it gives counts of these events for individual lines of source code.  This was particularly important for getTokenInternal(), which is the main scanning function and has around 700 lines;  function-level stats wouldn’t have been enough.