As the Perf-Tools team, we are responsible for the Firefox Profiler. This newsletter gives an overview of the new features and improvements we’ve done in Q4 2021.
You can find the previous newsletter here which was about the Q3 2021. With this newsletter, I will be writing about the things we’ve done in the Q4 2021. I hope you’ll enjoy the work that we’ve done this quarter.
Here are some highlights.
Source view for C++ / Rust code
Firefox Profiler is a great tool for providing performance analysis in relation to how long each function took. However, once a slow function is found, it is important to be able to dive in right away and figure out what is going on. Previously, it wasn’t possible to do this, but with this work, now you can see the source of C++ and Rust code in a view. All you need to do is to double click on a frame on Call Tree or Flame Graph panels. A new panel at the bottom will appear and show you the function you clicked. Here’s an example screenshot:
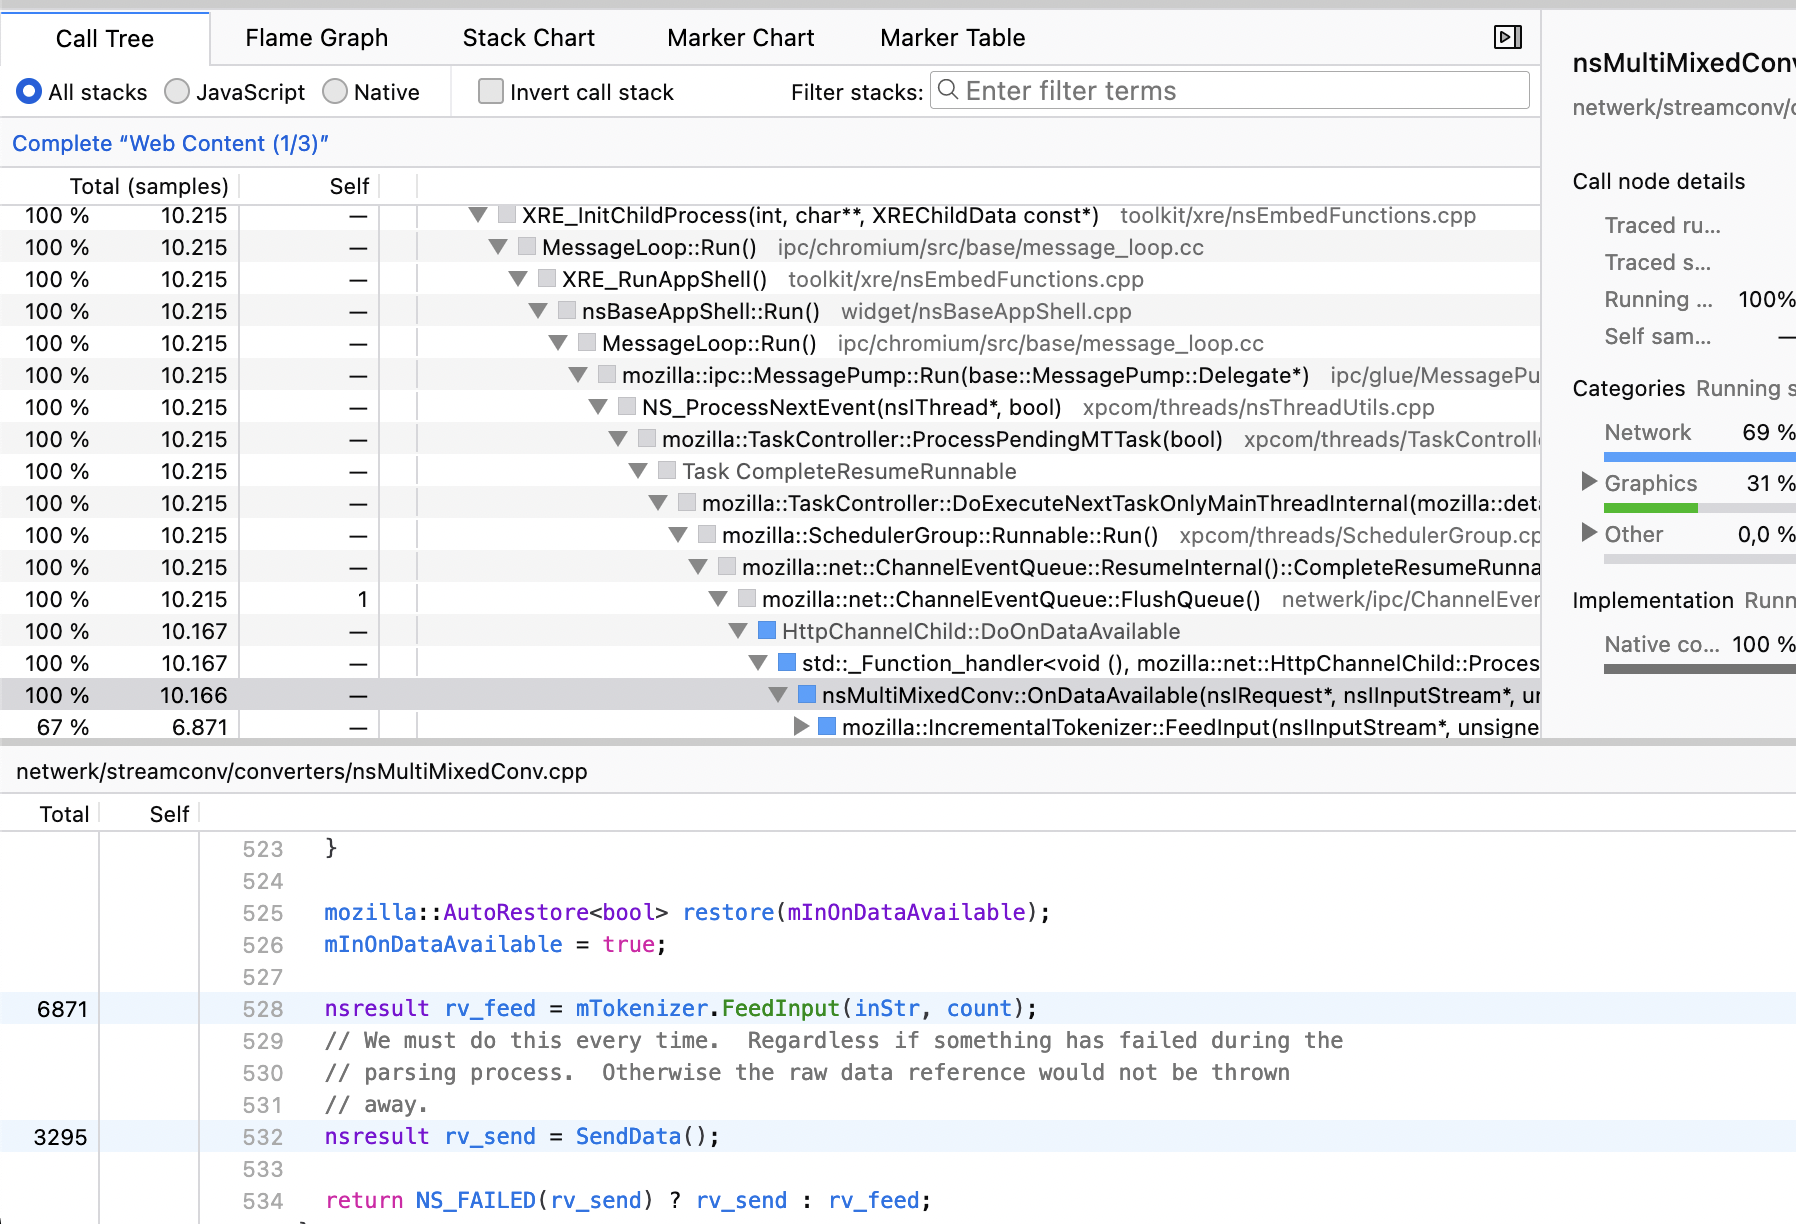 Also, here’s a link to an example profile if you are curious. This was tremendous work and it’s great that this can be used by our users now. I would like to thank Markus Stange especially for implementing this.
Support for inline call stacks
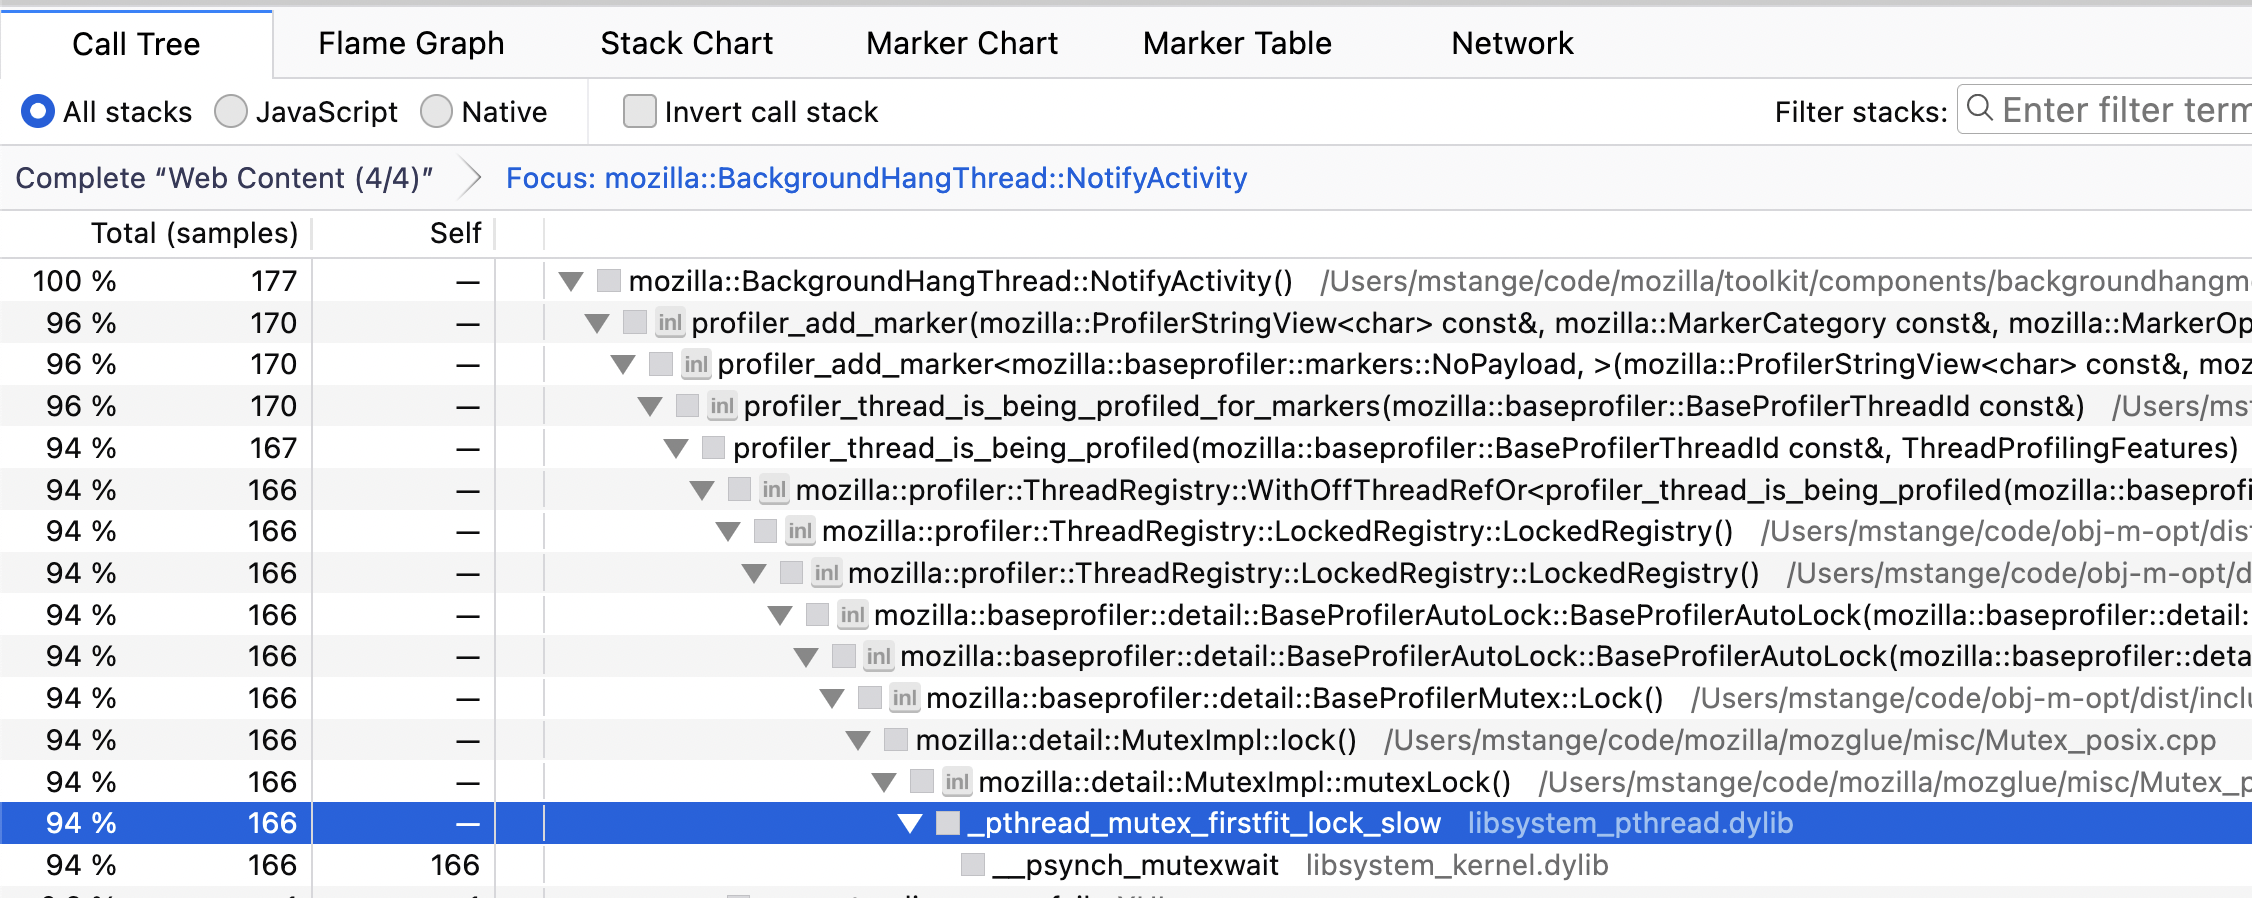
Whenever the compiler was inlining a function call away, we were completely losing information about the fact that it was that call that took up time, because we didn’t have inline stacks support. We only could see the time in the parent call node. This meant that we weren’t displaying the correct information to our users. Now with this work, we are not lying about the functions that take time anymore. It also displays an inline badge on the left side of a sample, so you can see that this function was inlined. Here’s an example profile link if you are curious. Currently it works for only local builds, but in the future it will work on official release channels as well.
 One click profiling in about:processes page

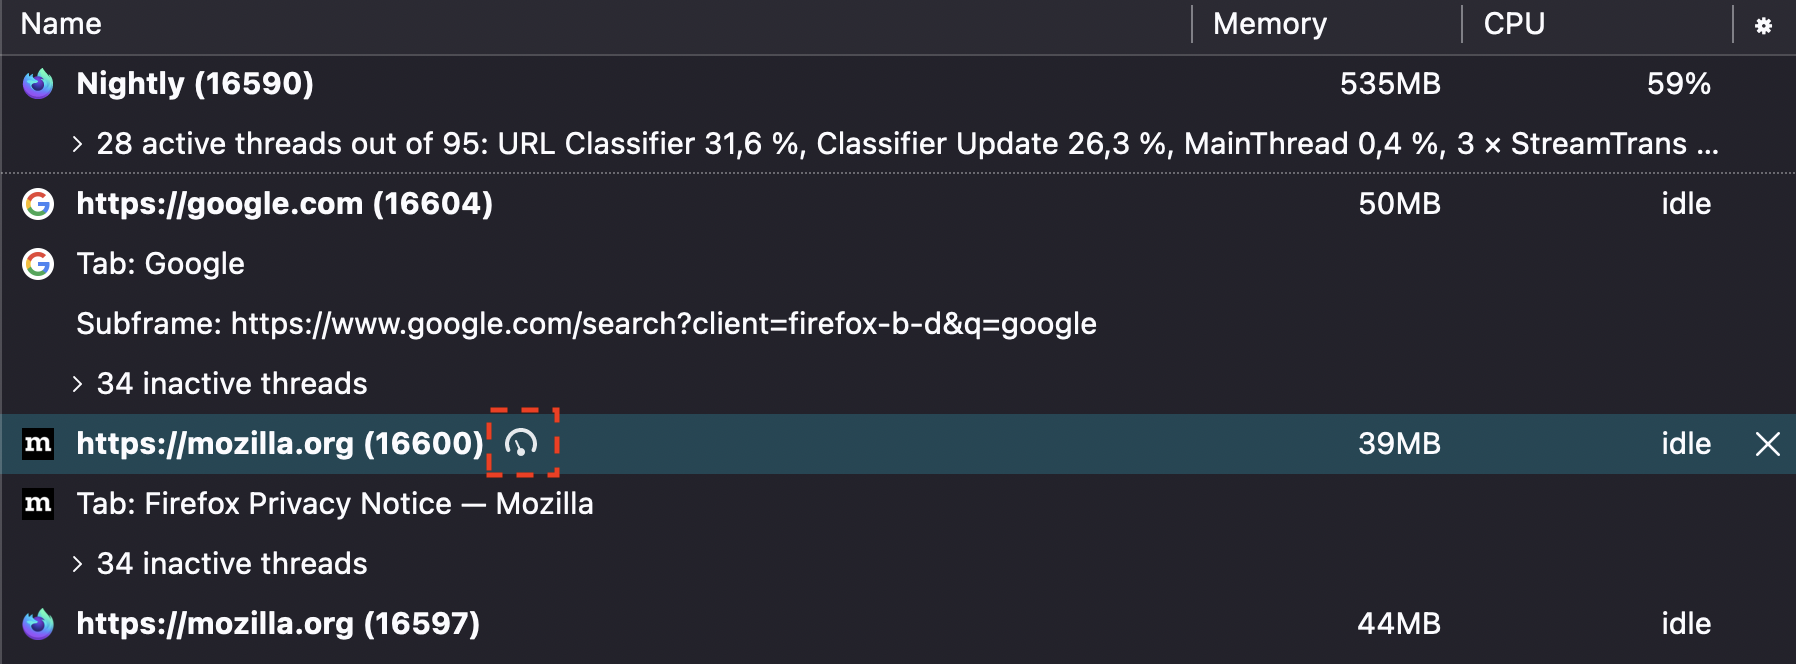
In the about:processes page, it’s possible to see all the Firefox processes and their information. In addition to that, now it’s possible to profile directly through this page with only one click. When you hover over a process, a profile button will appear at the right side of the process name. All you have to do is to click on this button and it will start profiling this specific process for 5 seconds. Once it’s finished, it will open the profiler analysis UI.
 Read profile buffer once to output all samples and markers

This was one of the performance improvements that we’ve worked on the back-end this quarter. Previously, we were reading the buffer twice for every thread (one for samples and one for markers). Now we are only doing this once and outputting all the threads. This improvement brings ~5x speed up during the profile serialization!
Localize the presets of Profiler capturing UI
We are done with localizing our profile analysis UI and we were also done with most of our profile capturing UI. Presets belong to the capturing UI for setting the relevant settings quickly. We’ve now finished the localization work for them as well and we are completely done with the profile capturing UI as well!
 Better front-end for experience for profiles with many threads

With Fission, we have more and more processes and threads in Firefox. Because of this, when a user profiles Firefox, they see a lot of threads as well. It’s both hard to navigate with lots of threads and it’s slower to load and use. To fix these issues we worked on various things:
UI improvements related to track finding
Add a search filter to the track context menu
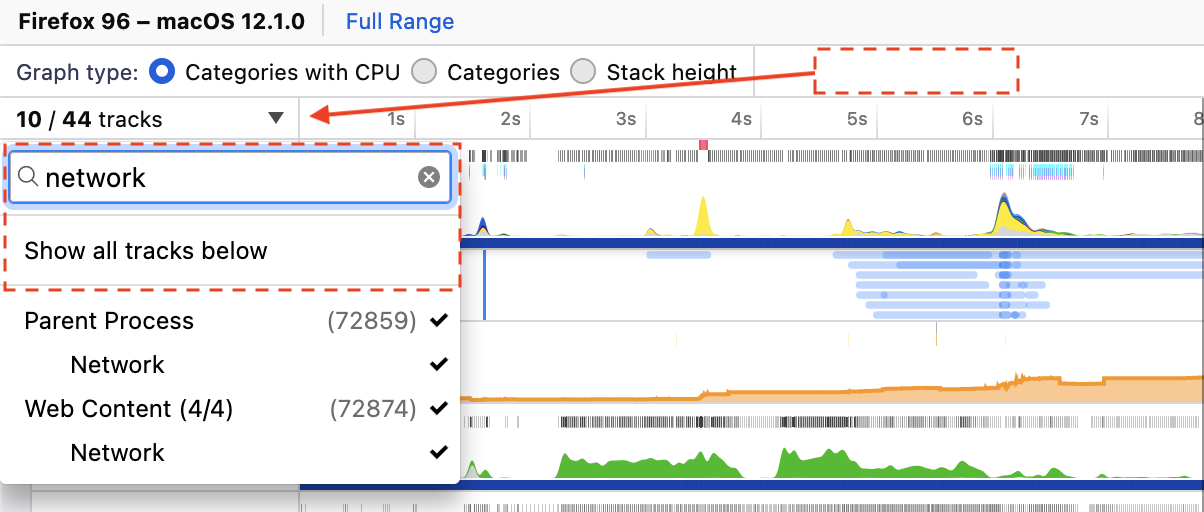
It’s hard to find the thread you are looking for when there are a lot of threads. To make this easier, we added a search filter in the main tracks context menu. This way, you can search and find the thread you are looking for easily.
Make it easier to use with a keyboard
Previously, our context menu wasn’t really keyboard friendly. It was resetting the selected state every time the user pressed enter. That was really annoying because it was making it hard to repetitively show or hide some threads. This task was a bit harder than expected because we were using a third party library for the context menu and it wasn’t maintained anymore for some time. That’s why we forked that library and fixed the issues ourselves.
Move the location of the main track context menu to the left side of the timeline.
Our tracks menu button was on the right side of the graph type radio buttons. That wasn’t really visible and our users actually expected it to be on the top of the tracks. So, we moved the track menu button to the left side where the tracks are.
Add “Show all tracks below” button after filtering
When you filter some search queries, now “Show all tracks below” will appear and you can make all the search filtered tracks visible by clicking it.
Here’s you can see the things we changed related to tracks menu:
 Default visible thread list computation changes.

We’ve changed how we compute the default visible threads when a profile first loads. Previously, it was possible to see a lot of threads in a big profile. Now we’ve limited the visible threads to 15 and we started to get the most active threads among them.
Performance improvements
Besides UX changes, it’s also important to make sure that we can show many threads without becoming too slow. We’ve worked on some performance improvements to guarantee that Firefox Profiler still works without a problem with many threads like removing costly getBoundingClientRect calls from canvases. There are still more improvements to be done in the timeline to improve the performance and we are still working on it.
Profiling for all the threads
Sometimes it may be possible that you don’t know which thread to profile or you are uncertain about it. In cases like that, it might be a good idea to profile all the threads. In the about:profiling page we have various features now that you can enable. Currently there are 3 options:
- CPU Utilization – All Threads: For profiling CPU utilization values of all the threads
- Periodic Sampling – All Threads: For sampling all the threads. Beware that it will increase the overhead significantly!
- Markers – All Threads: For collecting markers from all the threads.
You can also combine these features to profile multiple of these values. But it’s good to keep in mind that all of them will increase the overhead of profiling and you should use it at your own discretion.
Periodically discovering unregistered threads
This is also another new feature we have in the about:profiling page. It will periodically discover all the unregistered threads and record their CPU utilization for them. For now, they show up as markers in the main thread, but they will eventually have better UI. Also it increases the overhead of profiling a lot, especially on Windows. So, be careful while using it.
Other improvements
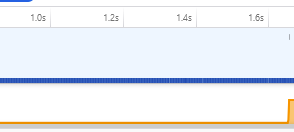
- Output extra counters before each change, for more accurate graphs.
- This is one of the correctness improvements that we’ve worked on.
Before (Notice the long orange slope, giving the wrong impression that memory usage is gradually increasing):
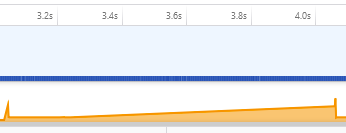 After (Notice the long horizontal orange line before the sudden jump):
- This is one of the correctness improvements that we’ve worked on.
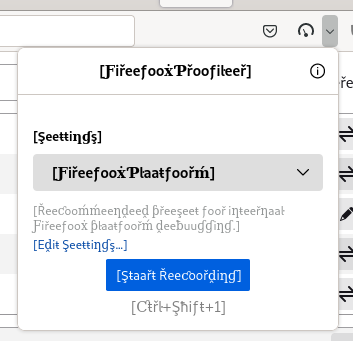
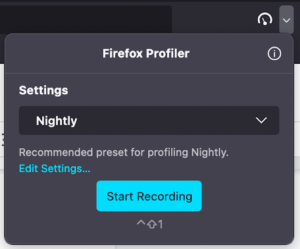
- Show “Edit Settings…” button for non-custom presets as well in the profile capturing UI.
- Previously we were only showing this “Edit Settings…” button when the custom preset is selected. That was annoying because if a user had to change the settings, first they had to select the custom preset. Now they don’t have to do that since we display this button all the time.
- Previously we were only showing this “Edit Settings…” button when the custom preset is selected. That was annoying because if a user had to change the settings, first they had to select the custom preset. Now they don’t have to do that since we display this button all the time.
- Fixed the tooltip positioning in the Marker Chart.
- Previously, it was showing the marker tooltips in wrong places or it was jumping around too much. Now it’s fixed and it should show up more seamlessly.
- Remove the old profiler related Rust code and start to use our new API.
- We’ve added our Rust API right before the Q3. In Q4, we’ve worked on removing the preexisting profiler related codes from various Rust projects and replaced them with our new API. That way, we removed a lot of code duplication and we started to use our canonical Rust API.
- Buffer size units for startup profiling
- We are using some environment variables to capture a startup profile. With this change
MOZ_PROFILER_STARTUP_ENTRIESnow accepts various buffer sizes like 512MiB. This was implemented by our contributor, Neel Chauhan, thank you!
- We are using some environment variables to capture a startup profile. With this change
- Easier profiling browser mochitest failures.
- Now it’s as easy as running
./mach try fuzzy <path to folder with bc tests> --env MOZ_PROFILER_STARTUP=1to get profiles of browser chrome mochitest failures. You will be able to see the output profiles in the artifacts.
- Now it’s as easy as running


Contributors in Q4 2021
Lots of awesome people contributed to our codebases both on GitHub and mozilla-central in. We are thankful to all of them! Here’s a list of people who contributed to Firefox Profiler code:
- Florian Quèze (fqueze)
- Gerald Squelart (squelart)
- Julien Wajsberg (julienw)
- Mark Hansen (mhansen)
- Markus Stange (mstange)
- Neel Chauhan (neelchauhan)
- Nazım Can Altınova (canova)
- Paul Adenot (padenot)
- Steve (steveadams)
- Steve Fink (hotsphink)
Thanks a lot!
Conclusion
Thanks for reading! If you have any questions or feedback, please feel free to reach out to me on Matrix (@canova:mozilla.org). You can also reach out to our team on Firefox Profiler channel on Matrix (#profiler:mozilla.org).
If you profiled something and are puzzled with the profile you captured, we also have the Joy of Profiling (#joy-of-profiling:mozilla.org) channel where people share their profiles and get help from the people who are more familiar with the Firefox Profiler. In addition to that, we have the Joy of Profiling Open Sessions where some Firefox Profiler and Performance engineers gather together on a Zoom call to answer questions or analyze the profiles you captured. It’s usually happening every Monday, and you can follow the “Performance Office Hours” calendar to learn more about it.
No comments yet
Comments are closed, but trackbacks are open.